Introduction
Our understanding of dynamic fracture mechanisms is facilitated by nanomechanics at the beginning of this century [Reference Buehler and Gao1, Reference Swadener, Baskes and Nastasi2, Reference Belytschko, Xiao, Schatz and Ruoff3]. It has been demonstrated that the propagation of a Griffith crack can be predicted by the Yoffe’s model in the case of harmonic and linear elastic materials [Reference Freund4, Reference Broberg5, Reference Yoffe6] and by the Gao’s model in the case of hyperelastic materials [Reference Gao7, Reference Gao8, Reference Gao9]. In recent years, the interface effects on dynamic fracture have been of considerable interest. In 2017, Rezaei et al. constructed a mechanical model to predict fracture and damage in micro-/nanocoating systems by using the cohesive zone element technique implemented at grain boundaries as well as in the interface between the coating and the substrate [Reference Rezaei, Wulfinghoff and Reese10]. Daniel et al. found that the fracture toughness of ceramic nanostructured materials can be improved more than 150% by a dedicated grain boundary orientation design with respect to the direction of the expected crack path without the loss of hardness [Reference Daniel, Meindlhumer, Baumegger, Zalesak, Sartory, Burghammer, Mitterer and Keckes11]. Through atomistic study, Tehranchi et al. studied the underlying mechanism of hydrogen embrittlement of grain boundaries in nickel [Reference Tehranchi and Curtin12]. In particular, grain boundaries are ubiquitous and influence the growth and propagation of cracks [Reference Leitner, Scheiber, Jakob, Primig, Clemens, Povoden-Karadeniz and Romaner13], since the interface energy plays a key role in fracture [Reference Hull and Rimmer14].
The complexities due to the three-dimensional (3D) nature of grains and cracks render it challenging to understand the mechanisms of crack propagation in materials with grain boundaries [Reference Anderson15, Reference Holland and Marder16, Reference Holian and Ravelo17]. For simplicity, some fundamental mechanisms can be revealed via studying the crack propagation of 2D or quasi-3D materials [Reference Bittencourt, Wawrzynek, Ingraffea and Sousa18, Reference Rafii-Tabar, Hua and Cross19, Reference Mas-Balleste, Gomez-Navarro, Gomez-Herrero and Zamora20]. In 2004, graphene, the first 2D material, was discovered [Reference Novoselov, Geim, Morozov, Jiang, Zhang, Dubonos, Grigorieva and Firsov21]. Due to its fascinating properties such as extremely high electron mobility [Reference Bolotin, Sikes, Jiang, Klima, Fudenberg, Hone, Kim and Stormer22], high strength [Reference Lee, Wei, Kysar and Hone23], high elasticity [Reference Kim, Zhao, Jang, Lee, Kim, Kim, Ahn, Kim, Choi and Hong24], quantum electronic transport [Reference Özyilmaz, Jarillo-Herrero, Efetov, Abanin, Levitov and Kim25], and electromechanical modulation [Reference Bunch, Van Der Zande, Verbridge, Frank, Tanenbaum, Parpia, Craighead and McEuen26], graphene has been of sustained interest. Through nanoindentation experiments, Lee et al. [Reference Lee, Wei, Kysar and Hone23] measured the in-plane tensile properties of graphene: its Young’s modulus is about 1.0 ± 0.1 TPa, and its strength is about 130 ± 10 GPa. From the atomic force microscope (AFM) experiments by Tanenbaum et al. [Reference Frank, Tanenbaum, van der Zande and McEuen27], the spring constants of graphene are obtained as 1–5 N/m, the equivalent Young’s modulus of doubly clamped beams under tension is estimated as 0.5 TPa, and the in-plane Young’s modulus of graphene is determined to be about 1.0 TPa. Since graphene is a 2D structure with a single layer of carbon atoms arranged in a hexagonal lattice, it is an ideal model material to investigate dynamic fracture in a 2D discrete atomistic system. On the one hand, this 2D nanostructure can reduce the variables in the theoretical mechanical model and simplify the problem. On the other hand, for molecular dynamics (MD) simulations, the in-plane dimensions can be taken to be adequately large (e.g., up to micrometers) to minimize the sample size effects on both the fracture modes and loading without significantly increasing the computational cost.
Considerable efforts have already been dedicated to crack evolution in graphene to investigate the fundamental mechanisms of dynamic fracture in 2D materials [Reference Zhang, Li and Gao28, Reference Akinwande, Brennan, Scott Bunch, Egberts, Felts, Gao, Huang, Kim, Li, Li, Liechti, Lu, Park, Reed, Wang, Yakobson, Zhang, Zhang, Zhou and Zhu29, Reference Gupta, Sakthivel and Seal30]. In general, cracks propagate along the zigzag direction in pristine graphene following the path of the minimal fracture surface energy [Reference Le and Batra31, Reference Orowan32]. In 2005, Wei et al. found that the Griffith criterion remains valid for cracks down to 10 nm but overestimates the strength of shorter cracks [Reference Yin, Qi, Fan, Zhu, Wang and Wei33]. In this situation, the local strength-based failure criterion is more suitable than energy-based Griffith criterion in describing crack propagation in graphene. Actually, the discontinuous effect in graphene is ubiquitous and highly affects the mechanical behavior such as transverse waves [Reference Liu, Wang and Wu34], buckling [Reference Liu, Wang and Wu35], and twisting [Reference Liu, Wang and Wu36]. Different from ordinary 3D materials, the fracture surface energy of graphene is due to in-plane breaking of carbon–carbon bonds [Reference Yin, Qi, Fan, Zhu, Wang and Wei33, Reference Geim37]. Hence, grain boundaries (a type of atomistic defects) may have a pronounced effect on fracture of graphene [Reference Lee, Cooper, An, Lee, Van Der Zande, Petrone, Hammerberg, Lee, Crawford, Oliver, Kysar and Hone38]. Although Ruoff et al. found that the tilt grain boundaries with large angles do not have significant impact on the fracture strength of graphene [Reference Grantab, Shenoy and Ruoff39], the defects may lead to crack propagation [Reference Wang, Yan, Ma, Hu and Chen40]. The experiments conducted by Lopez-Polin et al. suggest defect control as an approach to avoid catastrophic failure in graphene [Reference López-Polín, Gómez-Herrero and Gómez-Navarro41]. In general, cracks in pristine graphene can propagate steadily at low speeds and create atomically flat mirror-like surfaces [Reference Le and Batra42]. However, physical disturbances (e.g., temperature, defects, loading) can result in fracture instabilities with irregularly faceted surfaces [Reference Budarapu, Javvaji, Sutrakar, Roy Mahapatra, Zi and Rabczuk43]. In addition, there are three basic ways of applying a force to enable crack propagation: opening (mode I), sliding (mode II), and tearing (mode III). Mode I fracture of graphene is the most studied problem at present based on the Griffith criterion [Reference Anderson15]. Dynamic fracture instabilities of polycrystalline graphene have rarely considered grain size effects, especially for tear loading, which is still one of the significant yet unresolved issues related to the fracture of graphene [Reference Sen, Novoselov, Reis and Buehler44].
In this work, we conduct MD simulations and theoretical analysis to investigate the grain size effects on dynamic fracture instabilities of graphene monolayer under tear loading. For polycrystalline graphene with a specified grain size, as the nominal crack tip velocity increases to a critical value, dynamic fracture instability occurs, leading to deflection or branch of cracks. The critical velocity of instability is significantly affected by graphene grain size, and the underlying mechanisms of fracture instabilities are revealed. Our results would also provide a valuable insight into dynamic fracture of polycrystalline graphene as well as other 2D and quasi-2D materials.
Results and discussion
Dynamic fracture of polycrystalline graphene under tear loading
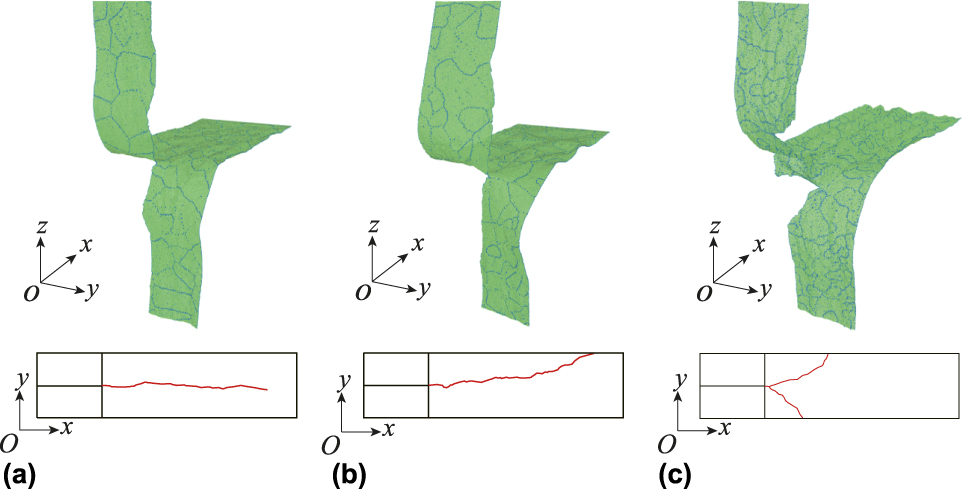
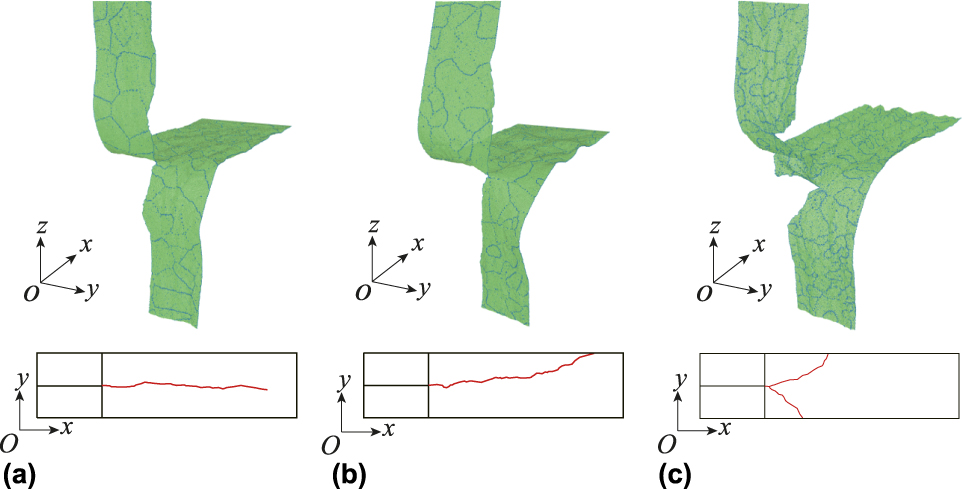
MD simulations are performed to explore dynamic fracture of polycrystalline graphene as well as pristine graphene. Three representative samples (Fig. 1) are selected to show different fracture behaviors under tear loading. For pristine graphene, dynamic fracture instability is difficult to occur under tear loading, consistent with a previous result [Reference Moura and Marder45]. In a pristine graphene sheet, crack propagates along the zigzag direction due to the minimal fracture surface energy (10 J/m2) [Reference Khare, Mielke, Paci, Zhang, Ballarini, Schatz and Belytschko46]. When the initial crack is not along the zigzag direction, although the crack surfaces are not strictly mirror-like, they are usually periodically bent along the zigzag direction after deflection corrections. Thus, the crack still approximately propagates along a straight line (here this line is the axle line of the graphene sheet). This is also consistent with a previous study [Reference Yin, Qi, Fan, Zhu, Wang and Wei33]. According to macroscopic mechanical theory, the crack should propagate along the axle line of graphene sheet under tear loading. For polycrystalline graphene, crack may propagate along a straight line [Fig. 1(a)], deflect toward boundary due to instability [Fig. 1(b)], or branch [Fig. 1(c)], depending on grain size D and crack tip velocity v t. In general, deflecting and branching of cracks are considered as the two main types of dynamic fracture instabilities [Reference Buehler and Gao1]. However, since the MD simulation is performed at room temperature, there inevitably exists physical disturbance induced by thermal fluctuations. Crack propagation is a highly localized mechanical behavior of materials and insensitive to the far field. According to our MD simulations, at different dimensions (W, L) of graphene sheet (W = 50, 100, and 200 nm, and L = 200, 400, and 600 nm), the deflection of stable cracks is generally less than 10 nm, similar to literature results [Reference Yin, Qi, Fan, Zhu, Wang and Wei33]. Thus, in the following discussion of a straight line, we allow a deviation of ±10 nm along the y-axis from this line. As long as the crack path fluctuates within this range and eventually reaches the end of region V, the crack propagation is considered steady.
Atomic configurations of propagating cracks (top row) and crack tip trajectories (bottom row) in polycrystalline graphene with (a) D = 11.3 nm and v t = 1.7 km/s (straight propagation), (b) D = 9.0 nm and v t = 1.1 km/s (crack deflection), and (c) D = 2.3 nm and v t = 1.8 km/s (crack branching).
In Yoffe’s and Gao’s theories, crack tip velocity is considered to play a dominant role in dynamic fracture [Reference Buehler and Gao1, Reference Freund4, Reference Broberg5, Reference Yoffe6]: for brittle materials, the Griffith cracks moving at low speeds create atomically flat mirror-like surfaces; at higher speeds, rougher, less reflective (mist) and finally very rough, irregularly faceted (hackle) surfaces form. Although the in-plane strength of graphene is extremely high [Reference Lee, Wei, Kysar and Hone23], its toughness is close to that of brittle materials [Reference Zhang, Ma, Fan, Zeng, Peng, Loya, Liu, Gong, Zhang, Zhang, Ajayan, Zhu and Lou47]. Thus, crack can propagate along a straight line when v t is below a critical velocity  $v_{\rm{t}}^{{\rm{crit}}}$, while it deflects or branches when v t is above
 $v_{\rm{t}}^{{\rm{crit}}}$. For a Griffith crack,
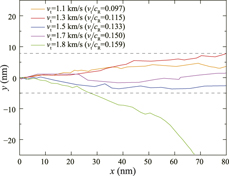
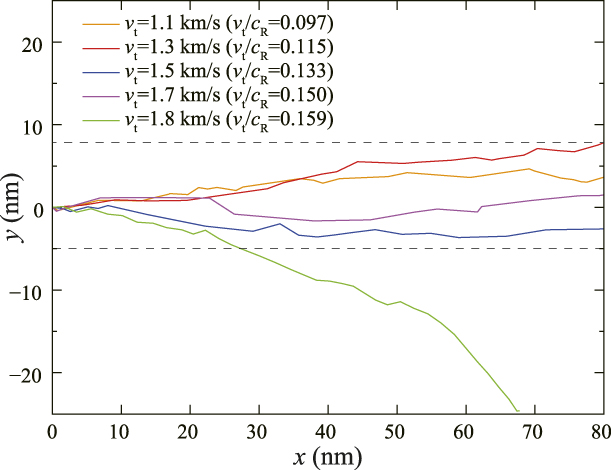
 $v_{\rm{t}}^{{\rm{crit}}}$ is normally less than 73% of the Rayleigh wave speed. Similar phenomena occur for crack propagation in graphene under tear loading. For the same polycrystalline graphene sheet with D = 11.3 nm, when v t < 1.7 km/s, cracks approximately propagate along straight lines in a narrow interval −5 nm < y < 7.5 nm (Fig. 2). When v t > 1.8 km/s, the crack deflects rapidly to the boundary, which leads to a separation of one piece of graphene. This indicates that, under tear loading, there also exists a critical velocity
 $v_{\rm{t}}^{{\rm{crit}}}$ beyond which crack instability occurs, in the forms of deflection or branching of cracks. Below
 $v_{\rm{t}}^{{\rm{crit}}}$, crack can propagate steadily, roughly along a straight line. Although there are some deflections along the y-axis, the cracks with v t < 1.8 km/s eventually reach the end of region V, but not the boundaries along the y-axis. Thus, according to the definition above, the propagation of these cracks is considered steady.
Crack propagation paths in the same polycrystalline graphene sheet with D = 11.3 nm at different v t.
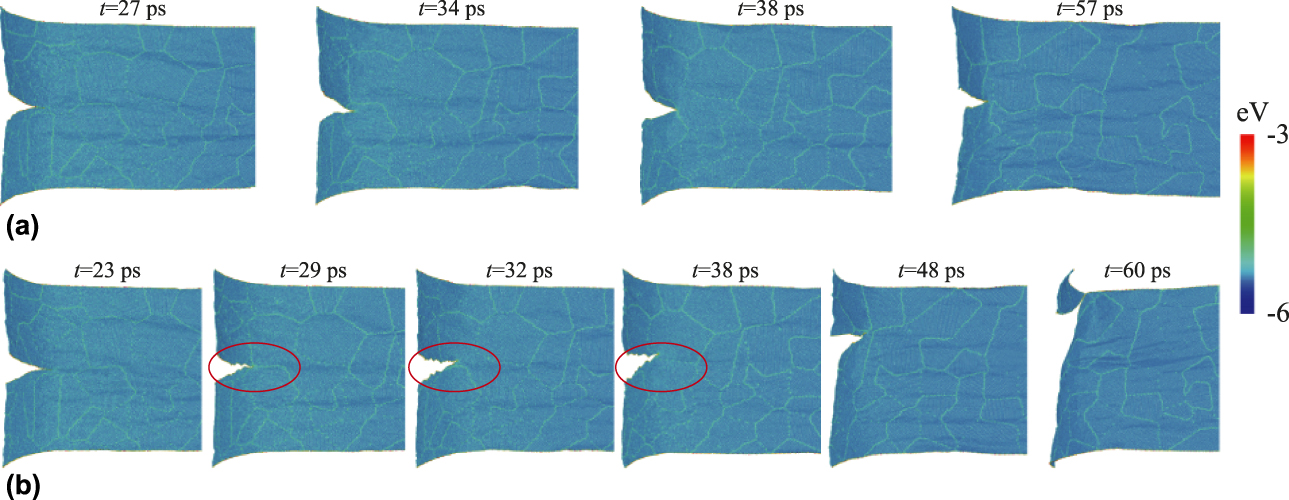
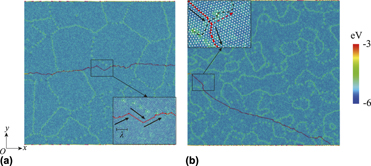
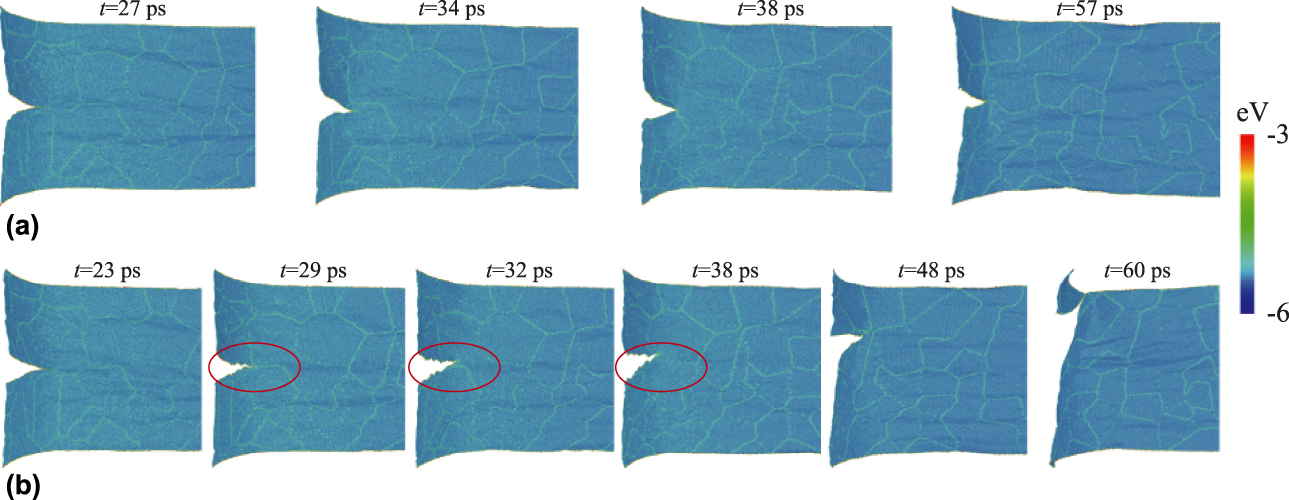
To understand the atomistic mechanisms of crack stability or instability, crack propagation details for D = 11.3 nm at v t = 1.7 km/s and v t = 1.8 km/s are compared in Fig. 3. At v t = 1.7 km/s, the crack surfaces are flat [Fig. 3(a)]. Although the potential energy of atoms at grain boundaries is higher than that of other atoms, the propagation of crack is not influenced by grain boundaries. In this case, the macroscopic force plays a dominant role in crack evolution. According to the analytical solution based on the symmetry theory [Reference Freund4], crack should propagate along the central axis of the graphene sheet (a straight line). However, due to thermal fluctuations at the nanoscale, it is impossible for the crack to propagate strictly along a straight line, so small deviations from the expected straight are observed (Fig. 2). This is also consistent with a previous study on the Griffith crack propagation [Reference Budarapu, Javvaji, Sutrakar, Roy Mahapatra, Zi and Rabczuk43]. At v t = 1.8 km/s, the crack surfaces become severely roughened [the red circles in Fig. 3(b)]. When the crack encounters a grain boundary parallel to the propagation direction, its tip deflects to one side of this grain boundary [t = 32 ps in Fig. 3(b)]. However, the crack tip cannot cross this parallel grain boundary again [t = 38 ps in Fig. 3(b)]. In this situation, the crack can only deflect to one side of the graphene sheet, and eventually the tear loading is balanced by dynamic fracture instability [t = 60 ps in Fig. 3(b)]. In other words, once v t is above  $v_{\rm{t}}^{{\rm{crit}}}$, the deflection of crack is rapidly amplified by grain boundaries, which are directly related to grain size D.
Crack propagation snapshots in polycrystalline graphene with D = 11.3 nm at (a) v t = 1.7 km/s and (b) v t = 1.8 km/s. Color coding refers to potential energy.
The response of polycrystalline graphene under tear loading gives rise to two issues: three types of crack propagation (straight, deflecting, and branching) are observed at different (v t, D); for a specific grain size, the crack propagation becomes unstable as v t increases to a critical value  $v_{\rm{t}}^{{\rm{crit}}}$. Thus, it is necessary to perform MD simulations at different (v t, D) to reveal the underlying mechanism of these two issues.
Grain-induced instability of dynamic fracture
The analysis presented in the previous section indicates that for a specified grain size D, there exists a critical value of v t, i.e.,  $v_{\rm{t}}^{{\rm{crit}}}$, beyond which fracture instability occurs. Thus, the stability of a crack is affected by both grain size D and its propagation velocity v t (which in turn depends on load σ). To explore the effects of these two factors, thousands of MD simulation runs are performed at different (v t, D) values. As mentioned in section “Models and methods,” multiple polycrystalline graphene configurations with the same grain size are constructed for simulations under the same conditions. However, even for a given grain size D, the configurations generated by phase field crystal (PFC) simulations are different in grain boundary distribution due to the randomness of grain seeds. Thus, for the configurations with the same D but different grain boundary characteristics, their critical velocities
 $v_{\rm{t}}^{{\rm{crit}}}$ are different.
The stability phase diagram of Ψ(D, v t) is obtained in Fig. 4(a). This diagram can be divided into three regions: stable, metastable, and unstable. In the stable region, the cracks approximately propagate along a straight line in a narrow y-range, −10 nm < y < 10 nm. In the unstable region, the cracks deflect toward the boundaries or branch rapidly. In the metastable region, both metastable and stable cracks are observed at a same (v t, D) pair. The stable and unstable regions are separated by this metastable region. The metastable region is related to random grain boundary characteristics, an unsolved and complex problem in fracture mechanics [Reference Anderson15, Reference Zhang, Li and Gao28]. The stability of crack is determined by grain size D, tip velocity v t and grain boundary characteristics. However, it is challenging to incorporate grain boundary characteristics in mechanical models [Reference Priester48]. Thus, we use probability Ψ to consider the effects of grain boundary characteristics. For the polycrystalline graphene with a specified grain size D, there are upper  $\left( {v_{\rm{t}}^{{\rm{crit + }}}} \right)$ and lower
 $\left( {v_{\rm{t}}^{{\rm{crit}} - }} \right)$ limits for critical tip velocity v t due to the existence of a metastable region. When
 ${v_{\rm{t}}} > v_{\rm{t}}^{{\rm{crit + }}}$ or
 ${v_{\rm{t}}} \lt v_{\rm{t}}^{{\rm{crit}} - }$, the effects of grain boundary characteristics can be neglected. In the case of
 ${v_{\rm{t}}} > v_{\rm{t}}^{{\rm{crit + }}}$, dynamic fracture instability occurs regardless of grain boundary characteristics. In the case of
 ${v_{\rm{t}}} \lt v_{\rm{t}}^{{\rm{crit}} - }$, the crack can propagate steadily without deflection or branching, regardless of grain boundary characteristics. When
 $v_{\rm{t}}^{{\rm{crit}} - } \lt {v_{\rm{t}}} \lt v_{\rm{t}}^{{\rm{crit + }}}$, the stability of a crack is specimen dependent due to grain boundary effects. Defining the critical velocity of crack instability in a strict sense, we take
 $v_{\rm{t}}^{{\rm{crit}}} = v_{\rm{t}}^{{\rm{crit + }}}$ in the following discussion, since it is still possible for cracks to propagate steadily when
 $v_{\rm{t}}^{{\rm{crit}} - } \lt {v_{\rm{t}}} \lt v_{\rm{t}}^{{\rm{crit + }}}$. This is also consistent with the results in previous studies [Reference Buehler and Gao1, Reference Zhang, Li and Gao28, Reference Zhang, Li, Kadkhodaei and Gao49].
(a) D − v t diagram of crack stability parameter Ψ for polycrystalline graphene. Ψ = 0: stable, Ψ = 1: unstable, and 0 < Ψ < 1: metastable. (b)  $v_{\rm{t}}^{{\rm{crit}}} - D$ curve of polycrystalline graphene. Critical velocity
 $v_{\rm{t}}^{{\rm{crit}}}$ increases with increasing grain size D.
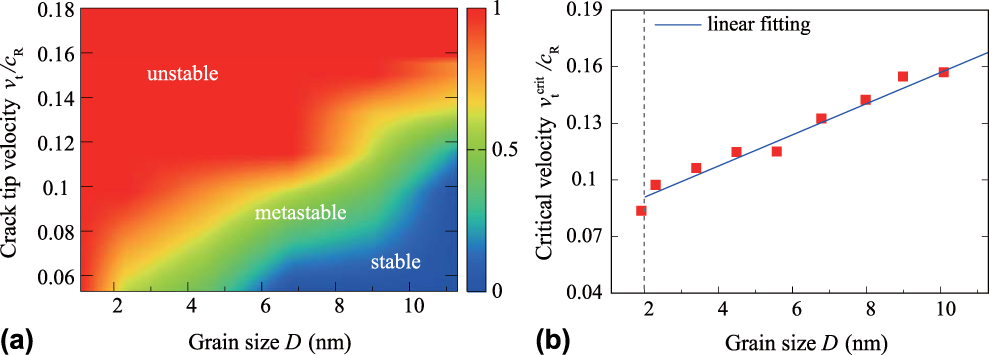
We plot the critical velocity  $\left( {v_{\rm{t}}^{{\rm{crit}}}} \right)$ as a function of grain size D in Fig. 4(b).
 $v_{\rm{t}}^{{\rm{crit}}}$ increases with increasing D, and
 $v_{\rm{t}}^{{\rm{crit}}}\left( D \right)$ can be approximately described with a linear relation. For D < 2 nm (MD simulations with v t < 0.6 km/s are performed), there does not exist a critical velocity for steady crack propagation in polycrystalline graphene. Actually, Gao et al. found that, when the grain size was overly small, crack path becomes completely unpredictable, even though theoretically, there are stress concentration areas [Reference Zhang, Li, Kadkhodaei and Gao49]. In such cases, critical grain size dominates dynamic fracture of polycrystalline graphene. Our MD simulations [Fig. 4(b)] suggest a critical grain size of ∼2.0 nm; this value is also close to the out-of-plane discontinuous effect scale of graphene [Reference Liu, Wang and Wu35]. In addition, when characteristic scale is less than 2 nm, there will be a strong discontinuous effect in graphene [Reference Liu, Wang and Wu34]. Thus, this phenomenon is consistent with the discontinuous effects proposed by the previous studies [Reference Liu, Wang and Wu34, Reference Liu, Wang and Wu35, Reference Zhang, Li, Kadkhodaei and Gao49].
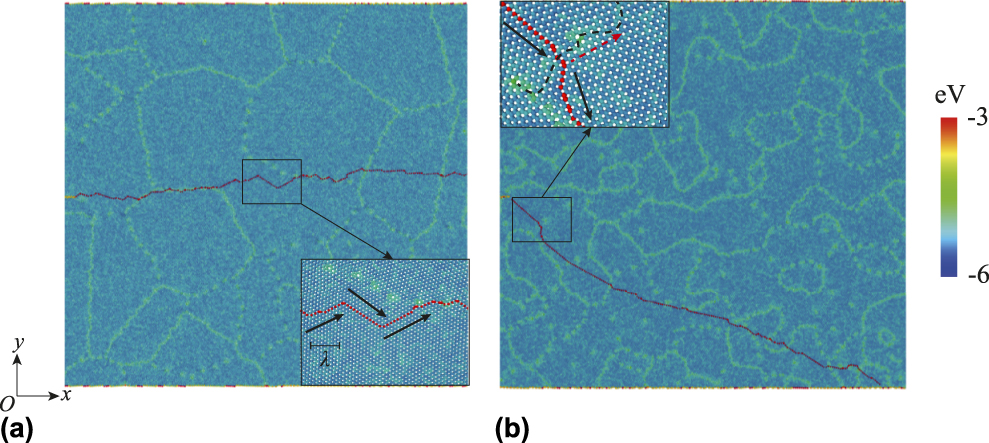
Although potential energy of atoms at grain boundaries is higher than that of other atoms, surface (fracture) energy is not significantly affected [Reference Grantab, Shenoy and Ruoff39]. When crack propagates steadily, transgranular and intergranular fractures exist simultaneously [Fig. 5(a)]. As discussed in section “Dynamic fracture of polycrystalline graphene under tear loading,” crack always propagates along the zigzag direction due to the minimal surface energy. When grain size is sufficiently large [the inset in Fig. 5(a)], there exists a space for crack to propagate alternately in different zigzag directions under tear loading: a small deflection from the x-axis is corrected to the central axis within a horizontal length λ (along the x-axis). In this situation, macroscopic structural stress plays the dominant role. However, when the grain size is extremely small [Fig. 5(b)], before the crack tip starts to be corrected, it encounters a grain boundary, which delays the correction process with an additional deflection. Thus, the deflection of crack could not be corrected, and eventually dynamic instability occurs. Gao’s models suggest that there exists a characteristic time scale Δt for dynamic fracture [Reference Gao7, Reference Gao8, Reference Gao9], and Δt = λ/v t, where λ < D. As D decreases, the maximum λp allowed and critical velocity  $v_{\rm{t}}^{{\rm{crit}}}$ decrease. Thus, the critical velocity
 $v_{\rm{t}}^{{\rm{crit}}}$ can be estimated as follows:
 $$v_{\rm{t}}^{{\rm{crit}}} = {{{\lambda _{\rm{p}}}} / {\Delta t}} \approx {D / {\Delta t}} \Rightarrow v_{\rm{t}}^{{\rm{crit}}} \propto D\quad .$$
(a) Steady crack propagation for D = 11.3 nm. (b) Deflection of crack propagation for D = 4.5 nm. The atoms on crack surfaces are colored red. Insets: black line arrows, red dotted arrows, and black dotted lines represent crack propagation directions, corrected propagation directions, and grain boundaries, respectively.

This is consistent with the linear relationship between  $v_{\rm{t}}^{{\rm{crit}}}$ and D [Fig. 4(b)]. It should be noted that the effect of grain boundary characteristics is not considered in the discussion above, since we mainly focus on the cases of
 ${v_{\rm{t}}} > v_{\rm{t}}^{{\rm{crit + }}}$. Grain boundary characteristics and grain size generally affect intergranular and transgranular fractures in polycrystalline graphene. However, as shown in Fig. 5(b), beyond the critical velocity, intergranular and transgranular fractures occur simultaneously. Thus, this linear relationship is valid for predicting the upper limit of critical velocity. The metastable region is highly influenced by grain boundary characteristics and still remains an unsolved subject in fracture mechanics.
Conclusion
Dynamic fracture instability in polycrystalline graphene is explored at different crack tip velocities and grain sizes (up to 11 nm). The crack instability phase diagram v t − D is obtained, consisting of stable, metastable, and unstable regions. For a given grain size (D ≥ 2 nm), there exists a critical velocity  $v_{\rm{t}}^{{\rm{crit}}}$, beyond which dynamic fracture instability occurs with roughened fracture surfaces.
 $v_{\rm{t}}^{{\rm{crit}}}$ depends linearly on grain size:
 $v_{\rm{t}}^{{\rm{crit}}} \approx {D / \tau }$. Decreasing D leads to reduced characteristic time τ for deflection correction, which plays a dominant role in dynamic fracture instabilities. When D < 2 nm, there does not exist a critical velocity
 $v_{\rm{t}}^{{\rm{crit}}}$ for steady propagation of cracks due to discontinuous effects.
Models and methods
Molecular dynamics simulation
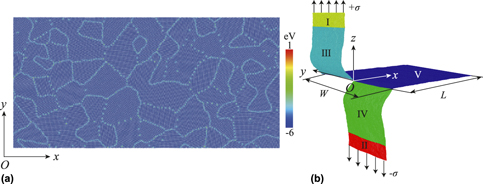
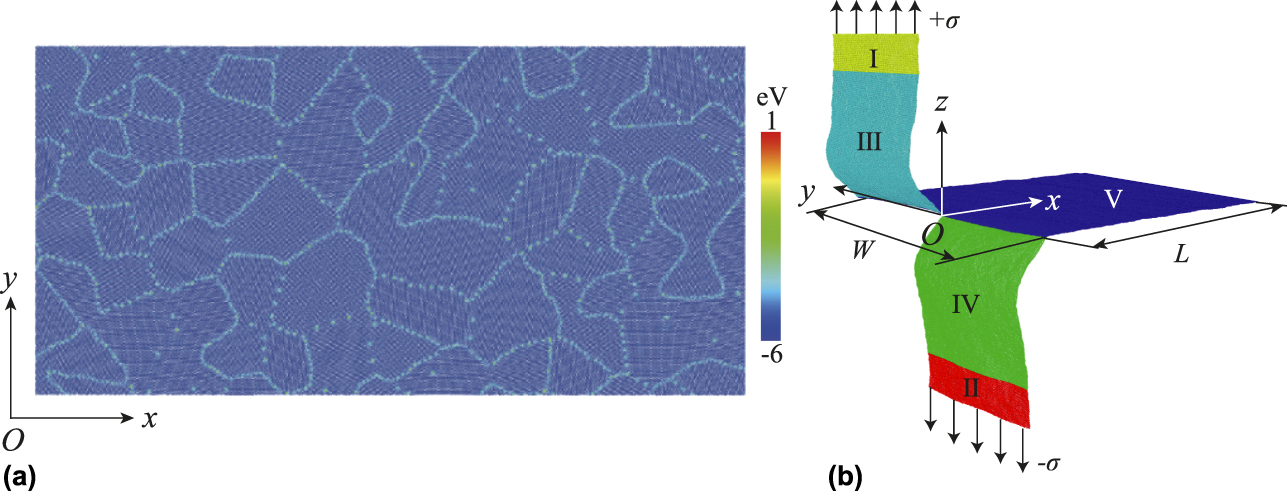
Realistic polycrystalline graphene configurations are obtained from PFC simulations with a code developed by Hirvonen et al. [Reference Hirvonen, Ervasti, Fan, Jalalvand, Seymour, Allaei, Provatas, Harju, Elder and Ala-Nissila50]. The average grain size D is estimated as  $\sqrt {{{4S} / {N\pi }}}$, where S is the total area of polycrystalline graphene and N is the number of grains. Grain boundary atoms have higher potential energy than other atoms [Fig. 6(a)]. Periodic boundary conditions are applied along the y-axis to ensure a zero pressure conditions with a vacuum space of 2 nm [Fig. 6(b)]. Fixed boundary conditions are applied along the x- and z-axes with a sufficiently large vacuum space (the dimensions of a simulation box are fixed along the x- and z-axes). A pair of uniaxial stresses with opposite directions but the same amplitude, ±σ, is applied in regions I and II, respectively. The lengths of regions I and III along the z-axis are set at 12 nm. The atomic interactions between regions III and IV [Fig. 6(b)] are excluded to generate an initial crack, and cracks propagate in region V. The crack propagation is mainly characterized in region V, and the length of this region is over 100 nm to allow for sufficiently long evolution of cracks. The end of region V is fixed to avoid wrinkling during relaxing and tearing simulations. The width of polycrystalline graphene sheet W is set to 50 nm. Since there exist deflection and branching of cracks (see below), we define the nominal crack tip velocity, v t, as the component of the real crack tip velocity along the x-axis. The nominal crack tip velocity v t can be regulated by changing σ, which increases with increasing σ. Stable cracks propagate approximately along the x-axis, and v t is close to the real crack tip velocity. For unstable cracks, v t is still close to the initial real crack tip velocity.
(a) Partial configuration of polycrystalline graphene generated by PFC simulations. Color coding referred represents potential energy. (b) Schematic of tearing loading of polycrystalline graphene. A pair of stress of opposite directions but the same amplitude, ±σ, is applied in regions I and II, respectively. The atomic interactions between regions III and IV are excluded. Crack propagation is mainly characterized in region V.
The MD simulations are performed with an open source code LAMMPS [Reference Plimpton51]. We use the Stillinger–Weber (SW) potential recently developed by Hossain et al. for graphene [Reference Hossain, Hao and Silverman52], which can describe the elasticity and fracture of graphene as accurately as the adaptive intermolecular reactive empirical bond order (AIREBO) potential [Reference Hossain, Ahmed, Silverman, Khawaja, Calderon, Rutten and Tse53]. Thus, here we choose this SW potential to describe the atomic interactions between carbon atoms. The time step of all MD simulations is set to 1 fs. Visualization is achieved with OVITO [Reference Stukowski54]. Before tear simulations, the initial configurations are relaxed with the isothermal–isobaric (NPT) ensemble under periodic boundary conditions in the xy-plane for 100 ps at 300 K, and the pressure is set to 0 to ensure no initial stress in the graphene sheet. The tear simulations are performed with the microcanonical (NVE) ensemble, and the periodic boundary conditions are still applied along the y-axis to ensure a zero pressure (a vacuum space of 2 nm is added). Therefore, there is only one crack in the graphene sheet (in the middle). For statistics, we construct multiple polycrystalline configurations (over 5) for a given grain size. Each configuration contains 100–10,000 grains in a 50 × 200 nm2 graphene sheet, corresponding to grain size D ranging from 1.1 to 11.3 nm (D = 1.1, 2.2, 4.5, 6.8, 9.0, or 11.3 nm). The crack tip velocity v t ranges from 0.6 to 1.8 km/s (0.6, 1.1, 1.3, 1.5, 1.7, 1.75, 1.8 km/s). The theoretical Rayleigh wave speed of pristine graphene c R is about 11.3 km/s regardless the out-of-plane deformation, and the maximum crack speed of graphene can reach about 0.71 c R (∼8.0 km/s) [Reference Xiao and Belytschko55]. According to our MD simulations, when v t is over 1.8 km/s, mode I crack may be induced. Thus, the maximum v t is set to 1.8 km/s. All the data presented in the discussion below are statistically averaged unless otherwise stated.
Statistical analysis
Crack tip field plays a dominant role in crack propagation [Reference Terdalkar, Huang, Yuan, Rencis, Zhu and Zhang56] and strongly depends on microstructure (e.g., the distribution of grain boundaries). However, there is not a method to effectively incorporate complex microstructure into mechanical parameters yet. Fracture stability of graphene sheet under tear loading can be considered as a generalized function:
 $$\Psi = \Psi \left( {{\bi{G}},{v_{\rm{t}}};\;C} \right)\quad ,$$
where C is known physical constants (e.g., atomic interaction between carbon atoms and temperature) and G represents microstructure of polycrystalline graphene. In this work, G is a set consisting of n elements:
 $${\bi{G}} = \left\{ {{G_1},{G_2},{G_3}, \cdots ,{G_n}} \right\}\quad ,$$
where G i (i = 1, 2, 3,…, n) represents the ith “microstructure.” Thus,
 $${{\boldPsi }} = \left\{ {{\Psi _1},{\Psi _2},{\Psi _3}, \ldots ,{\Psi _n}} \right\}\quad .$$
However, according to our MD results and previous studies [Reference Zhang, Ma, Fan, Zeng, Peng, Loya, Liu, Gong, Zhang, Zhang, Ajayan, Zhu and Lou47], Ψi is probably different from that of Ψj at i ≠ j. Although G for thousands (or more) of microstructures can be obtained regardless of the principle, there does not exist a universal mechanism or an effective way to incorporate all of them yet. Considering these issues above, we use probability to characterize fracture stability for an ensemble of specific microstructures, instead of an explicit quantitative function which is still nonexistent.
In this work, given multiple MD runs, we define the crack stability parameter, Ψ ≡ N/M, as the probability of crack instability at each (G, v t; C), where N and M are the numbers of unstable cracks and total cracks, respectively. The stability, metastability, or instability of a crack is defined as follows:
 $$\Psi = \Psi \left( {{\bi{G}},\;{v_{\rm{t}}};\;C} \right) = \left\{ {\matrix{ {0,} \hfill & {{\rm{stable}}} \hfill \cr {0 - 1,} \hfill & {{\rm{metastable}}} \hfill \cr {1,} \hfill & {{\rm{unstable}}} \hfill \cr} } \right.\quad .$$
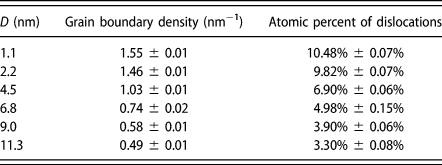
The resultant Ψ is a set due to the effects of G. For different samples, grain boundary characteristics are different at an identical D, but the corresponding grain boundary densities are approximately the same [Reference Brakke57] (also see Table I). In experiments using the CVD method to fabricate polycrystalline graphene, the only controllable parameter is the areal density of grains, which is also referred to as the average grain size D. Therefore, G of polycrystalline graphene sheets with an identical D is still a set:
 $${\left. {\bi{G}} \right|_D}\left\{ {{G_1},{G_2},{G_3}, \cdots ,{G_n}} \right\}\quad .$$
The grain boundary density and the atomic percent of dislocations at different D.

Since it is still unrealistic to formulate an explicit function for G in terms of G i, and D is a statistical representative of a microstructure, we choose D as the single material parameter to obtain Ψ statistically:
 $$\Psi = \Psi \left( {{v_{\rm{t}}},D} \right) = \left\{ {\matrix{ {0,} \hfill & {{\rm{stable}}} \hfill \cr {0 - 1,} \hfill & {{\rm{metastable}}} \hfill \cr {1,} \hfill & {{\rm{unstable}}} \hfill \cr} } \right.\quad .$$
Acknowledgments
This work was partially supported by the National Key R&D Program of China (Grant No. 2017YFB0702002), the Scientific Challenge Project of China (No. TZ2018001), and the National Natural Science Foundation of China (No. 11627901). The numerical calculations were performed at the Supercomputing Center of the Peac Institute of Multiscale Sciences.