Introduction
The Bonsmara composite breed was developed in South Africa between 1937 and 1963 with the aim of breeding a beef animal with improved growth, but still adapted to sub-tropical conditions (Bonsma, Reference Bonsma1980). Indigenous Afrikaner cattle, Hereford and Dairy Shorthorn were included in a structured crossbreeding programme, resulting in a composite consisting of 5/8 indigenous Afrikaner and 3/8 exotic Bos taurus after seven generations (Bonsma, Reference Bonsma1980). This breed has gained popularity beyond the borders of South Africa and genetic material has been exported to Namibia, Argentina, Australia and Brazil (Bignardi et al., Reference Bignardi, Santana, Eler and Ferraz2014). All registered Bonsmara cattle are subjected to mandatory performance recording. The relatively large data sets available on several production traits (i.e. fertility, growth and carcass traits) have made routine genetic evaluations possible within the breed and contributed to a number of quantitative studies based on their performance data (Maiwashe et al., Reference Maiwashe, Bradfield, Theron and Van Wyk2002; Steyn et al., Reference Steyn, van Marle-Köster and Theron2014).
A prerequisite for accurate genomic predictions is the incorporation of a large reference population of genotyped and phenotyped animals. It is important for marker effects in the population (Blasco and Toro, Reference Blasco and Toro2014), to be accurately accounted for in order to estimate the proportion of genetic variance (Pszczola et al., Reference Pszczola, Strabel, Mulder and Calus2012; Boddhireddy et al., Reference Boddhireddy, Kelly, Northcutt, Prayaga, Rumph and DeNise2014). The degree of genetic variance is influenced by effective population size (N e), with a larger N e resulting in lower prediction accuracy (Pszczola et al., Reference Pszczola, Strabel, Mulder and Calus2012; Boddhireddy et al., Reference Boddhireddy, Kelly, Northcutt, Prayaga, Rumph and DeNise2014). Sampling across a wide range of genotypes and phenotypes for the reference population may yield more accurate genomic predictions (Calus, Reference Calus2010). Studies have shown that including cows and bulls in the genomic reference population increases the predictive ability for traits such as female fertility (Clark et al., Reference Clark, Hickey, Daetwyler and van der Werf2012; Calus et al., Reference Calus, de Haas and Veerkamp2013). The aim of the present study was to assess the population structure and genetic background of the animals currently included in the Bonsmara reference population, towards the optimal expansion of the reference population for the application of genomic selection.
Material and methods
High impact Bonsmara sires with estimated breeding value (EBV) accuracies of ⩾65% for maternal weaning weight were identified. Hair samples were collected by the breeders from 388 bulls and 195 cows (n=583) that were older than 6 years and that had weaned at least 3 calves with recorded weights. The samples were genotyped with the GeneSeek® Genomic Profiler Bovine HD™ Chip (GGP-HD) 80 K chip by GeneSeek (Neogen, Lincoln, NE, USA). Ethical approval for the collection of hair samples and use of genotypic data were granted by the Bonsmara Cattle Breeders’ Society and the University of Pretoria (EC 150304-004 & 005).
Quality control of the genotypes was performed using PLINK (Purcell et al., Reference Purcell, Neale, Todd-Brown, Thomas, Ferreira, Bender, Maller, Sklar, de Bakker, Daly and Sham2007; Chang et al., Reference Chang, Chow, Tellier, Vattikuti, Purcell and Lee2015), pruning the data set to have a minor allele frequency (MAF) of >0.01 and excluding single-nucleotide polymorphisms (SNPs) and individuals with a call rate of <95% and <90%, respectively. The data set was further pruned with PLINK using a 50 SNP sliding window, with a five SNP increment between windows, retaining only SNPs with a pairwise r 2<0.2 (Novembre et al., Reference Novembre, Johnson, Bryc, Kutalik, Boyko, Auton, Indap, King, Bergmann, Nelson, Stephens and Bustamante2008). Genome-wide complex trait analysis of the autosomal SNPs was performed using principal component analysis (Yang et al., Reference Yang, Lee, Goddard and Visscher2011). The relationships and population structure of the Bonsmara genotypes were analysed using ADMIXTURE software (Alexander et al., Reference Alexander, Novembre and Lange2009).
Results and discussion
After the application of initial quality control measures, 56 248 of the 71 129 possible autosomal SNPs on the 80 K chip remained, resulting in an average call rate per animal of 99.7%. Despite the fact that the Bonsmara was not used in the development of the bovine SNP chip (Illumina Inc., 2016), the call rate achieved with the 80 K chip compared favourably with previously published studies (Cooper et al., Reference Cooper, Wiggans and VanRaden2013; McClure et al., Reference McClure, Sonstegard, Wiggans, Van Eenennaam, Weber, Penedo, Berry, Flynn, Garcia, Carmo, Regitano, Albuquerque, Silva, Machado, Coffey, Moore, Boscher, Genestout, Mazza, Taylor, Schnabel, Simpson, Marques, McEwan, Cromie, Coutinho, Kuehn, Keele, Piper, Cook, Williams and Van Tassell2013), which allowed further downstream applications. The average MAF of the SNPs was 0.274 before quality control and 0.280 after quality control. These values were slightly higher compared with the average MAF published during the validation of the chip (Illumina Inc., 2016), and higher than the 0.230 reported by Qwabe et al. (Reference Qwabe, Van Marle-Köster, Maiwashe and Muchadeyi2013) for the Bonsmara. No significant deviation between the observed (0.361) and expected (0.365) heterozygosity values were observed for the Bonsmara animals in the present study, similar to results documented by Makina et al. (Reference Makina, Muchadeyi, van Marle-Köster, MacNeil and Maiwashe2014).
After pruning the data set for SNPs in linkage disequilibrium (LD), 19 119 SNPs were retained in the data set, averaging 659 SNPs per autosomal chromosome. The mean SNP density in the Bonsmara after pruning was one SNP per ~90 kb, which is comparable to the study by Makina et al. (Reference Makina, Muchadeyi, van Marle-Köster, MacNeil and Maiwashe2014), who used a 50 K chip (21 290 SNPs after LD pruning) but only on 44 animals. Direct comparison between these results is difficult as there are only 26 295 SNPs in common between the two chips. However, this does suggest that the application of a higher density commercial chip did not increase the number of potentially informative SNPs remaining in this study.
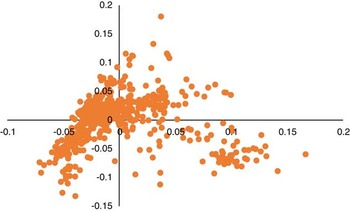
Principal component analysis revealed most of the Bonsmara animals were clustered together (Figure 1), and although some outliers were observed, these were not at such a distance from the main cluster to suggest the presence of a separate population or line. The outliers may be the result of differences in breeding goals and selection practiced by different breeders. These animals are not considered to pose an adverse effect on the reference population, as the aim of compiling the reference population is to strengthen the relationship between the reference population and the national Bonsmara population (Clark et al., Reference Clark, Hickey, Daetwyler and van der Werf2012; Calus et al., Reference Calus, de Haas and Veerkamp2013).
Scatter plot of the first versus second principal component from the principal component analysis of the Bonsmara reference population.

The number of possible populations (K) in the data set were modelled between K=2 and K=15, and a fivefold cross validation of the results was undertaken using ADMIXTURE (Alexander et al., Reference Alexander, Novembre and Lange2009), and plotted with Genesis (Buchmann, Reference Buchmann2014). Analysis of the cross validation errors indicated that eight populations (clusters) within the breed modeled the data the best. Despite the number of identified populations, the reference population was highly heterogenous (Figure 2), and 89.2% of the animals had some relationship to the dominant population (red).
ADMIXTURE analysis of the Bonsmara reference population ordered by the dominant colour for K=8.

Conclusion
The Bonsmara reference population is highly heterogeneous and this variability may have a detrimental effect on accurate genomic EBV (GEBV) estimation, as this may indicate similar variation throughout the national herd. The variability on a molecular level indicates that a larger reference population may be needed for accurate GEBV estimation. Further genotyping of ~990 Bonsmara cattle are pending, using the GeneSeek® GGP-HD 150 K chip. As more animals will be added to the reference population in the future, greater emphasis should be placed on sampling across the national herd to capture all the variation in the Bonsmara breed.
Acknowledgements
Appreciation is expressed to the SA Bonsmara Breeders’ Society and SA Stud Book for providing the genotypic data and pedigree records, the RMRDT (Genomic selection for SA beef industry 669197469) and NRF-THRIP (Project number: TP13073024535) for research support and funding.