Introduction
Crush injury can occur at traffic accidents, mining disasters and building collapses, and earthquakes. With the improvement of level of disaster relief, more and more patients can survive from these trauma’s direct attack. But the survivors will face a second peak of death: crush syndrome. Reference Sever and Vanholder1 According to the data display, two percent to five percent of earthquake victims suffer from crush syndrome; the number can even reach up to 10.5%, and the patients who needed kidney replacement therapy ranges from zero percent to 75%. If not given effective treatment, the situation fatality rate is as high as 42%, even up to 100%. Reference Bartels and VanRooyen2 Crush syndrome refers to ischemic necrosis of muscle tissue caused by prolonged compression of muscle-rich parts of the extremities. Rhabdomyolysis, which is characterized by myoglobinuria and hyperkalemia, will induce acute renal injury. Acute kidney injury (AKI) is the most common complication of rhabdomyolysis in crush syndrome, and it is an important factor that causes death and poor prognosis in patients. Reference Peiris3
Toll-like receptors (TLRs) are the members of the membrane protein family which can identify pathogen-associated molecules and mediate innate immune response; Reference Li, Kang and Lei4 TLR4 is an important member of the TLRs receptor family and belongs to I transmembrane receptor. Binding of stimulating factors to the TLR4 receptor is the first step in activating the innate immune system. After a series of phosphorylation cascades, the transcription factor nuclear factor kappa-B (NF-κB) is colonized in the nucleus and a series of inflammatory mediators are released, including tumor necrosis factor-α (TNF-α) and interleukin-6 (IL-6). Reference Teo, Macary and Tan5 The inhibition of TLR4/NF-κB mediated complicated response has been demonstrated as a protective effect in multiple organs against injury. Reference Sun, Shi, Wang, Yu and Wang6-Reference Rodrigues, Sanches and Volpini8 A potent TLR4 signaling inhibitor, TAK-242, selectively inhibits the TLR4-mediated production of cytokines and nitric oxide. Reference Shibata, Sugiura and Furuta9,Reference Krock, Millecamps and Currie10 At present, no research has reported the cascade of inflammatory mediators associated with TAK-242 in crush injury induced AKI in rats. This study initially investigated TLR4/NF-κB signaling pathways mediated crush injury induced AKI in rats and the effects of TAK-242 on changes in cytokines and inflammatory mediators in vivo by simulating crush injury models. It will provide a new theoretical basis for clinical targeted treatment of crush injury induced AKI.
Methods
Animals and Experimental Design
Eighty male wistar rats, weighing 300g (SD = 10g), were purchased from the experimental center of Tianjin University (Tianjin, China). All rats were kept and bred in constant temperature (24°C [75°F]) and humidity (65%) environment. The light time was from 7:00am to 7:00pm. The rats were free to eat and drink normally. The experiment was conducted in two parts: (1) Establish the crush injury model: 50 rats were randomly divided into five groups (n = 10/group), a control group and four crush injury groups. All the rats were anesthetized by intraperitoneal injection of one percent pentobarbital (40mg/kg) in the tail vein. After successful anesthesia, the double hind limbs of the rats in the crush injury groups were given 3kg pressure for eight hours by crush injury platform. The platform was the patented invention by Tianjin University Medical Center (Patent No. 201220049194.0). The platform could accurately set the pressure and time. It had a good fixation effect on the rats, so the rats needed not be repeatedly anesthetized during the process. The rats in the crush injury groups were sacrificed at the time points of 0h, 6h, 12h, and 24h after relieving pressure. During relieving the pressure, all the rats were free to eat and drink, and no deaths were found. And (2) Select the most severe crush injury group (12h group) in the first part for drug intervention experiments: 30 rats were randomly divided three groups (n = 10/group), the control group, the 12h group, and the 12h+TAK-242 group. The 12h+TAK-242 group rats were injected TAK-242 in the tail vein at a dose of 0.5mg/kg immediately after relieving pressure and sacrificed at the time points of 12h. Reference Gárate, García-Bueno and Muñoz Madrigal11 Collected were 5mL blood sample and the kidney tissues from each rat. Serum after centrifugation was stored at -20°C (-4°F) before testing. Before embedding to prepare paraffin sections, parts of the kidney tissue were fixed in 10% formalin, and the remaining tissue were stored at -80°C (-112°F) for further analysis. All procedures performed in studies involving animals were approved by the ethical committee of Tianjin Medical University General Hospital (Ethical NO. IRB2019-YX-008).
Kidney Tissues Observed Under Light Microscopes
Kidney tissues in each group were fixed with 10% formalin, dehydrated, waxed, and the block was sectioned at 5mm. The sections were stained in an aqueous solution of hematoxylin for five minutes, washed with tap water, differentiated with hydrochloric acid and ethanol for 30 seconds, soaked in warm water at 50°C (122°F) for five minutes, and blotted with water and stained in eosin for two minutes. The results were detected by light microscopy with x200 magnification.
Detect Serum Creatinine, Blood Urea Nitrogen (BUN), Myoglobin (Mb), and Blood Potassium
The blood of the rats was centrifuged at 3000rpm at 4°C (39°F) for 10 minutes, and the serum was collected. The level of creatinine, BUN, Mb, and blood potassium were examined by chemical detector according to the manufacturer’s instructions in the laboratory of Tianjin Medical University General Hospital.
Detect TLR4 and p65 by Immunohistochemistry Staining
The formalin-fixed kidney tissue was taken for dehydration, transparency, wax dipping, embedding, sectioning, dewaxing, and hydration. The endogenous peroxidase was blocked and inactivated with three percent H2O2. It was left at room temperature for 10 minutes and washed three times with phosphate-buffered saline for five minutes. Then, 50μl of the corresponding primary antibody was added dropwise at 4°C overnight. Added the EnVision reagent dropwise and let it stand at room temperature for 30 minutes. The results were detected by light microscopy with x200 magnification (nuclear purple blue, brown positive yellow). Image-Pro Plus 6.0 (Media Cybernetics, Inc.; Rockville, Maryland USA) analysis software was used to calculate the percentage of positive cells by cell counting for semi-quantitative analysis, and the average value of the percentage of positive cells in the five observation fields was taken as the final result.
Detect TLR4 Messenger Ribonucleic Acid (mRNA) by Quantitative Real-Time Polymerase Chain Reaction (RT-PCR)
According to the manufacturer’s instructions, the total RNA was extracted from the target kidney tissue. Then, 1μg of RNA was collected to generate first-strand complementary deoxyribonucleic acid (cDNA) with the PrimeScript RT Reagent Kit (Takara Bio Inc.; Shiga, Japan). β-actin was used as an internal reference to normalize interested genes. Detection of mRNA expression of TLR4 gene in rats by quantitative PCR. Primer sequence:
TLR4:forward,5′-TATCATCAGTGTATCGGTG-3′and
reverse,5′-CAGTCCTCATTCTGGCTCG-3′;
β-actin:forward,5′-AGGGAAATCGTGCGTGACAT-3′and
reverse,5′-CCTCGGGGCATCGGAA-3′.
Detect TLR4 Protein by Western Blot Analysis
The prepared kidney tissues were weighed and homogenized in ice-cold lysis buffer containing protease inhibitor. Homogenates were centrifuged at 12,000rpm for 30 minutes at 4°C, and the supernatants were immediately collected for use. The Bicinchoninic Acid (BCA) kit was used to concentrate the protein, separated the denatured proteins by 10% sodium dodecyl sulphate-polyacrylamide gel electrophoresis (SDS-PAGE), and transferred onto polyvinylidene difluoride (PVDF) membranes. The membranes were blocked for one hour at room temperature in tris-buffered saline (TBS) and then incubated overnight at 4°C in TBS-T containing specific primary antibodies. The membranes were incubated with horseradish peroxidase (HRP)-conjugated secondary antibody for one hour at room temperature after three washes in TBS-T. At last, the membranes were immediately placed in an exposure box, and the photosensitive membranes were exposed in a dark room, followed by development and fixing processes.
Detect IL-6 and TNF-α by Enzyme-Linked Immunosorbent Assay (ELISA)
The levels of IL-6 and TNF-α in rat serum were determined with the ELISA kits according to the manufacturer’s instructions.
Statistical Analysis
SPSS 20.0 (IBM Corp.; Armonk, New York USA) was used for statistical analysis. All data were presented as mean, standard deviation (SD). Two groups were analyzed using independent Student’s t-test, whereas various groups were compared with analysis of variance. All statistical analyses were performed using GraphPad Prism 5 (GraphPad Software, Inc.; San Diego, California USA). P <.05 was considered as statistically significant difference.
Results
Morphological Change in Kidney Tissues
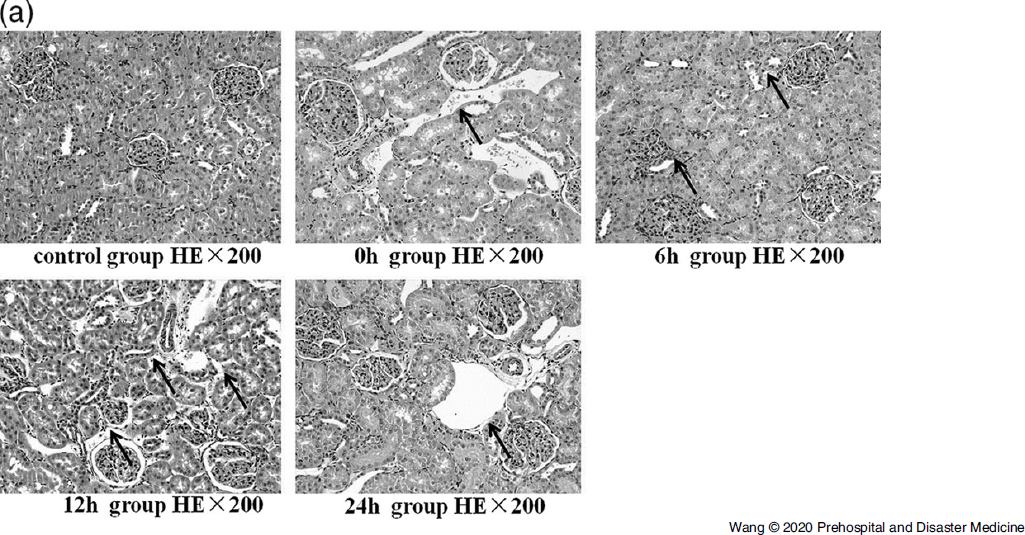
Haematoxylin and Eosin (HE) staining showed that there was no change in structure of renal tubules in control groups. In the crush injury groups, the 0h group had no significantly effect on kidney tissue. Compared with the control group, in the 6h, 12h, and 24h groups, renal tubular epithelial cells were turbid, necrotic, shed, and the necrotic changes were most obvious in the distally curved tubules and collecting ducts of the ascending part of the medullary ridge. Kidney tissues were significantly damaged in the 12h group (Figure 1A).
Histopathological Sections of Kidney Tissue with HE Staining×200: Control Group and Crush Injury Groups Relieving the Pressure for 0h, 6h, 12h, and 24h.

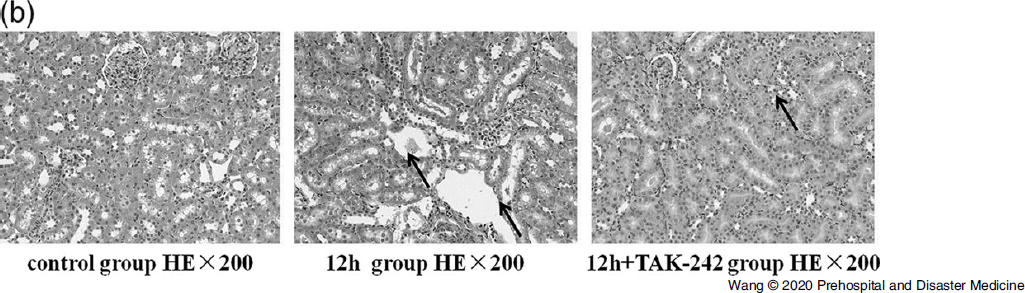
Compared with control group, kidney tissue damaged was increased in the 12h+TAK-242 group. Compared with the 12h group, kidney tissue damage was significantly reduced in the 12h+TAK-242 group (Figure 1B).
Histopathological Sections of Kidney Tissue with HE Staining HE×200: Control Group, Relieving the Pressure for 12h and 12h+TAK-242 Group.

Expression of the Pro-Inflammatory Cytokines
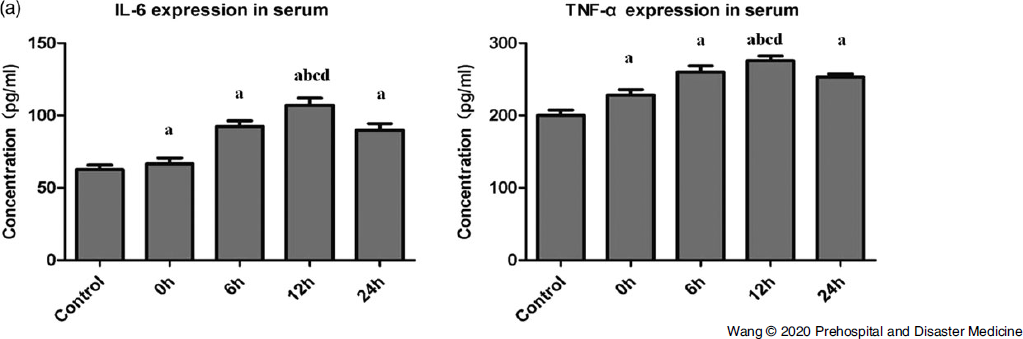
As shown, the expression of IL-6 and TNF-α were upregulated in crush injury groups compared with that of the control group. The expression of IL-6 and TNF-α in the 12h group was significantly higher than other groups (P <.05; Figure 2A).
The Expression Level of IL-6 and TNF-α in Control Group and Crush Injury Groups Relieving the Pressure for 0h, 6h, 12h, and 24h.
aP < .05 vs. control.
bP < .05 vs. 0h.
cP < .05 vs. 6h.
dP < .05 vs. 24h.

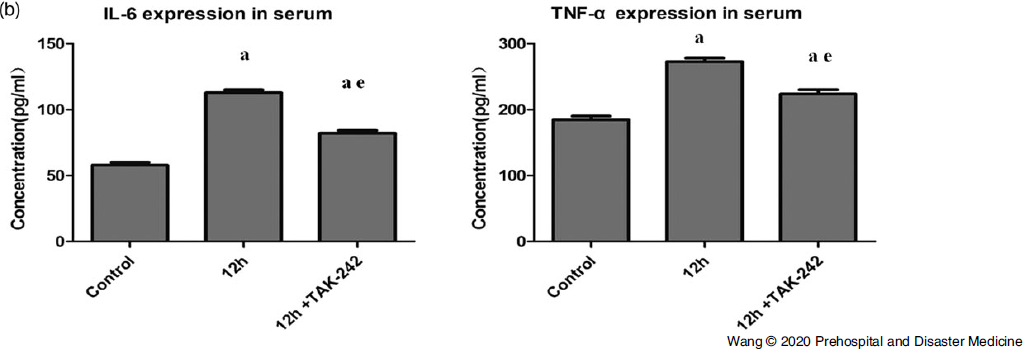
Compared with control group, the expression of IL-6 and TNF-α were increased in the 12h+TAK-242 group. Compared with the 12h group, they were significantly reduced in the 12h+TAK-242 group (P <.05; Figure 2B).
The Expression Level of IL-6 and TNF-α in Control Group, Relieving the Pressure for 12h and 12h+TAK-242 Group.
aP < .05 vs. control.
eP < .05 vs. 12h.

Level of Serum Creatinine, BUN, Mb, and Blood Potassium
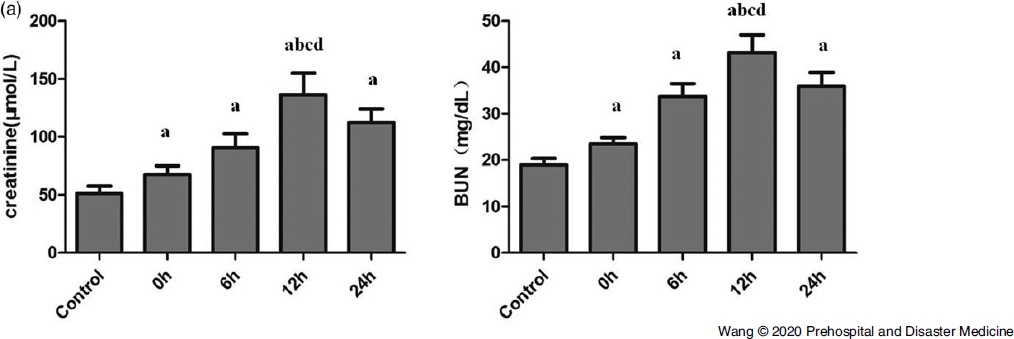
The level of serum creatinine and BUN were obviously increased in the crush injury groups than in the control group (P < .05). And the level in the 12h group was significantly higher than other groups (P < .05; Figure 3A).
The Level of Serum Creatinine and BUN in Control Group and Crush Injury Groups Relieving the Pressure for 0h, 6h, 12h, and 24h.
aP < .05 vs. control.
bP < .05 vs. 0h.
cP < .05 vs. 6h.
dP < .05 vs. 24h.

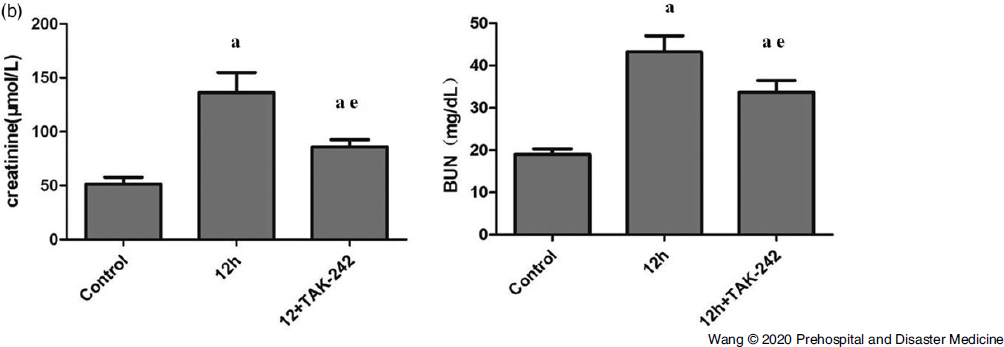
Compared with control group, the level of serum creatinine and BUN were increased in the 12h+TAK-242 group (P <.05). Compared with the 12h group, they were significantly reduced in the 12h+TAK-242 group (P <.05; Figure 3B).
The Level of Serum Creatinine and BUN in Control Group, Relieving the Pressure for 12h and 12h+TAK-242 Group.
aP < .05 vs. control.
eP < .05 vs. 12h.

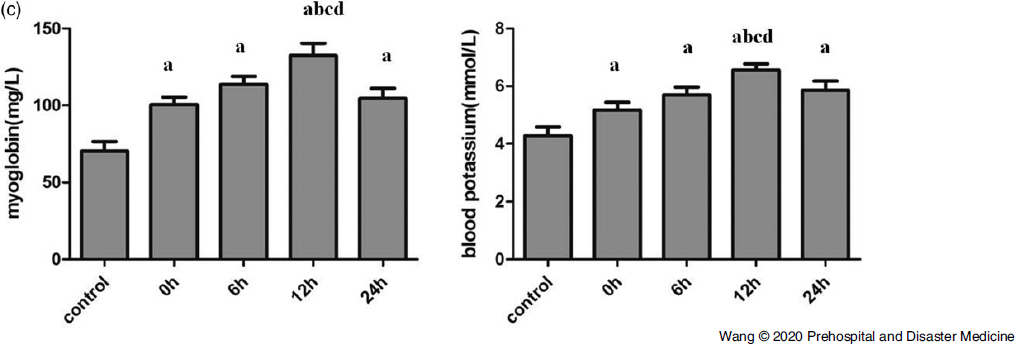
The level of serum Mb and blood potassium were obviously increased in crush injury groups than in the control group (P <.05). And the level in the 12h group was significantly higher than other groups (P<.05; Figure 3C).
The Level of Serum Myoglobin and Blood Potassium in Control Group and Crush Injury Groups Relieving the Pressure for 0h, 6h, 12h, and 24h.
aP < .05 vs. control.
bP < .05 vs. 0h.
cP < .05 vs. 6h.
dP < .05 vs. 24h.

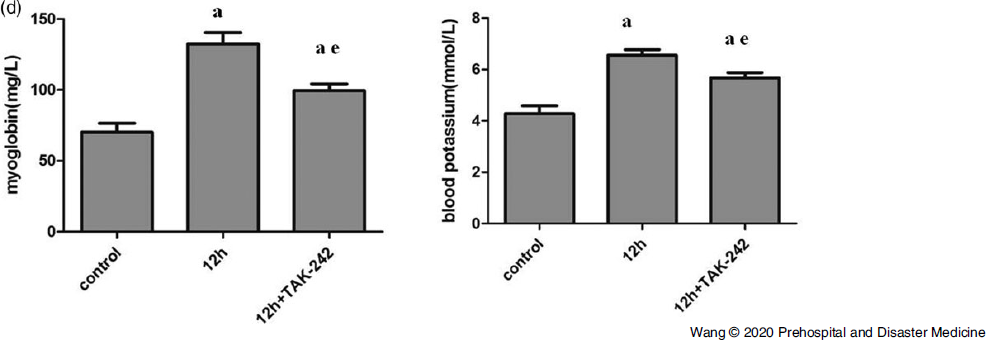
Compared with control group, the level of serum Mb and blood potassium were increased in the 12h+TAK-242 group. Compared with the 12h group, they were significantly reduced in the 12h+TAK-242 group (P <.05; Figure 3D).
The Level of Serum Myoglobin and Blood Potassium in Control Group, Relieving the Pressure for 12h and 12h+TAK-242 Group.
aP < .05 vs. control.
eP < .05 vs. 12h.

Expression of TLR4mRNA in Kidney Tissues
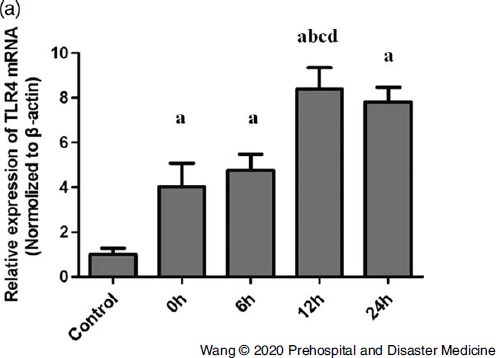
The TLR4 was analyzed by quantitative RT-PCR. The TLR4mRNA level was normalized to β-actin. The TLR4mRNA expression level in crush injury groups was higher than in the control group (P <.05). And the level in the 12h group was significantly higher than other groups (Figure 4A).
The Expressions of TLR4 mRNA in Control Group and Crush Injury Groups Relieving the Pressure for 0h, 6h, 12h, and 24h.
Note: The mRNA levels were normalized to β-actin.
aP < .05 vs. control.
bP < .05 vs. 0h.
cP < .05 vs. 6h.
dP < .05 vs. 24h.

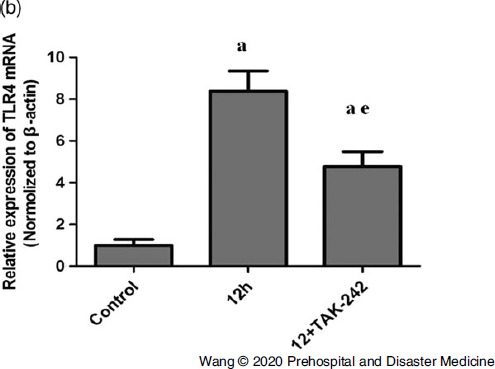
The expression level of TLR4mRNA in the 12h+TAK-242 group was significantly lower than that in the 12h group and higher than that in control group (P <.05; Figure 4B).
The Expressions of TLR4 mRNA in Control Group, Relieving the Pressure for 12h and 12h+TAK-242 Group.
Note: The mRNA levels were normalized to β-actin.
aP < .05 vs. control.
eP < .05 vs. 12h.

Protein Expression of TLR4 in Kidney Tissue
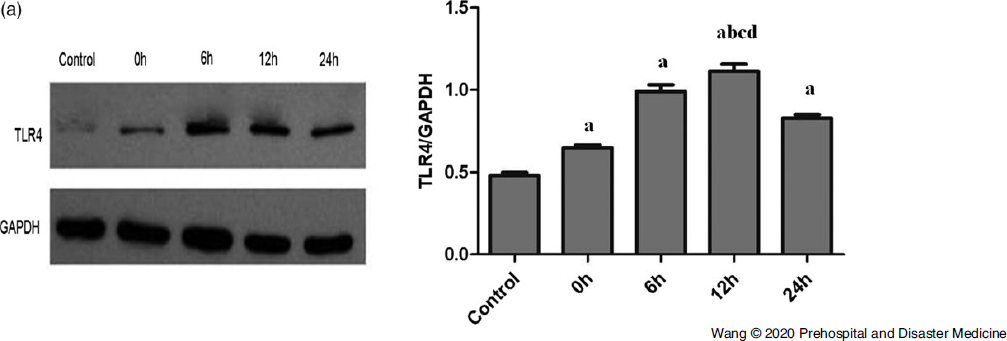
The protein expression of TLR4 was analyzed by WB and GAPDH was used as a control. The TLR4 protein expression level was higher in crush injury groups than in the control group (P <.05). The expression of TLR4 protein in the 12h group level was significantly higher than other groups (P <.05; Figure 5A).
The Protein Expression of TLR4 was Analyzed by Western Blotting in Control Group and Crush Injury Groups Relieving the Pressure for 0h, 6h, 12h, and 24h.
Note: GAPDH was used as a control.
aP < .05 vs. control.
bP < .05 vs. 0h.
cP < .05 vs. 6h.
dP < .05 vs. 24h.

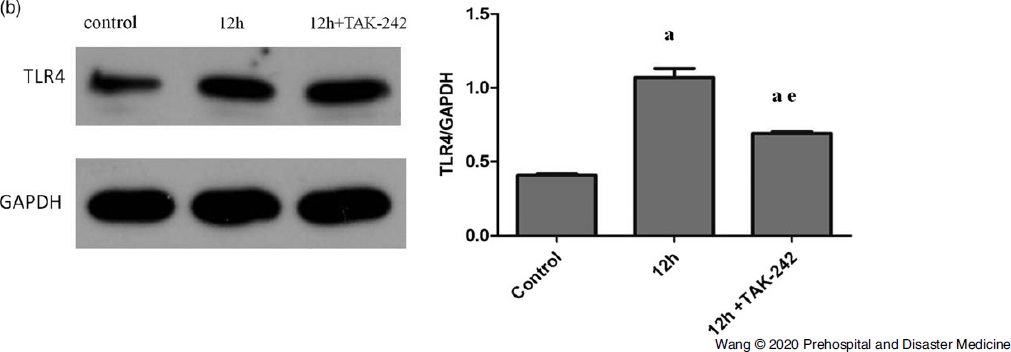
The expression level of TLR4 protein in the 12h+TAK-242 group was significantly lower than that in the 12h group and higher than that in control group (P <.05; Figure 5B).
The Protein Expression of TLR4 was Analyzed by Western Blotting in Control Group, Relieving the Pressure for 12h and 12h+TAK-242 Group.
Note: GAPDH was used as a control.
aP < .05 vs. control.
eP < .05 vs. 12h.

Results of Immunohistochemical Staining
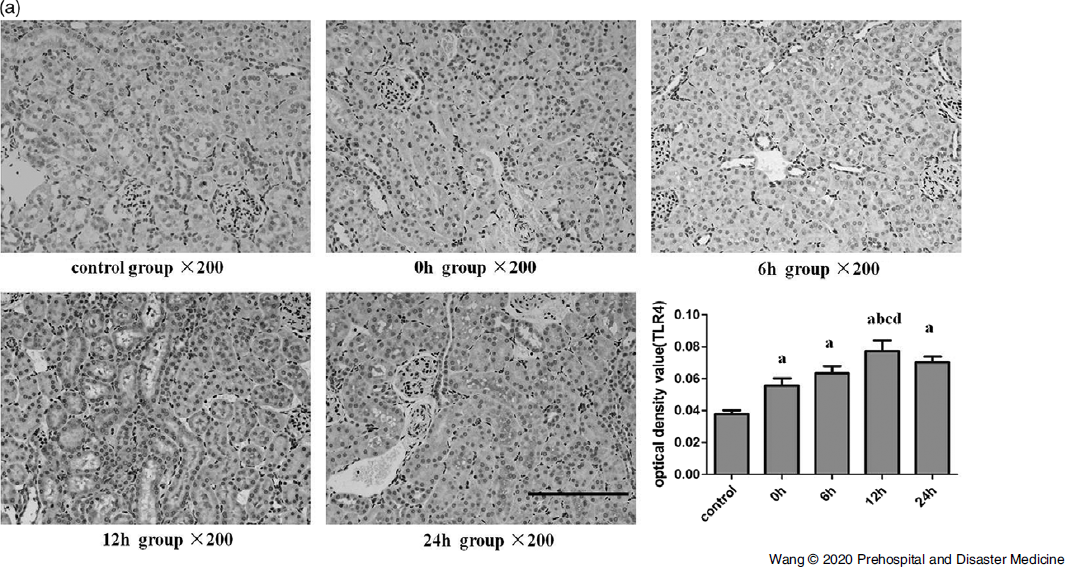
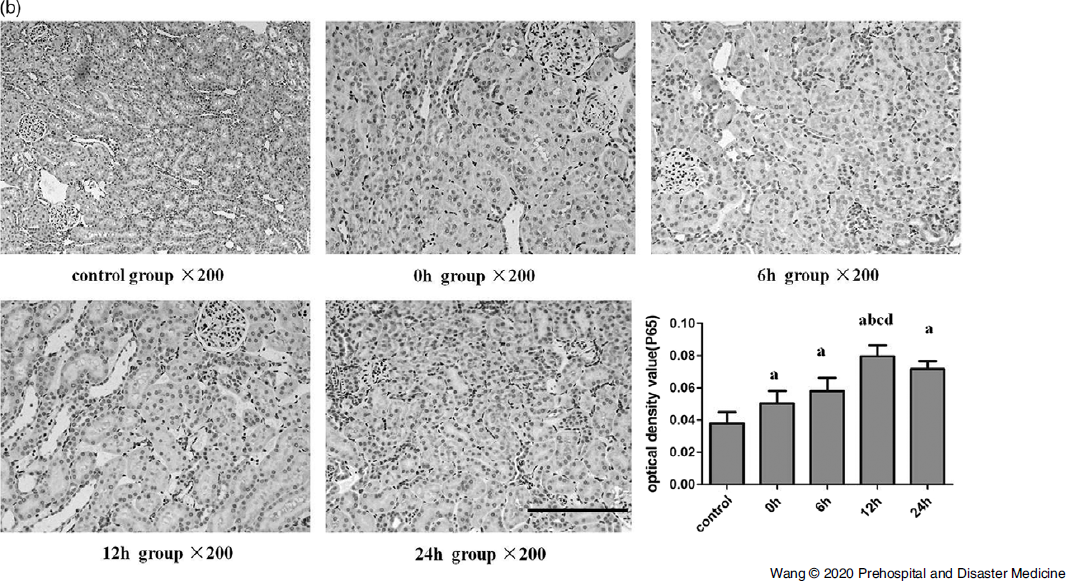
The expression level of TLR4 and p65 in crush injury groups was higher than in the control group (P <.05). The expression of TLR4 (Figure 6A) and p65 (Figure 6B) in the 12h group level was significantly higher than other groups (P <.05).
Immunohistochemical Staining of TLR4 of Kidney in Control Group and Crush Injury Groups Relieving the Pressure for 0h, 6h, 12h, and 24h×200.
aP < .05 vs. control.
bP < .05 vs. 0h.
cP < .05 vs. 6h.
dP < .05 vs. 24h.

Immunohistochemical Staining of P65 of Kidney in Control Group and Crush Injury Groups Relieving the Pressure for 0h, 6h, 12h, and 24h×200.
aP < .05 vs. control.
bP < .05 vs. 0h.
cP < .05 vs. 6h.
dP < .05 vs. 24h.

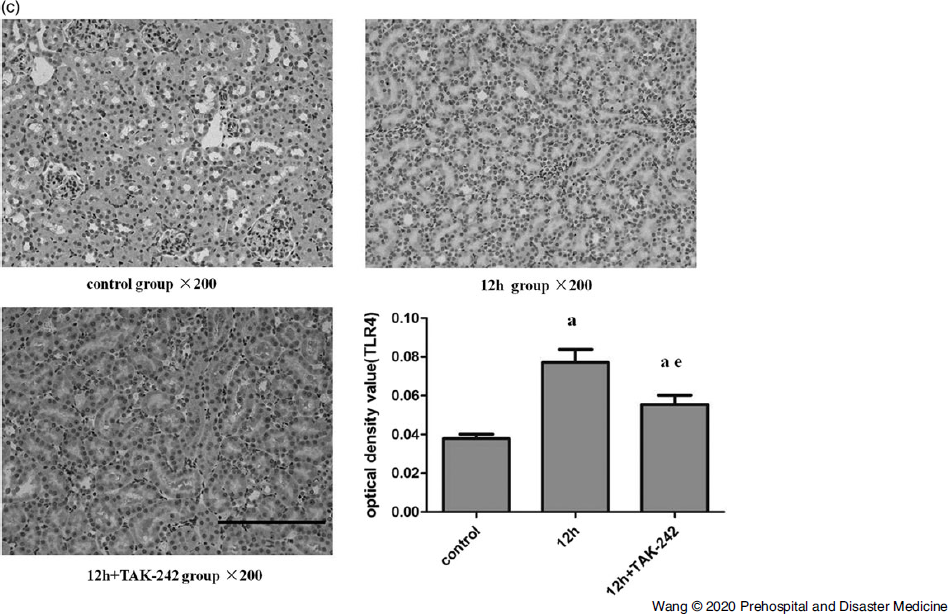
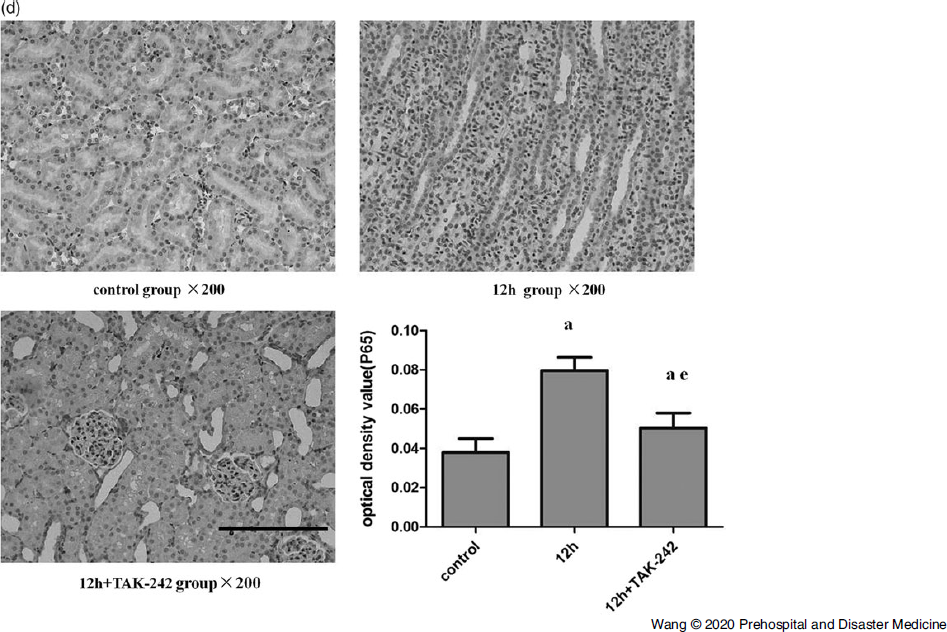
The expression level of TLR4 (Figure 6C) and p65 (Figure 6D) in the 12h+TAK-242 group was significantly lower than that in the 12h group and higher than that in the control group (P <.05).
Immunohistochemical Staining of TLR4 of Kidney in Control Group, Relieving the Pressure for 12h and 12h+TAK-242 Group×200.
aP < .05 vs. control.
eP < .05 vs. 12h.

Immunohistochemical Staining of P65 of Kidney in Control Group, Relieving the Pressure for 12h and 12h+TAK-242 Group×200.
aP < .05 vs. control.
eP < .05 vs. 12h.

Discussion
Crush injury refers to muscle rich area of the limbs and trunk which suffered heavy object for a long time, and the muscle is caused by mechanical or ischemic injury after decompression. Such as myoglobinuria, high potassium, acidosis, and AKI, what is called crush syndrome. Reference Scapellato, Maria and Castorina12 Crush syndrome of the main pathophysiological changes including muscle tissue directly damaged and ischemia-reperfusion injury. Reference Gonzalez13 When the Mb enters blood circulation, being glomerular filtration, formed in the Malpighian tube, obstructed the renal tubule, lead to the proximal renal tubular epithelial cell damage, and AKI. Reference Oda, Tanaka and Yoshioka14
The TLR4 is one of the most important members of TLRs, which currently known and belongs to the family of pattern recognition receptors. Reference Chen, Alvero and Silasi15 Its extracellular domain is rich in leucine-repeated sequences that can recognize pathogen-associated molecular patterns. The intracellular region consists of Toll homology domains and short-tail peptides (1-22 amino acids) with different lengths of the carboxyl end of the molecule. Reference Chen, Huang and Gong16 The NF-κB is a transcription factor belonging to the Rel family. It is a nuclear protein factor with multidirectional transcription regulation. It is widely present in a variety of cells. After activation, it participates in the transcriptional regulation of many genes. Reference Ostuni, Zanoni and Granucci17 The NF-κB family consists of five proteins, including c-Rel, RelB, RelA/p65, NF-κB (p50 and p105), and NF-κB2. Reference Yang, Amiri and Burke18 A large number of experiments have proved that many factors can cause the activation of the NF-κB signal transduction pathway, which is currently recognized mainly including the classical pathway and the bypass pathway. Reference Bonizzi and Karin19-Reference Kucharczak, Simmons and Fan21 In this experiment, the expression change of P65 was selected to reflect the change of NF-κB.
When the external stimulus signal is recognized by TLR4, it can induce the recruitment of myeloid differentiation factor (MyD88), and then activate IL-6 receptor-related kinase (IRAK), TGF-β activation kinase (TAK1) in succession, and then stimulate IkB kinase. This reaction activates the nuclear transcription factor NF-κB, thereby initiating the expression of cytokines such as IL-6, TNF-α, and other genes related to inflammatory immunity. Reference Nicotra, Loram and Watkins22-Reference Li, Cai and Ou24
Eventually, this produces a large number of inflammatory cytokines such as IL-6 and TNF-α. Reference Wang, Zhang and Feng25,Reference Lee26 These results suggested that the TLR4/NF-κB signaling pathway was involved in the process of crush injury induced AKI and promoted the release of inflammatory factors. When added TLR4 inhibitor in the crush groups, kidney function related indicators, such as creatinine, BUN, Mb, and potassium, were significantly improved, and the release of proinflammatory factors were significantly reduced. The TAK242 may block signaling of TLR4 receptors by specifically blocking intracellular TLR receptors, then weakening the AKI-induced inflammatory response process. So TAK-242 may have a certain positive effect on the treatment of crush injury induced AKI.
Limitations
There were several limitations in this study. First, because of the limitations of sample size of the animal model, the data and results obtained might not fully reflect the actual level. Second, the modeling method was used to simply compress both hind limbs of rats, which may be different from the complex condition caused by the actual disaster, such as hypoxia, bleeding, and infection. Third, there might be other molecular mechanisms involved in the complex injury process, which might interfere with real experimental results. The c-Jun N-terminal kinase (JNK) signaling pathway had also been confirmed to be involved in the process of AKI associated with crush syndrome. Whether TAK-242 inhibited TLR4 expression would affect the JNK signaling pathway remains to be discussed.
Conclusion
The TLR4/NF-κB signaling pathways mediated crush injury induced AKI in rats, and TAK-242 attenuates the injury through inhibiting the signaling pathways.
Conflicts of interest
none