


INTRODUCTION
The presence of politically autonomous cities was a distinctive feature of European political development in the medieval and early modern eras. It was a feature that many see as having been critical to Europe's economic rise, because it allowed for the provision of secure property rights free from the ambitions of princely rulers.Footnote 1 Ultimately, this emphasis on urban autonomy can be traced back to Max Weber (1921 [Reference Weber1958]). Scholars have further argued, following Weber, that the absence of autonomous cities in the Islamic world and China hindered development.Footnote 2 Most recently, Paul Romer has even suggested that Europe's experience with autonomous cities can and should be imitated in developing countries today.Footnote 3 But if there are reasons to believe that city autonomy favored European economic development, there is also an opposite claim. According to this view, the merchant guilds (and in some cases craft guilds) that controlled the governing institutions of autonomous cities established firm property rights for themselves, but they also created barriers to entry into professions, something that stifled innovation and trade.Footnote 4 In this article I provide evidence and an interpretation that reconcile these differing views. I first suggest why political autonomy for a city may initially have been favorable to growth while eventually leading to economic stagnation. I then show econometrically that after roughly a century of autonomy, a city would be expected to grow more slowly than one subject to princely domination. This conclusion has implications for broad debates about property rights institutions and economic development, and all the more so because the literature has so often referred to European history to draw insights on this question.
The motivation for my idea about the changing value of urban autonomy comes from observations by Joel Mokyr (Reference Mokyr1995, Reference Mokyr1994, Reference Mokyr1990) and Daron Acemoglu (Reference Acemoglu2008). Mokyr suggests that politically autonomous cities may have been favorable environments for growth not only because of security of property rights for those engaged in trade, but also because they were favorable environments for innovation. However, over time innovation inevitably moved from one location to the next, a phenomenon that he refers to as Cardwell's Law. Complementary to this, Acemoglu (Reference Acemoglu2008) presents a theoretical model, a core result of which is that an oligarchic regime, which bears a strong resemblance to the actual regime of so many European city states, may initially enjoy a high rate of growth due to strong property rights protection. However, as long as property rights protection also implies barriers to entry, then if comparative advantage in entrepreneurship changes over time, an economy with a regime such as this may eventually stagnate.
My empirical findings may have implications for the time path for growth in other instances where a political regime results in the provision of property rights protection for a specific group, accompanied by substantial barriers to entry.Footnote 5 There is little doubt that Europe's autonomous cities had such characteristics, as will be discussed below. Their very origin lay in a movement to establish certain rights for citizens of a town to the exclusion of those in the surrounding countryside. Moreover, they also had formal political institutions the rules of which privileged the maintenance of guild control. In their initial phase of development it was most common for members of a city's merchants guild, those engaged in trade and in particular long distance trade, to benefit from these rules to establish firm control of the representative institutions of an autonomous city. Beginning in the fourteenth century, a number of Europe's autonomous cities experienced political turmoil in which members of craft guilds demanded representation on city councils.Footnote 6 This sometimes altered governance of autonomous cities, though as I will argue below, not in a way that fundamentally changed the core characteristic that autonomous cities had substantial barriers to entry. It is of course the case that guilds were a common feature in both autonomous and nonautonomous cities at this time. However, the crucial distinction of an autonomous city was that guilds were much more likely to hold political power.Footnote 7
My findings also have implications for a second question; why did the autonomous city eventually die out as a form of state organization in Europe? The conventional explanation is that autonomous cities were economic powerhouses, but they died out because they could not compete militarily against larger states. It is suggested that this was particularly the case after technological change led to high fixed costs in war fighting.Footnote 8 A problem with this argument is that autonomous cities long held a financial advantage over larger territorial states when it came to fighting wars. The autonomous cities found it easier to gain access to credit and at lower rates of interest, a feature that undoubtedly helped aid in their survival.Footnote 9 My findings in this article point to a more simple reason why autonomous cities may have died out; the political institutions that initially fostered growth ultimately led to economic stagnation.
In order to examine the effect of political autonomy on city population growth between AD 1000 and 1800, I consider a sample of all cities in Western Europe that are recorded in the Bairoch, Batou, and Chevre (Reference Bairoch, Batou and Chevre1988) data set and which by the year 1500 reached a size of at least 10,000 inhabitants.Footnote 10 This results in a total of 173 cities. As is common in work on the early European economy, population growth is used as a (admittedly imperfect) proxy for economic growth. The choice to focus on this sample was dictated in part by the fact that it allowed for compiling more detailed information on city autonomy. Within this sample, it is also more likely that we are comparing autonomous cities with cities that were sufficiently large to have become politically autonomous but which did not succeed in doing so.
Taking the sample of 173 cities, I used a number of different sources to construct an indicator variable denoting whether a city was politically autonomous, with autonomous defined as there being clear evidence of institutions for self-governance and evidence of the exercise of prerogatives with regard to taxation, judicial affairs, and defence. I also record the date at which a city is judged to have become politically autonomous, in addition to the date at which it lost its autonomy.
To consider the potential effect of city autonomy I report results of estimates using pooled Ordinary Least Squares (OLS) regression with time period dummies as well as fixed effects estimates that consider only within variation for each city, supplemented by time period dummies. Importantly, I also report results that include controls for latitude, longitude, and the product of latitude and longitude, with all three coordinate variables interacted with the period dummies. A similar exercise is performed using regional dummies interacted with time dummies. These are demanding tests that help control for region and time specific shocks, such as the opening up of Atlantic trade, a feature that may have disadvantaged autonomous cities closer to the Mediterranean. The estimation results are quite clear. Based on the specifications that do not allow the effect of city autonomy to vary over time, there is no evidence that autonomous cities on average grew more quickly than did nonautonomous cities, and the average effect may actually have been negative. However, once we distinguish between cities that have been autonomous for less than 100 years and cities that have been autonomous for longer, we observe that we would expect a more newly autonomous city to have its population grow by substantially more than would be the case for a nonautonomous city. In strong contrast, autonomous cities that have been autonomous for more than 100 years are estimated to either grow at a rate no different from nonautonomous cities or in some cases to grow more slowly. Finally, based on a more flexible specification that includes a constant effect of independence, a linear trend for the number of years that a city had been autonomous, and a quadratic term for the same, we observe another consistent result. Taking the fixed effects specification, after 108 years of independence, an autonomous city would begin to grow more slowly than would a nonautonomous city. I use these quadratic trend estimates as my preferred specifications in the article because they do not depend on an arbitrary cutoff date.
We can be confident that my estimation results are robust to controls for unobserved time period effects as well as unobserved and constant effects at the city level, and finally to unobserved factors producing region and time specific shocks to population growth rates. But there are certainly further reasons why the estimation results may not reflect a causal effect of political autonomy on growth. The first and most obvious problem could be that the results simply reflect the fact that a city grew quickly prior to becoming independent, that this was necessary for it to be able to become independent, and that growth during the initial period of independence simply reflected this underlying trend. In order to assess this possibility I also report results of a placebo test. Instead of setting the city autonomy variable in my regressions equal to 1 in the year that a city first became independent, I recoded the variable to take a value of 1 beginning 100 years prior to the establishment of political autonomy. I did the same with a variable measuring the number of years that a city had been autonomous.Footnote 11 Using this placebo test, I repeated my quadratic trend specifications with these recoded variables. To the extent that my core results are biased by the presence of an underlying growth trend, we should expect this change to result in either an increased estimated effect of political autonomy, or at a minimum there would be no attenuation of the estimated effect. However, substitution of the placebos for the actual political autonomy variables resulted in coefficients that were smaller in magnitude and that were generally not statistically significant.
In the text of the article I also discuss several further robustness tests. I first allow the effect of political autonomy to vary by region, finding relatively little indication that this is the case, though I do find some evidence that the effect of city autonomy may have been larger in smaller political units. I perform a similar exercise to see whether the effect of autonomy varied by time period, ending up with a similar conclusion. I also consider whether my results might be produced by errors in coding political autonomy. Excluding those cities for which there are fewer sources or for which sources do not agree does not alter the pattern of results. I consider the possibility of biases introduced by spatial correlation of errors. Finally I also discuss whether my results might be produced by further time varying unobservables.
In the end it should be emphasized that while I have provided a robust result regarding the time path for growth of autonomous cities, I have not demonstrated unequivocally that this pattern for growth was attributable to the way in which the fusion of political and guild power led to higher barriers to entry than otherwise would have existed. Ultimately, this remains a matter for interpretation, though it is an interpretation that can be supported by significant historical evidence as I discuss in detail below. To confirm my interpretation further work would need to show that barriers to entry were actually higher in autonomous cities. Finally, it should also be remembered that any alternative interpretation of my results would have to suggest not only why autonomous cities were different from nonautonomous cities, but also why they experienced shifting fortunes with regard to growth.
The remainder of the article is organized as follows. The next section considers the debate on autonomous cities, territorial princes, and growth in greater detail. This is followed by a description of the data that I have compiled on city autonomy and its relevant characteristics involving when cities became independent, how long they tended to maintain this independence, and when they lost their independence. In the subsequent section I then present the empirical strategy that I will use to estimate the effect of political autonomy on population growth over time, followed by the core estimation results. The following section considers the robustness of results, followed by the conclusion to the article.
CITY AUTONOMY, TERRITORIAL PRINCES, AND GROWTH
In this section I will lay out the basis for my conjecture that upon achieving political autonomy a city should initially experience a period of fast growth relative to a nonautonomous city, followed by a period of stagnation. To do this I will first consider autonomous cities exclusively and suggest why their political institutions may at first have favored growth and subsequently hindered it. I will then compare autonomous cities with nonautonomous cities. In doing so I will argue that territorial princes faced incentives to limit barriers to entry that cities under their control might seek to establish, and I will provide some historical evidence suggesting that this was in fact the case.
Growth in Autonomous Cities
A common interpretation of how autonomous cities emerged in Europe is that they began as acts of usurpation of authority by groups located in a specific place engaging in a specific type of activity who sought to manage their own affairs rather than having them be managed by a feudal ruler. Max Weber referred to this more specifically as a regime of “non-legitimate domination.”Footnote 12 If many merchant dominated cities were initially based on informal, oath-based associations, over time the need to establish property rights amongst a larger number of individuals led to the creation of more formal institutions of rule, and in the early stages of their development, that is, up until the fourteenth century, these formal rules very often ensured that a city's merchants guild held all the reins of political power. Cities most generally had a large city council with broad membership and then a smaller governing council composed of a group of magistrates. In a number of cities it was specifically stipulated that only members of a city's merchants guild or like individuals could hold one of these positions. As an example, in Siena under the rule of The Nine, a statute in 1287 stipulated that members of The Nine must be of the merchants of the city or similar individuals.Footnote 13 Merchant guild control was further favored by the fact that a large number of cities, particularly in Northern Europe, chose their magistrates by a system of cooptation. Rather than having magistrates be elected by the citizenry, in a system of cooptation an outgoing body of magistrates would choose an incoming group.Footnote 14 The data reported in Stasavage (Reference Stasavage2011, 58) for a small sample of autonomous cities show that prior to 1300, merchants held an average of 72 percent of the seats on governing councils. The key characteristic of an autonomous city was not simply that autonomous cities had merchants guilds, it was that the guilds also had a very direct degree of political control. The fact that guilds ultimately depended on political support for their policies has been heavily emphasized by Epstein (Reference Epstein2000; Reference Epstein, Epstein and Prak2008).
The pattern of governance in many autonomous cities changed during the fourteenth century, although not in a way that fundamentally altered the core characteristics relevant for this article. Autonomous cities continued to provide property rights for citizens with barriers to entry to outsiders. Autonomies cities continued to be governed by guilds that provided property rights for insiders to the exclusion of others. The change was that in a number of cities merchants guilds were now forced to share power with members of the craft guilds. During the course of the fourteenth century, and in some cases into the fifteenth, a large number of Europe's autonomous cities experienced popular revolts in which members of craft guilds engaged in light industrial production challenged the dominance of merchant guilds. Some of the best known of these include the revolt that took place in Ghent in 1302 and the Revolt of the Ciompi in 1378 in Florence. In some cases, such as in Ghent, these revolts led to durable changes in institutions for governance. In other cases, as in Florence, a prior pattern of rule was quickly re-established. Durable changes in institutions sometimes involved a shift to electing magistrates rather than selecting them via cooptation. They also included opening up seats on governing councils to include guild representation. In these cases governing councils would have a certain number of seats set aside for the merchants guild and the craft guilds. With the exception of those revolts, such as that of the ciompi, when even the lowest orders of society demanded and briefly received representation, expansion of city councils simply extended political power to guild organizations that, like the merchants guilds, provided property rights for insiders but barriers to entry to those on the outside. Finally, in the aggregate the extent to which the political systems of city states were truly reformed is open to question. According to the data reported in Stasavage (Reference Stasavage2011, 58) by the beginning of the sixteenth century merchants still held nearly 60 percent of the seats on governing councils.
There is good reason to believe that the form of autonomous city rule referred to above could bring economic benefits, at least in the short run. Governance of a city council by merchants and consequent insulation from the whim of an outside monarch may have made for a more stable legal environment in which to conduct business (Mokyr Reference Mokyr1995; Reference Mokyr1990). In addition, governance by a group of individuals meeting regularly face to face may have facilitated the sort of commitment mechanisms described by Avner Greif (Reference Greif2006). Finally, recent historical work has emphasized that guilds were not simply rent-seeking bodies. They played a very prominent role in property rights provision, in particular the protection of knowledge, and in the facilitation of training.Footnote 15 These political conditions may have initially provided an environment both for increased trade and increased innovation. Therefore, in the period after establishing its autonomy we might expect an autonomous city to grow more quickly than before.
However, precisely because the establishment of an autonomous city involved the usurpation of authority, it also involved the creation of barriers to entry as the merchant, and later, craft guilds that dominated a city's political institutions strictly regulated commerce and the right to enter certain professions. Henri Pirenne described this particular view of the economic effects of guild control in the following terms:
The corporate spirit, henceforth freed from restrictions, showed itself in all its fullness, and worked itself to its logical conclusions. The lesser burghers, being now in a position to conduct their own administration in their own way, became uncompromising adherents of that policy of protection which was the guarantee of their survival. We see them continually drawing closer the network of industrial regulation, surrounding the preserves of each calling with higher and stronger barricades, and watching more carefully to prevent any competition from the local market (Pirenne Reference Pirenne1915, 163).
This negative view of the combined effect of guild control with political control has of course been emphasized by numerous other authors already cited in the introduction to this article.Footnote 16
The above discussion points to advantages and shortcomings of the political regimes of autonomous cities. Rather than attempt to adjudicate whether it was the advantages or shortcomings that dominated in a static sense, a more novel way to think about things is to consider how these effects might vary over time. In fact, there are reasons to believe that in an initial phase of development, the advantages might dominate but then in later stages the shortcomings would play a more preponderant role.
One reason we might expect an autonomous city to first prosper and then stagnate is if we refer to the work of Mancur Olson (Reference Olson1982) and suggest that over time economic stagnation would have been produced by a progressive accretion of rent seeking vested interests. But it appears that in most cases, vested interests and barriers to entry were an important feature of Europe's autonomous cities right from the start. This is inconsistent with an Olsonian account in which such vested interests and barriers to entry emerge gradually over time.
A more convincing reason why we might expect autonomous cities to initially prosper and subsequently stagnate can be derived from the work of Daron Acemoglu (Reference Acemoglu2008). Acemoglu suggests that oligarchies in which members of the oligarchy are themselves entrepreneurs may initially have high rates of growth because of better protection of property rights and a lower risk of expropriation. However, if it is necessary to have “churning” in the identity of entrepreneurs to maintain a rate of economic growth, then oligarchies will eventually stagnate. He suggests that this could be the case if the entrepreneurial skill of an individual, or of a family dynasty, changes over time, necessitating new entrants. It could also be if the entrepreneurial skill of an individual or dynasty is constant over time but comparative advantage in entrepreneurship changes over time as the type of economic activities in an economy evolves. This phenomenon could also be related to the well-known “replacement effect” proposed by Arrow (Reference Arrow1962) whereby a potential entrant to a market has a greater incentive to innovate because their alternative to innovation is zero profit whereas an existing firm could continue to enjoy a monopoly stream of profits.Footnote 17 Any of the above possibilities could clearly apply to the economies of medieval and early modern cities.
Autonomous and Nonautonomous Cities Compared
So far I have said little about cities under the direct control of territorial princes, as opposed to those that were politically autonomous. It is important to emphasize again that autonomous cities were not alone in having guilds. The key difference I have argued was that in autonomous cities guilds had political control whereas guilds in cities under princely domination were subject to an outside force. This then raises the question of what incentives territorial princes faced with regard to their cities.
To consider the above question in an abstract fashion, take the case of a territorial prince who is not directly engaged in economic production and who has a desire to extract revenue from a city. Under princely domination, the prince will set a tax rate that maximizes revenue subject to the constraint that a city's merchant and/or craft guilds might produce less or trade less. Under urban autonomy, as long as the guilds that control the city's government derive less benefit from princely revenues than does the prince, then they will set a lower tax rate and economic production will therefore be higher under autonomous rule. If this was all that mattered we would therefore expect growth to be higher in the case of urban autonomy. However, once we introduce the possibility of barriers to entry into the city's markets, then we see that this might not necessarily be the case. If a city is autonomous then a guild or guilds that control its government will have an incentive to establish barriers to entry because the monopoly power that they provide leads to increased profits with the accompanying outcome of lower total production, the classic result for monopoly. Since lower total production implies lower taxable revenue, under princely domination a prince should face incentives to oppose the imposition of barriers to entry into a city's markets. If this was all that mattered, it would imply higher production and higher growth under princely domination.
We can quickly see from the above discussion that without further knowledge about the values of the parameters determining how high a city's guilds would set barriers to entry and how high a prince would set taxation, we can make no clear prediction about whether economic production will be higher in an autonomous city as opposed to one subject to princely control. However, we can nonetheless use the above theoretical sketch to make a prediction about the time path for growth in an autonomous city relative to a nonautonomous one. If the effect of barriers to entry becomes more pernicious over time, precisely because they stifle innovation, then we should expect any growth advantage of autonomous cities to decline over time.
To what extent does the above discussion bear any resemblance to the actual behavior of European territorial princes? That princes imposed taxes on cities is hardly in doubt. But what about the idea that princes might actually insist that cities maintain lower barriers to entry into markets? This is an idea that has been emphasized by Epstein (Reference Epstein2000, 101–105, 125) and which has also received qualified support from Blockmans (Reference Blockmans2010, 585–586).
In his book Freedom and Growth, Stephan Epstein (Reference Epstein2000) made use of a comparison between the evolution of the textile industry in Lombardy and Tuscany during the fourteenth century. While both of these regions during the twelfth and thirteenth centuries consisted of numerous autonomous cities, during the first decades of the fourteenth century Lombardy was transformed into a territorial principality ruled by the Visconti family in which city autonomy was essentially abolished. A similar fate would eventually befall most of Tuscany's independent cities, although not until considerably later under the domination of the Medici. If both Lombardy and Tuscany had craft guilds during this period, in Tuscany the guilds exercised direct political control through the councils of autonomous cities that controlled their own economic policy, whereas in Lombardy this was not the case. Under the Visconti, as early as 1346 Lombard towns lost the right to create such restrictions. Epstein suggests that this abolition of barriers to entry resulted in greater innovation and production in Lombardy relative to Tuscany.
We see a similar effect of princely control in Flanders.Footnote 18 Flanders was dominated by three principal cities, Bruges, Ghent, and Ypres, each of which had a substantial textile industry and where guild involvement in politics resulted in the establishment of very significant barriers to entry for new artisans. However, political autonomy for these three principal cities was not as complete as in the case of the Tuscan communes of the fourteenth century. Each city was still subject to at least nominal overlordship by the Count of Flanders. One consequence was that the effective degree of autonomy often varied depending on who exactly was count. During the initial decades of the fourteenth century the three great cities enjoyed very substantial autonomy and they used this autonomy not only to maintain barriers to entry but also to ensure that no competing producers established themselves in the smaller surrounding towns and countryside. However, after 1349 under a new Count of Flanders there was a very substantial shift in power back to the Count's institutions and away from the guilds in the autonomous cities. One consequence of this reassertion of princely authority was that Bruges, Ghent, and Ypres no longer found it possible to exercise influence over the development of the textile industry in the surrounding towns and countryside. Once again, princely control over cities led to lower barriers to entry.
There is also a further element one might consider with regard to both autonomous and nonautonomous cities, although this will not be the main focus of my empirical tests. The ability of cities to establish barriers to entry may have depended not only on whether they were autonomous, but also on whether they had representation in national level representative institutions. While many national representative assemblies did not have prerogatives allowing them to heavily influence commerce, others were most certainly engaged in such activity. The assemblies in Flanders that have been extensively studied by Blockmans (Reference Blockmans1976) are a good example here.
To return to my main point, the above discussion provides both a theoretical and a historical basis for my conjecture that relative to nonautonomous cities, politically autonomous cities should first experience a high rate of growth followed by subsequent stagnation. The next step is to assess this possibility empirically, beginning with a presentation of my autonomous city data set.
CODING CITY AUTONOMY
For purposes of simplicity I refer to city autonomy in this article and in my empirical tests as if autonomy was a binary indicator. In practice, it is important to realize that the situation was considerably more complex. Autonomy was certainly a question of degree with some cities, such as Venice, having essentially complete autonomy over their affairs and others, such as the city of Ghent, enjoying a substantial degree of autonomy for certain periods despite still being subject to a degree of princely intervention. In addition, autonomy in many cases certainly also varied according to policy domain. If one can think of the right to raise taxes, the right to regulate its own judicial and economic affairs, and the right to organize its own defence as key characteristics of an autonomous city, then some cities might have strong prerogatives in all three of these areas, some might have them in none, and some in a mix of the three. In addition to having prerogatives in at least some of the above areas, the final crucial characteristic of an autonomous city was that it had institutions for self-governance, and the members of these institutions were chosen by inhabitants of the city itself and not by outside rulers. For the purposes of this article I have defined an “autonomous city” as being one in which there is clear evidence that such institutions of self-governance existed, and in addition there is also clear evidence of exercise of prerogatives in at least one of the policy areas referred to above. In the absence of such evidence the default is to code a city as nonautonomous.
The historical development of Europe's autonomous cities can be thought of in three phases.Footnote 19 The first phase was with the re-emergence of urban settlements after the Dark Ages, a phenomenon that Henri Pirenne thought to be associated with the re-emergence of long distance trade but that other authors have contested, as they suggest that cities actually formed because they were sites for proto-industry before engaging in long distance trade.Footnote 20
Irrespective of the sequence of events, both Pirenne and his critics are in agreement on the second phase of development which was that cities initially contained informal associations of merchants for self-protection, that these associations subsequently became formalized, and that the associations then demanded recognition of special privileges for the city from princely rulers. This was often referred to as the establishment of a commune. The communal movement occurred at a specific time in Western Europe with the first communes emerging at the end of the eleventh century and the vast majority of communes emerging during the twelfth and thirteenth centuries, a period that is known to have been one of strong economic growth under the medieval commercial revolution.
The third phase was the process through which autonomous cities lost their independence. As will be seen, this was very varied. In some cases, most notably in Italy, autonomous cities were conquered by neighboring autonomous cities. The most common pattern though was for an autonomous city to be conquered by the prince of a territorial state who sought to use the city's riches in order to engage in warfare. This is the pattern suggested by Charles Tilly (Reference Tilly1992) in his work as well as by Wim Blockmans in his well-known 1994 article entitled “Voracious States and Obstructing Cities.” However, while some authors have spoken of the period after 1500 as the age of the territorial state, it is important to recognize that while autonomous cities emerged during a particular historical period, they lost their autonomy over a course of numerous centuries.Footnote 21 Some autonomous cities did not lose their autonomy until the period of Napoleonic conquest, or even later.
I have used a number of sources to record the dates at which city autonomy began and ended for each of the 173 cities in the data set. Autonomy (if it ever existed) is coded as having begun at the first date for which there is evidence that the above definition of an autonomous city is satisfied; that is, there were institutions of self-rule and evidence of exercise of prerogatives in at least one area of policy. Autonomy is coded as having ended when there is a clear evidence that an outside intervention put a durable end to self-rule. The ideal way to code the above dates would be to refer to extensive individual histories for each city in the data set, something that was not feasible for this project. As a second best strategy, I have used several high quality reference sources that record detailed information for cities in the data set. The first of the three principal sources used was the Dictionary of the Middle Ages edited by Joseph Strayer, a 13-volume work published between 1982 and 1989. The second main source was the Lexikon des Mittelalters a 9-volume German language work that provides very detailed information on city histories. The third principal source was the 11th edition of the Encyclopedia Britannica, a version of this popular encyclopedia that contains vastly more detailed information on medieval cities than does the contemporary edition of the work. In addition to the above three sources, I also used the work on French communes by Charles Petit-Dutaillis (Reference Petit-Dutaillis1947), the information provided on Italian communes in Guiso, Sapienza, and Zingales (Reference Guiso, Sapienza and Zingales2009), and several further sources on individual cities.Footnote 22
Given the uncertainty for some cities in coding dates at which autonomy began and ended, I have also constructed an index of data quality for each of the 173 cities considered in this article with a value of 3 (the case for 111 cities) representing cases where there is clear information from more than one source, 2 (the case for 44 cities) representing a case where there is solid information but from only one source or from two sources that are discordant, and 1 (the case for 18 cities) representing very limited information. I will later use this index of data quality to consider whether my empirical results are robust to the exclusion of cities for which information is more uncertain.
The data set produced from the above sources inevitably contains a very substantial degree of measurement error, but it innovates on previous data sets in providing information on both when city autonomy began, as well as when it ended. The data set produced by Stasavage (Reference Stasavage2011) recorded whether a city ever became independent, but not the date at which autonomy was acquired, nor the date at which it ended. The data set produced by Bosker, Buringh, and van Zanden (Reference Bosker, Buringh and van Zanden2013) is more comprehensive than the current in that it covers a much broader set of cities. They adopt a weaker definition of city autonomy.Footnote 23
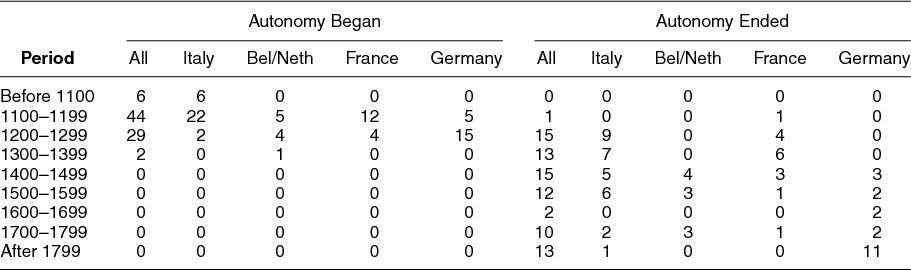
Table 1 provides a tabulation of the number of cities that became autonomous and which lost their autonomy by historical period. I also provide a breakdown by listing the four principal modern day regions in which autonomous cities were located: Italy, the Low Countries, France, and Germany. It should be emphasized that this breakdown is by modern countries, and not historical regions. So, for example, a number of cities in what is now the north of France were located in what was then Flanders. As can be seen, across all regions the overwhelming majority of cities that succeeded in establishing their autonomy did so during the twelfth and thirteenth centuries, the height of the medieval Commercial Revolution. So, at least in terms of gaining autonomy, it does make sense to say that this was the era of the city state in European history. However, what is less commonly recognized is that if the period after AD 1500 may have been associated with increasing dominance of large territorial states, a number of cities succeeded in retaining their autonomy for a considerable amount of time. Here there was much greater variation from region to region as well as within individual regions.
Tracking City Autonomy Over Time

Note: Each entry represents a count of the number of cities that gained or lost autonomy during the period in question. Only the principal regions containing autonomous cities are reported separately from the aggregate statistics.
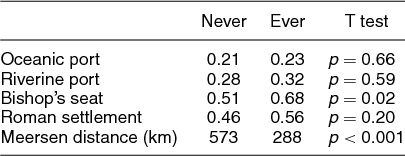
As a further step, we can also consider characteristics of cities that became autonomous, as opposed to those that did not. Table 2 lists mean values, as well as results of difference in means tests, for five different city characteristics distinguishing between the 81 cities in the sample that became autonomous at least for some time, as opposed to the 92 cities that never became autonomous.Footnote 24 The variables included are whether the city was an oceanic port, whether it was located on a navigable river, whether it was the seat of a bishop in the year 1100, whether it had been a significant Roman settlement, and finally how distant the city was from the Meersen line, which is the line agreed to at Meersen in AD 870 that split the former Carolingian Empire into two parts.Footnote 25 These characteristics will later be used in my empirical tests to control for factors that might have simultaneously influenced city autonomy and population growth. As can be seen in Table 2, the only two variables for which we can see a significant difference between autonomous and nonautonomous cities are the presence of a bishop and distance from the Meersen partition line.
Characteristics of Cities That Became Autonomous At Least For Some Time and Those That Did Not

Notes: The variable “Meersen distance” refers to the distance from the partition line of the Treaty of Meersen signed in AD 870. T test refers to p value from a difference in means test. N = 173.
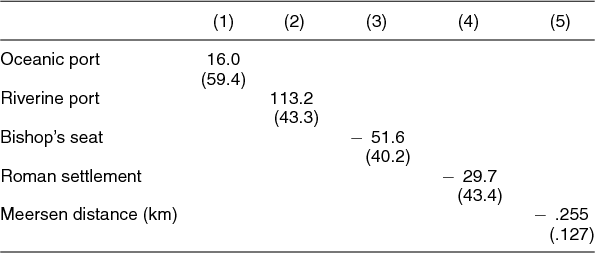
We can also consider several statistics on how long cities tended to remain autonomous once they gained this privilege. The sample mean for duration of autonomy is 341 years. Within the group of 81 cities that became autonomous, a quarter of the cities lost their autonomy by the end of the second century of autonomy, but another quarter were able to maintain their autonomy for more than 500 years. So the experience was quite varied. Table 3 reports the results of a set of bivariate OLS regressions where the sample is the 81 cities that became autonomous at least for a time, and the dependent variable is the number of years of autonomy. As can be seen, only location on a navigable river and proximity to the Meersen line are significantly correlated with the duration of autonomy. Once again the broad picture seems to be that proximity to the Meersen line was correlated with autonomy but other observed characteristics were more weakly correlated with autonomy.
OLS Estimates of Duration of Autonomy

Notes: Dependent variable is the number of years that a city remained autonomous. N = 81. The variable “Meersen distance” refers to the distance from the partition line of the Treaty of Meersen signed in AD 870. Robust standard errors in parentheses.
EMPIRICAL STRATEGY
The primary objective of this article is to investigate whether and when autonomous cities had more flourishing economies than nonautonomous cities. One empirical approach to address this would be to proceed as follows. If there are some reasons to believe that political autonomy for a city would be good for growth and other reasons to believe that it would be bad for growth, then we could attempt to investigate which one of these effects dominates by examining whether autonomous cities grew more quickly on average. In a number of political economy articles authors have used rates of urbanization or city size as proxies for economic growth during the medieval and early modern eras, even if it is recognized that growth of the urban population does not necessarily equate with economic growth more generally or growth in per capita income more specifically. This choice is dictated by the absence of better proxies for economic growth, at least if one is going to conduct a broad study across multiple regions. This approach is also facilitated by the existence of the data set compiled by Bairoch, Batou, and Chevre (Reference Bairoch, Batou and Chevre1988). In a recent article, Bosker, Buringh, and van Zanden (Reference Bosker, Buringh and van Zanden2013) build on the Bairoch data set to provide the first broad empirical assessment of this question. Using a definition of city autonomy less restrictive than that in this article, they find that autonomous cities were on average 12% larger than cities that lacked political autonomy (their dependent variable is the level of population rather than growth rates). They do not consider whether the effect of city autonomy depended on how long a city had been autonomous.
For my own investigation I ask not only whether autonomous cities grew more quickly on average, but also whether their pattern of growth followed a particular trend over time. I have conjectured that we might expect autonomous cities to have initially grown more quickly than nonautonomous cities but that eventually this situation would be expected to reverse itself. To investigate this possibility, I will estimate an equation in which the effect of city autonomy on population growth is allowed to vary over time. The general equation I seek to estimate is as follows:
 \begin{eqnarray}
g_{it}&=&\frac{p_{it+1}-p_{it}}{p_{it}}=\alpha +\beta A_{it}+{ \gamma } {(}A_{it}\cdot F(Y_{it}))\nonumber\\
&&+\,\zeta\,\, p_{it}+\eta _{t}L_{i}+\mu _{i}+\theta _{t}+\varepsilon _{it}.
\end{eqnarray}
In this equation g, the rate of population growth in percentage terms between time t and time t + 1, is estimated as a function of the following variables all taken at time t. Each period of time represents a century with the year AD 1000 as the beginning point in the sample and the year 1800 as the end point.Footnote 26 Missing values in the population data set were linearly interpolated, but no values were extrapolated. This results in an unbalanced panel with 173 cities and 1052 observations. In Equation (1) the variable A takes a value between zero and one representing the fraction of the period for which a city was politically autonomous. The variable Y is simply the number of years that a city has been autonomous.Footnote 27 I consider three alternatives for estimating Equation (1).
-
1. In the first specification the difference between autonomous and nonautonomous cities is captured only by the β coefficient.
-
2. In the second alternative the effect of political autonomy is modeled as a function of β as well as γ in which the function Ftakes a value of one if Y ⩽ 100 and zero if Y > 100.
-
3. In the third alternative the effect of city autonomy is modeled as a function of β, in addition to γ1 Y + γ2 Y 2. This is a more flexible specification that does not impose an arbitrary cut point.
In addition to estimating the rate of population growth as a function of A and Y, I also include the level of a city's population pit at the beginning of each time period t in order to capture the effect identified by Dittmar (Reference Dittmar2011) whereby if there were constraints on the ability of obtaining foodstuffs for the population, then as a city grew in size we might expect it to grow more slowly.Footnote 28 All specifications also include a full set of time period dummies θ t , and in some specifications I control for city-specific fixed effects μ i , or as an alternative, I include several control variables designed to capture fixed features of a city as described below. In some of the fixed effects specifications I also add dummy variables for location Li interacted with time dummies. Location is based either on dummy variables for modern day regions, or alternatively on latitude, longitude, and latitude*longitude, all interacted with the period dummies. As discussed above, this will help control for factors that produced region and time specific shocks, such as the opening up of Atlantic trade. This is quite a stringent test.Footnote 29 Finally, in all specifications I cluster standard errors at the city level to take account of any within city correlation in the error term that might bias the estimates.
ESTIMATION RESULTS
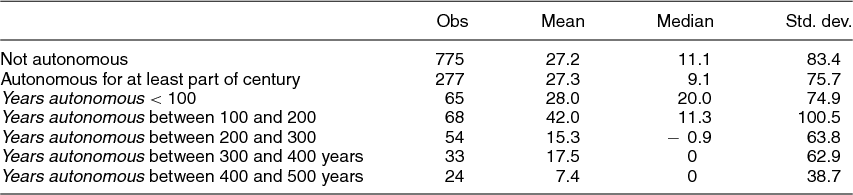
Before considering the core estimation results of the article, it is first useful to review some descriptive statistics regarding rates of population growth in autonomous and nonautonomous cities. The mean for the growth rate across the entire sample is 27.2 percentage points with a standard deviation of 81.4. The mean growth rate for periods in which a city was autonomous for at least part of the century is 27.3 percentage points, as opposed to 27.2 percentage points for cities that were not autonomous at all during the century. So, at first glance there is very little evidence of a difference in growth rates between autonomous and nonautonomous cities.
When we consider the sample of autonomous cities and break it down by considering how long a city has been autonomous, we see a somewhat different story. The evidence in Table 4 provides some indication that city-states initially enjoyed higher growth rates than did nonautonomous cities, but after a certain point they experienced lower growth rates than the nonautonomous cities. The descriptive statistics in Table 4 do not of course control for any other variables, and they are based on ad hoc time demarcations.
Population Growth Rates for Autonomous and Nonautonomous Cities

Note: This is based on the sample of 173 cities with time periods running from 1000 to 1800.
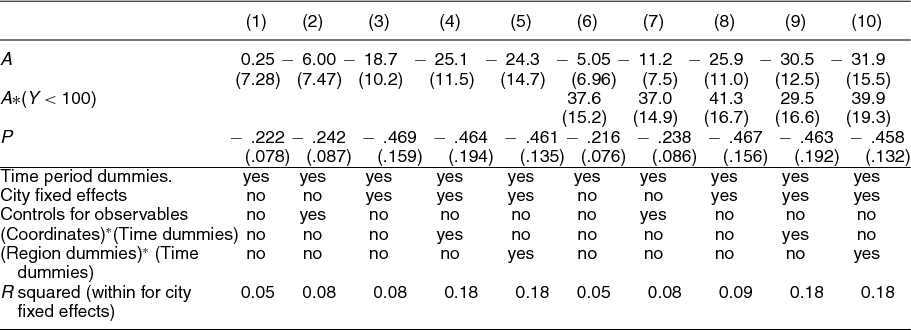
As a next step, Table 5 reports OLS estimates of city population growth with 10 different specifications considered. In the first five specifications the effect of city autonomy is modelled as being constant over time. In the remaining five specifications a variable is added that allows for distinguishing between the effect of autonomy when Y < 100. Finally, I control for time-constant confounders at the city level using two alternative strategies: (1) a fixed effects model that in some specifications also includes controls for location and time specific shocks; (2) a pooled OLS specification that adds latitude, longitude, and the product of latitude and longitude, in addition to four variables measuring observable and time invariant features of a city that one might expect to have an effect on both population growth and the likelihood of becoming autonomous. The first two of these are dummy variables for cities that were oceanic ports or which were located on navigable rivers (with navigability proxied for by including all cities on a river the width of which exceeded 50 meters).Footnote 30 I then also included a dummy variable for whether a city was the seat of a bishop at the outset of the period considered here. Guiso, Sapienza, and Zingales (Reference Guiso, Sapienza and Zingales2009) have suggested that Italian cities that had bishops were more likely to become independent communes. However, in Germany it was often the case that to gain its autonomy, a city had to establish independence from a bishop. The fourth and final control variable is a dummy variable for all cities that were significant Roman settlements.Footnote 31 During the Roman Empire, it was common for towns to be given the status of civitas which implied a substantial degree of self-government. It is plausible that such cities may have found it easier to re-establish their autonomy during the Middle Ages, and Roman heritage may also have had implications for economic growth.
OLS Estimates for City Population Growth

Notes: Dependent variable in all specifications is the percentage change in city population. N = 1052. “Controls for observables” includes dummy variables for oceanic ports, riverine ports, bishop's seat, roman settlement, in addition to latitude, longitude, and the product of latitude and longitude. The coefficients for these variables are not reported. The specifications including “(Coordinates)*(Time dummies)” include latitude, longitude, and the product of latitude and longitude, with each of these variables interacted with a full set of time period dummies. The specifications including “(Region dummies)*(Time dummies)” include a set of dummy variables for region (modern-day country) interacted with time period dummies. All standard errors are clustered by city.
Considering the first five specifications in Table 5, in the pooled OLS estimates there is no evidence that on average, autonomous cities had a different rate of population growth than did cities that lacked autonomy. In the fixed effects estimates the coefficient on A is actually negative and statistically significant in one specification.
Consider next the results of the estimates in columns (6) through (10). In the case of a city for which Y < 100, the estimated “effect” of autonomy is given by the sum of the coefficients on A and A*(Y < 100). In the case of a city for which Y > 100, the estimated effect of autonomy is given only by the coefficient on A. This is the simplest way of directly testing the possibility that the effect of autonomy on growth was somehow different for cities that had been independent for one hundred years as opposed to for longer. Across the five specifications we see that the coefficient on A is not statistically significant in the specifications without city fixed effects and negative and statistically significant in those specifications that do include city fixed effects. We also see in columns (6) to (10) that the coefficient on A*(Y < 100) is positive, large in magnitude, and statistically significant in all but one case. A further feature of all specifications in Table 5, and in fact all specifications in this article, is the relatively low values for the r-squared statistics. As the Bairoch population data are composed of population estimates from heterogeneous sources that are known to vary in quality, the low values for this goodness of fit statistic may primarily reflect measurement error in the dependent variable, though it also may of course simply reflect the presence of unobserved time varying factors determining city growth.
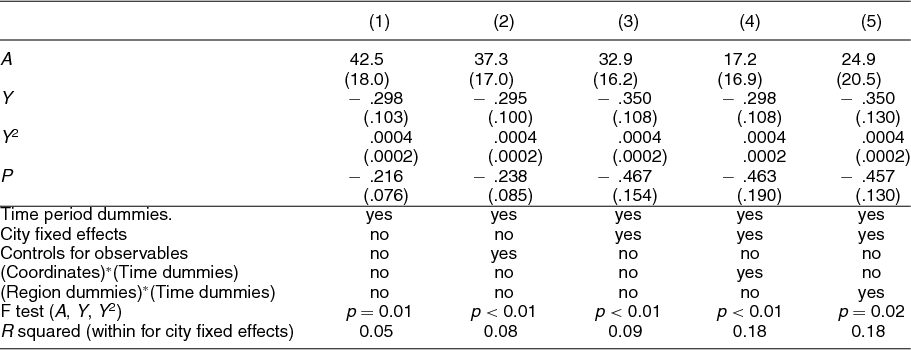
The main shortcoming of the specification in Table 5 is that the cutoff of Y = 100 is arbitrary. As a next step, Table 6 reports the results of a more flexible specification in which the effect of city autonomy is modelled as a function of both an intercept shift represented by the coefficient on A, a linear trend represented by the coefficient on Y, and a quadratic trend represented by the coefficient on Y 2. The estimation results from the OLS and fixed effects specifications are relatively clear. The trend terms are statistically significant in all specifications while the coefficient on A is generally statistically significant but less precisely estimated in the more demanding specifications that include not only city fixed effects but also interactions between time and geographic location. The coefficient on A suggests an initial advantage for a newly autonomous city in terms of population growth. The coefficient on the two trend terms Y and Y 2 suggest that this advantage would then decline, albeit at a decreasing rate.
OLS Estimates for City Population Growth

Notes: Dependent variable in all specifications is the percentage change in city population. N = 1052. “Controls for observables” includes dummy variables for oceanic ports, riverine ports, bishop's seat, roman settlement, in addition to latitude, longitude, and the product of latitude and longitude. The coefficients for these variables are not reported. The specifications including “(Coordinates)*(Time dummies)” include latitude, longitude, and the product of latitude and longitude, with each of these variables interacted with a full set of time period dummies. The specifications including “(Region)*(Time dummies)” include a set of dummy variables for region (modern day country) interacted with time period dummies. All standard errors are clustered by city.
Though the unit of observation in the Table 6 estimates is a city-century, the easiest way to express the magnitudes for the results is to consider what they would imply for annual data. The “effect” of autonomy for a city that has been autonomous for Y years is therefore given by βA + γ1 Y + γ2 Y 2. Based on the specification in column (2) a newly autonomous city would initially have an annual population growth rate 0.4 percentage points higher than a nonautonomous city. Based on this same specification, the growth advantage for an autonomous city would decline and after 160 years reach a point of inflection as the autonomy effect would now turn negative. The positive coefficient on the quadratic trend term does imply that the autonomy effect would eventually become positive again. However, this would not be estimated to occur until after 625 years, a point that is observed for less than 5% of the sample. Based on the specification in column (3) that includes city fixed effects, we reach a similar conclusion about the initial growth advantage for an autonomous city, though the point of inflection is estimated to occur earlier at 108 years.
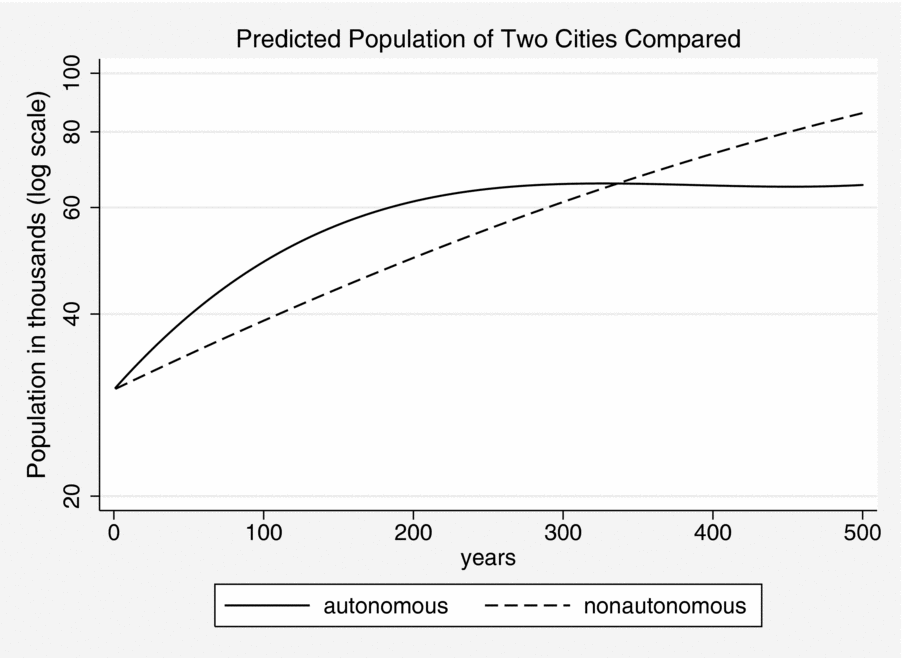
We can also use the Table 6 estimates to consider the hypothetical case of two cities that start with an initial population of 30,000 inhabitants (not small by medieval standards), one of which becomes politically autonomous and remains so and one of which does not. The trajectory for their population over a 500-year period would be shown by the two lines in Figure 1. These population figures are based on the predicted values for growth from column (2) in Table 6. As can be seen, the population of an autonomous city would peak at about 65,000 after 250 years. While a nonautonomous city would initially grow more slowly, after 327 years its population would surpass that of the autonomous city and would continue to rise to a level of 85,000 by the end of the five centuries.
Predicted Population Levels Based on Table 6 Column 2 Estimates with All Variables Other than A, Y, Y 2, and P Set at their Mean Values

In this section I have presented three types of evidence to suggest that autonomous cities initially grew more quickly than did cities subject to princely rule, but this situation eventually reversed itself. First, simple descriptive statistics are suggestive of this pattern. Next, in pooled OLS regressions and fixed effects regressions that also include controls for period specific shocks as well as region specific shocks by period, we see no indication that autonomous cities on average grew either more or less quickly than did other cities. Finally, I have explored several different ways of estimating an effect of city autonomy that is allowed to vary over time. The results strongly suggest that autonomous cities had an initial advantage in terms of growth followed by substantially slower growth in subsequent centuries. One final caveat to the above conclusions is that we should of course remember that they apply to population growth and that, as is common in the literature for this period, population growth is being used as a proxy for growth in the size of an economy. I have not directly demonstrated that autonomous cities initially saw an expansion of trade or innovation relative to nonautonomous cities.
ROBUSTNESS
The estimation results reported in the previous section control for unobserved time period effects, unobserved heterogeneity at the city level, and finally factors that may have created region and time specific shocks to population growth rates. This is quite a stringent set of tests. Nonetheless, there remain several reasons why we might still be cautious about interpreting them as reflecting a causal effect of city autonomy on growth. Here I will consider six such possibilities. The first is that rapid population growth actually preceded political autonomy, and it was this factor that permitted a city to become independent. Continuing growth in the initial phase of a city's autonomy then may have simply reflected this underlying trend, and not a causal effect of autonomy. The second possibility is that my results may reflect a causal effect of autonomy, but only for specific regions, suggesting the presence of important mediating variables. To consider this I allow the effect of autonomy to vary by region. The third possibility I consider is that the declining growth rate of autonomous cities reflects the fact that they emerged at a particular point in time and that their declining growth rates are attributable to changes in the external environment they faced, and not to their institutional structure. The fourth possibility is that my results are produced by coding biases. To examine this I repeat my estimations while excluding cities for which information was more sparse or contradictory. The fifth possibility involves bias due to spatial correlation of errors. Finally, I discuss what sort of time varying unobservables might still be biasing my results.
Placebo Test for Preautonomy Growth
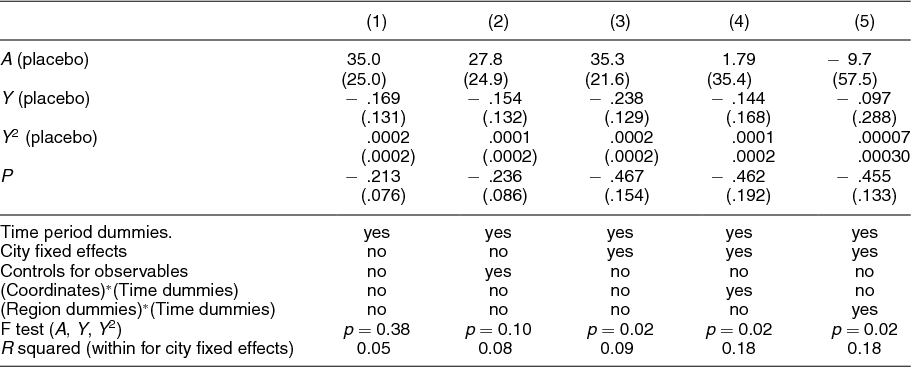
I consider the possibility that rapid growth for autonomous cities reflected an underlying trend by conducting a variant of a placebo test. As discussed above, this test is similar in spirit to the Granger test for difference in differences models proposed by Angrist and Pischke (Reference Angrist and Pischke2009, 237), and it is designed to consider the possibility that my results are biased by the failure to take account of the possibility that growth caused cities to become autonomous in the first place.Footnote 32 Taking the specifications in Table 6, I recoded the three variables A, Y, and Y 2 by setting a placebo date for the establishment of autonomy equivalent to 100 years prior to the actual date. I then re-estimated each of the six specifications using these recoded variables. As can be seen in Table 7, the results are fairly unambiguous. The coefficients on A are smaller than in the Table 6 estimates, and they are generally not statistically significant. The same conclusion applies for the linear trend terms. This is strong evidence that the fact autonomous cities grew more quickly than nonautonomous cities does not reflect an underlying trend that commenced prior to the establishment of autonomy. The possible implication then is that cities were able to establish their political autonomy not because of a strong period of prior growth, but due to factors such as geographic isolation from the capitals of princely rulers. As I have noted above, there is robust evidence that the manner in which the Carolingian Empire fragmented made it easier for some cities to subsequently establish their autonomy. This interpretation is also supported by the tests in Tables 2 and 3.
Placebo Test Using OLS Estimates for City Population Growth

Notes: Dependent variable in all specifications is the percentage change in city population. N = 1052. “Controls for observables” includes dummy variables for oceanic ports, riverine ports, bishop's seat, roman settlement, in addition to latitude, longitude, and the product of latitude and longitude. The coefficients for these variables are not reported. The specifications including “(Coordinates)*(Time dummies)” include latitude, longitude, and the product of latitude and longitude, with each of these variables interacted with a full set of time period dummies. The specifications including “(Region)*(Time dummies)” include a set of dummy variables for region (modern-day country) interacted with time period dummies. All standard errors are clustered by city.
A Varying Autonomy Effect by Region
In the estimates I have reported so far, I have implicitly assumed that the effect of political autonomy does not vary by region. The result is that I may have a good estimate of the average effect of autonomy across regions. However, there may be enough variation from region to region in this effect to imply that the average is not particularly meaningful. The effect of political autonomy could vary if the nature of the relationship between princes and rulers of autonomous towns (or other towns) differs from region to region. To investigate this possibility I first re-estimated specification 3 from Table 5 while interacting A with a set of region dummies where region corresponds to a modern-day country. In specification 3, which includes city fixed effects, the coefficients of these interaction terms were relatively precisely estimated. Even so, a test showed that one could not reject the null that the coefficients on these interaction terms were identical. A very similar result was obtained when either the A or Y variables were interacted with a set of region dummies using specification 3 in Table 6. Once again the interaction terms were relatively precisely estimated, but it was not possible to reject the null that they were identical.
The above test suggests that the effect of urban autonomy did not vary tremendously by region. There are other ways that one might approach the problem. We could posit a more explicit theory about the factors influencing autonomy and then attempt to test this proposition more directly. One possibility is that the effect of urban autonomy depended on country size. The opportunity cost of barriers to entry in autonomous cities may have been greater in larger markets. To the extent that polity size proxies for market size we would then expect the effect of autonomy to be smaller in larger countries. However, we know that many of the large countries in Europe at this time had very fragmented markets due to restrictions at the regional level, and France provides an excellent example of this. All the same, I attempted a crude test of this hypothesis by breaking my sample into cities located within regions where political jurisdictions were large (France, England, Castilian Spain, Southern Italy) and where political jurisdictions were small (Austria, Germany, Northern Italy, Portugal, and Switzerland). I then included an interaction term where my autonomy variable A was interacted with political jurisdiction size. I then repeated my core specifications from Tables 5 and 6. In no case was this interaction term statistically significant.
A second possibility, and one that I have already referred to above, is that the effect of urban autonomy may have depended on the extent to which cities (autonomous or not) had power within national representative institutions in those cases where such institutions existed. Power within national representative institutions may have helped allow cities (autonomous or not) to establish barriers to entry. One could potentially use either the database of representative institutions produced by Stasavage (Reference Stasavage2011) or that produced by Bosker, Buringh, and van Zanden (Reference Bosker, Buringh and van Zanden2013) to investigate this possibility. However, in order to do so we face a thorny problem in that some of the autonomous cities in my sample can be said to have been located within a larger polity whereas others were more completely independent. An effective test of this hypothesis would therefore first depend on deciding which ones to include in the analysis. A second problem is that existing representative institutions data may be poorly suited to considering the question. The database constructed by Stasavage (Reference Stasavage2011) focuses on assembly prerogatives in the area of public finance, but not the commercial questions that would be most relevant for the core question of the current article. Bosker, Buringh, and van Zanden (Reference Bosker, Buringh and van Zanden2013) have produced a measure showing the frequency with which parliaments that included urban representation met. However, their data contain no information on prerogatives with regard to commercial regulation.
A Varying Autonomy Effect by Time
We might also want to consider whether my econometric results are potentially biased by a failure to control for a changing effect of autonomy across historical time periods. This is made difficult by the fact that cities became autonomous during a fairly narrow time window during the twelfth and thirteenth centuries. My inclusion of period dummies in all of my specifications controls for the most obvious source of bias. We know that the thirteenth century was a period of fast growth in Europe relative to what would follow, and we also know that there were numerous newly autonomous cities at this point. The inclusion of location controls interacted with time in several of my specifications controls for a further potential source of bias. There were certainly time and region specific shocks to growth in Europe during this period, and it may be the case that these shocks were correlated with the fraction of cities that were autonomous in each region as well as the length of time that they had been autonomous. The final remaining possibility is that there may have been shocks that affected autonomous and nonautonomous cities asymmetrically. Perhaps it was the case that autonomous cities were good at delivering growth during a particular historical period and not afterwards.
Following on the above intuition, received wisdom from numerous authors suggests that some time around AD 1500, a series of technological changes, and in particular the introduction of the cannon, led to increased fixed costs for defence because cities now had to build sturdier walls than ever before.Footnote 33 This may have necessitated higher tax rates with the knock on effect of lower growth. If true, this would provide an alternative account to mine for the time path of autonomous city growth. To test this possibility I estimated the following equation:
 \begin{eqnarray}
g_{it}&=&\alpha +\beta A_{it}+{\gamma }_{1}Y+{\gamma } _{2}Y^{2}+\lambda (A_{it}\cdot {(t\ge Y}^{\ast }{)})+\zeta\,\, p_{it}\nonumber\\
&&+\,\mu _{i}+\theta _{t}+\varepsilon _{it}.
\end{eqnarray}
This equation is the same as that used for the Table 6 specifications, augmented by a parameter λthat estimates the changing effect of city autonomy after a prespecific break date Y* . I consider three possible break dates: 1400, 1500, and 1600. If the military technology interpretation is accurate, then we should expect λ to be negative and statistically significant in at least one of the specifications. Likewise, if my existing regression results have been biased by failing to take account of this shift in military technology, then my estimates of
 ${\bm \gamma}_{1}$
and
 ${\bm \gamma}_{2}$
should be closer to 0. In Table A4 in the Appendix I report results where I re-estimate the first three of the Table 6 specifications while adding the term λ(Ait
· (t ⩾ Y*)). This term is simply A multiplied by a dummy variable that takes a value of 1 for all years beginning in year Y* and 0 otherwise. The results are as unambiguous. While my estimates of
${\bm \gamma}_{1}$
, and
${\bm \gamma}_{2}$
remain very similar, the estimate of λ is generally not statistically significant, and when it is statistically significant the coefficient is positive, rather than being negative as the military technology interpretation would suggest.
The test proposed above suggests that my findings regarding the time path for growth of autonomous cities is not produced by the fact that autonomous cities suddenly began to fare worse as a result of military changes that took place between 1400 and 1600. As a next step, we might also want to consider whether more gradual pan-European changes produced the reversal in fortune between autonomous and nonautonomous cities. In order to explore this possibility I augmented the Table 6 specifications to estimate the following equation:
 \begin{eqnarray}
g_{it}&=&\alpha +\beta A_{it}+{\gamma }_{1}Y+{\gamma } _{2}Y^{2}+\lambda _{1}A_{it}t+\lambda _{2}A_{it}t^{2}+\zeta\,\, p_{it}\nonumber\\
&&+\,\mu _{i}+\theta _{t}+\varepsilon _{it}.
\end{eqnarray}
The idea here is to use the estimates of the γ and λ parameters to test between two potential trends. To the extent that the γ parameters are statistically significant, we can conclude that the effect of political autonomy depended on how long a city had been autonomous. To the extent that the λ are statistically significant, we can conclude that the effect of political autonomy varied by time period. Given that all autonomous cities emerged during a specific period in time, t and Y will be highly correlated, and this is therefore quite a demanding specification. The results of this exercise are reported in Table A5 of the Online Appendix. They do not lead to an unambiguous conclusion, but they do provide some evidence that my Table 6 results do not depend on the fact that the effect of autonomy varied by time period t and not by years of autonomy Y. In none of the three specifications do the λ coefficients approach statistical significance. In contrast, the
${\bm \gamma}_{1}$
coefficient is of essentially identical magnitude to that in the Table 6 estimates that do not include the λ1
At and λ2
At
2 terms. However, the
${\bm \gamma}_{1}$
coefficient is somewhat less precisely estimated.
Biases Due to Coding Error
A further possible source of bias in my estimates might involve that due to measurement error in my three autonomy variables A, Y, and Y 2. As described above, I developed a coding index that has three levels, the the top of which is attained if there is consistent information from more than one of my sources for the city in question. This is the case for 111 of my 173 cities. Measurement error that simply involves idiosyncratic noise would ordinarily be expected to simply inflate my standard errors, but we cannot of course assume a priori that any measurement error takes this form. It could be the case that data for the low information quality cities is biased in a particular direction. As one way to approach the problem, I re-estimated the Tables 5 and 6 specifications while only retaining the 111 cities that have the highest level for the data coding index. The results of this exercise are reported in Tables A6 and A7 of the Online Appendix. Using the high quality sample of 111 cities, in the specifications distinguishing between autonomy before and after Y = 100 we continue to observe no positive effect of autonomy on average, but there remains consistent evidence of a growth advantage for autonomous cities during their early period of autonomy. When repeating the quadratic trend specifications while using the high quality sample we continue to obtain very similar results.
One might also be worried that any bias in my sample would derive from the high information quality cities. It might be the case that cities experiencing periods of fast growth were more likely to be the subject of attention, there would be more information about them, and thus we would be more likely to code them as being autonomous (remembering that the default in the case of low information is to code as nonautonomous). In practice this appears not to have been the case. The population growth rate is only a very weak predictor of the data quality index.
Spatial Correlation
Growth in groups of cities may tend to exhibit patterns of spatial correlation. In the case of medieval and early modern Europe, it is well known that urbanization initially advanced most quickly in two clusters centered around northern Italy and the Low Countries, and that more generally there was a zone of higher urbanization between these two clusters.Footnote 34 I have already controlled for this to a significant degree by including controls for city fixed effects in addition to controls for location interacted with time. However, failure to take account of any remaining spatial correlation in the residuals of my regression estimates could result in biased estimates of the standard errors. The form of spatial dependence in city growth rates could potentially be quite complex, as there are plausible reasons for growth in a given city to be either positively or negatively correlated with that of its neighbors. To take account of the potential effect of spatial dependence, I tested for spatial correlation of errors using a test appropriate for panel data proposed by Pesaran (Reference Pesaran2004). This is a test based on averages of pairwise correlation coefficients of regression residuals. Importantly, it is also a test that does not require a priori specification of a spatial weighting matrix.Footnote 35 Based on this test, in each of the fixed effects specifications in Tables 5 and 6 the test statistic indicated that in all cases it was not possible to reject the null hypothesis of no spatial correlation.
Other Time Varying Unobservables
As a final step, it is worth considering what remaining time varying unobservables could potentially be biasing my results. One possibility is that it might be the case that when a particularly effective leader or leadership assumes control of a city, they would seek to simultaneously establish autonomy and also take actions favorable to growth. If a current leader or leadership is particularly competent, in expectations a subsequent leadership would be less competent, creating the possibility of mean reversion in population growth rates driven by nothing other than leader turnover. In this case I might find a pattern whereby autonomous cities initially grew quickly and then more slowly but for reasons that have nothing to do with the effect of autonomy itself. One way to rule out the above possibility could be to identify a suitable instrumental variable for city autonomy, but this is not an easy task. As shown in a previous section, proximity with the Meersen partition line established at the end of the Carolingian Empire is a very strong predictor of city autonomy as well as its duration. However, my estimates include multiple endogenous autonomy variables, so the model cannot be identified with a single instrument. Moreover, proximity to the Meersen line is likely to be correlated with multiple factors that might influence economic growth, and so it is very uncertain that the exclusion restriction for this instrument would be satisfied. Both of these problems could potentially be solved by instrumenting with the Meersen distance interacted with some function of time, or alternatively with a set of period dummies. Unfortunately, this instrumenting strategy resulted in very imprecise estimates.
If the possibility of time-varying unobservables as confounders cannot be ruled out by econometric means, there may still be other reasons to believe that they are unlikely to be creating bias in my estimates. The reason for this is that if my estimates show a pattern whereby autonomous cities first grew more quickly than others, with a subsequent decline in this growth advantage, they also show that a little more than a century after establishing autonomy, an autonomous city would actually be expected to grow more slowly than a nonautonomous city. Moreover, we know that among those cities that did become autonomous, a very high fraction remained autonomous for more than a century, so this pattern is actually common in the sample. In the case of mean reversion being explained by leadership turnover, this would then imply that a particularly competent leadership would on average be expected to be followed by a particularly incompetent leadership. One would need to provide a theoretical reason for such an expectation as standard properties of mean reversion could not account for it. More generally, the fact that autonomous cities eventually grew substantially more slowly than nonautonomous cities suggests that only a substantially more restricted set of time-varying unobservables could possibly be producing the observed pattern in the data.
CONCLUSION
The history of Europe's autonomous cities provides us with an important opportunity to examine the implications of property rights protection for economic growth, a question that is every bit as relevant today as it was in medieval and early modern Europe. Europe's autonomous cities have long been seen as one of a set of political institutions, along with national representative assemblies, that were distinct from the institutions found in other world regions and which may have helped lead to Europe's economic rise. At the same time the policies adopted by the merchant and craft guilds that so often controlled autonomous cities involved the applications of barriers to entry into markets and professions, something that may have stifled trade, and innovation. Based on a theoretical conjecture, I have examined whether the establishment of political autonomy for a city may have initially led to a high rate of growth followed by a subsequent period of stagnation as barriers to entry prevented the entry of entrepreneurs. Using a sample of 173 cities, I have presented several forms of evidence to support this proposition. The principal implication of my results is to provide support for the notion that whenever institutions provide strong property rights but also barriers to entry, this can be a double edged sword for economic development.
Online materials
To view online material for this article, please visit http://politics.as.nyu.edu/object/DavidStasavage




Comments
No Comments have been published for this article.