Introduction
Geohistorical records contain valuable data on past generations of organisms and community states and are increasingly used as tools for conservation, including biodiversity assessment; identification of invasive species; recognizing past, prestress ecosystem states; and monitoring the progress of restoration (e.g., Swetnam et al. Reference Swetnam, Allen and Betancourt1999; National Research Council 2005; Smith Reference Smith2008; Tsumjimoto et al. Reference Tsujimoto, Yasuhara, Nomura, Yamazaki, Sampei, Hirose and Yoshikawa2008; Rick and Lockwood Reference Rick and Lockwood2013; Lotz and McClenacha Reference Lotz and McClenacha2014; Dietl et al. Reference Dietl, Kidwell, Brenner, Burney, Flessa, Jackson and Koch2015; Kidwell Reference Kidwell2015). Comparison of living communities with their locally accumulating death assemblages—that is, dead and discarded organic remains produced by the living community, such as shells, bones, molts, and cysts—is proving to be a useful tool in marine, lacustrine, and estuarine environments (Warwick and Light Reference Warwick and Light2002; Alin and Cohen Reference Alin and Cohen2004; Kidwell Reference Kidwell2007, Reference Kidwell2013; Pyenson Reference Pyenson2011; Weber and Zuschin Reference Weber and Zuschin2013; Casey et al. Reference Casey, Dietl, Post and Briggs2014; Korpanty and Kelley Reference Korpanty and Kelley2014; Hassan Reference Hassan2015; Zuschin and Ebner Reference Zuschin and Ebner2015; Archuby et al. Reference Archuby, Adami, Martinelli, Gordillo, Boretto and Malve2015; Smith and Dietl Reference Smith and Dietl2016; Powell et al. Reference Powell, Kuykendall and Moreno2017). Empirical studies, including modeling of repeatedly sampled living assemblages and geologic age dating of skeletal remains, demonstrate that death assemblages are time-averaged accumulations of individuals from many generations (e.g., Peterson Reference Peterson1976, Reference Peterson1977; Smol et al.Reference Smol, Charles and Whitehead1984; Dixit et al. Reference Dixit, Dixit and Smol1989; reviews by Kidwell Reference Kidwell2013; Kidwell and Tomašových Reference Kidwell and Tomašových2013). A death assemblage thus accrues an ecological memory that sums across short-term variability in populations and community states and can be a useful metric of regional biodiversity over periods that exceed modern and historical survey data. However, if the sampled area has undergone a recent, relatively strong environmental change, a significant mismatch can exist between the living community and the local death assemblage, because the living community has been shifted away from its long-term average state, which the death-assemblage records. Meta-analysis of shallow-marine molluscan studies reveals that live–dead discordance greater than would be expected from time averaging alone is limited almost entirely to settings associated with human activities, either acting directly on the benthic habitat or in the watershed (Kidwell Reference Kidwell2007).
Here, we evaluate this approach for ostracodes in subtropical lakes, a new system with relevance for limnology and paleolimnology. Ostracodes are small-bodied (typically ~0.5 mm), bivalved crustaceans and occur globally in almost all aquatic environments, from freshwater to marine (Frenzel and Boomer Reference Frenzel and Boomer2005; Rodriguez-Lazaro and Ruiz-Muñoz Reference Rodriguez-Lazaro and Ruiz-Muñoz2012). In lacustrine and marginal marine environments such as estuaries, brackish lagoons, and tidally influenced lakes, ostracodes are often the most abundant small calcareous animal, and their calcite valves can be preserved in high numbers (Smith and Horne Reference Smith and Horne2002; Martens et al. Reference Martens, Schön, Meisch and Horne2008). They are sensitive to the abiotic environment and are widely used as indicators of pollution (Ruiz et al., Reference Ruiz, Abad, Boderget, Carbonel, Rodrígues-Lázaro and Yasuhara2005; Padmanabha and Belagali Reference Padmanabha and Belagali2008; Escrivà et al. Reference Escrivà, Smith, Aguilar-Alberola, Kamiya, Karanovic, Rueda, Schornikov and Mesquita-Joanes2012; Yasuhara et al. Reference Yasuhara, Tittensor, Hillebrand and Worm2017) and paleoenvironment (Lord et al. Reference Lord, Boomer, Brouwers and Whittaker2012; Viehberg and Mesquita-Joanes Reference Viehberg and Mesquita-Joanes2012), mostly in studies using sediment cores (e.g., Yasuhara et al. Reference Yasuhara, Hunt, Breitburg, Tsujimoto and Katsuki2012; Zeppilli et al. Reference Zeppilli, Sarrazin, Leduc, Arbizu, Fontaneto, Fontanier, Gooday, Kristensen, Ivanenko, Sørensen and Vanreusel2015). However, the power of live–dead mismatch for detecting anthropogenic changes using surficial-sediment ostracode assemblages is not a foregone conclusion, given the potential for postmortem resuspension and transport among meiofauna and the volatility of their reproduction and colonization (e.g., see Jorissen and Wittling Reference Jorissen and Wittling1999; Park et al. Reference Park, Cohen, Martens and Bralek2003).
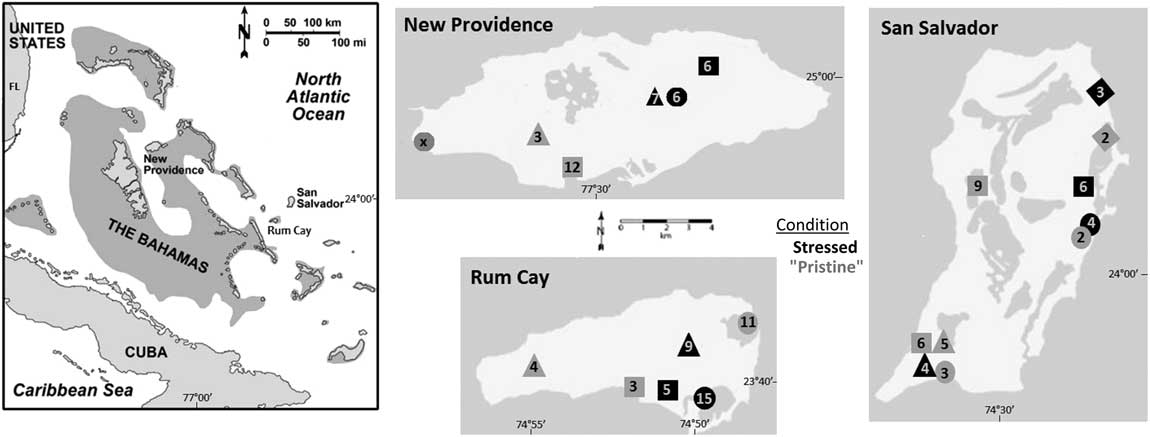
We test live–dead agreement as a function of suspected human stresses at several spatial scales, using small lakes from islands in the subtropical Bahamian archipelago, western Atlantic (Fig. 1). Lakes without a history of direct human use, that is, those with relatively low suspected levels of human stress, at present or historically, are categorized as “pristine,” and those that have experienced or are currently experiencing stress are categorized as “stressed” (Table 1). We test for live–dead mismatch: (1) between paired pristine and stressed lakes that share similar physical characteristics; (2) between sets of pristine and stressed lakes within a single island; and (3) between three islands arrayed along a suspected stress gradient within the archipelago, inferred from differences in human population density and economic history. We also test the sensitivity of live–dead mismatch to analytical grain (patch size) by pooling sample-level data over increasing coarse spatial scales: point (no pooling, i.e., the living in a sample are compared with the dead in the same sample; 168 total determinations of live–dead mismatch), habitat (all samples within a single lake are aggregated before comparing living and dead; live–dead mismatch from 10 stressed and 11 pristine lakes), metacommunity (all samples pooled within an island; three island-level tests of live–dead mismatch in stressed versus pristine lakes), and regional (Bahamian archipelago; samples pooled from all stressed lakes compared with samples from all pristine lakes, producing a single estimate of the contrast in live–dead mismatch for the region).
Map of islands sampled within the Bahamian archipelago (left) and lakes sampled for living and dead ostracode assemblages on each island, with lakes coded for likely degree of human stress (right). On each island, three to four “stressed lakes” (black icons) subject to historical or current human activities were paired with physically similar “pristine” lakes (gray icons); icon shapes indicating pairings. Numbers inside icons represent lake-wide species richness, combining both living and death assemblages. See Table 1 for lake names and descriptions. Inset map modified from Yanes (Reference Yanes2012b); island maps from ESRI.

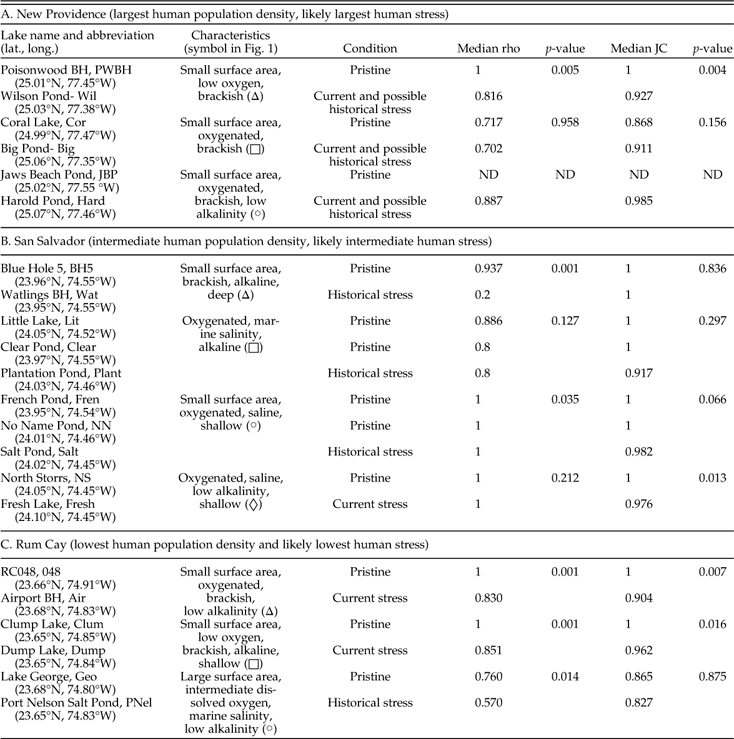
Median sample-level live–dead agreement from lakes on three islands, arrayed A–C on the basis of present-day human populations as a proxy for likely human stress, using the rank-abundance correlation of species in living and death assemblages (Spearman’s rho) and taxonomic similarity (presence–absence JC index). Each median is based on eight samples. Lakes on each island are paired based on shared limnological characteristics (surface area, oxygenation, salinity, alkalinity, and sampled depth) with medians compared using a Mann-Whitney U-test or Kruskal-Wallis test for the two cases on San Salvador where stressed lakes have two counterpart pristine lakes (p-values). ND, no data (no living or dead ostracodes in samples).

Materials and Methods
Study Area
We sampled paired lakes on three islands in the Commonwealth of The Bahamas (Fig. 1, Table 1). Each pair comprises a lake judged to be under some degree of stress from human activities, either currently or in the past (“stressed lake”), and a counterpart lake of otherwise similar abiotic conditions (e.g., salinity, alkalinity, dissolved oxygen, surface area, sampled depth range) that is judged to be in relatively natural, “pristine” condition owing to its distance from human settlements, agriculture, and polluting industry, either now or in the past. While none of these lakes are truly pristine—humans have occupied the archipelago for centuries—lakes coded as pristine are under much lower suspected stress now or in the colonial past (eighteenth to nineteenth centuries) than are stressed lakes.
Our categorization of lakes as stressed or pristine was not independently assessed in this study. We made this distinction based on clear signs of current impact, such as government warnings or active use, or historical impact, principally use in nineteenth-century plantations as indicated by remaining stone walls and structures, and consultation with local environmental authorities. While the limnological variables we directly measured in this study to identify pairs of similar lakes could certainly be affected by human use, none are directly reflective of degree of human use.
The three islands represent a gradient of suspected human stresses based largely on present-day human population density: high-stress New Providence (~1189 people/km2), intermediate-stress San Salvador (~6 people/km2), and low-stress Rum Cay (~1.3 people/km2) (Department of Statistics, Government of the Bahamas 2012). Historically, archeological and ethnographic evidence reveals ~1 Kyr of sparse occupation by the native Lucayan people across the archipelago before Spanish contact in 1492, which devastated native populations to near zero by 1520 (Farnsworth Reference Farnsworth1996). This was followed by British colonization and establishment of African slave–based plantations by the late 1700s (Farnsworth Reference Farnsworth1996). The agricultural export economy failed by the early 1800s from poor soils and the abolition of slavery, shifting land use to subsistence agriculture aside from salt and sisal production in the late nineteenth and early twentieth centuries (Neely Reference Neely2012). New Providence became a population and trading center by the late nineteenth century and has been the primary focus of Bahamian tourism and commerce through the twentieth and twenty-first centuries.
Sampled lakes are nonetheless diverse in the types and timing of human stress. On New Providence, we sampled three lakes that are currently experiencing human impact: Big Pond has been used as a dumping ground and Harold and Wilson Ponds have experienced light industrial use and agricultural pollution (Table 1A). On San Salvador, Watlings Blue Hole and Plantation Pond are presently isolated from direct human use, but were agricultural ponds in the late eighteenth and early nineteenth centuries; Salt Pond, another now-isolated body, was used to harvest salt in the late nineteenth to early twentieth centuries; and Fresh Lake is currently used as a dumping ground by local residents (Table 1B). On Rum Cay, Port Nelson Salt Pond was used to harvest salt in the late nineteenth to early twentieth centuries, Dump Lake is currently used for trash disposal, and Airport Blue Hole is near a relatively newly constructed (mid-twentieth century) and active airport (Table 1C).
Field Methods
To sample ostracode living communities and death assemblages, we swept a net (mesh size 2 mm) with an attached jar across the sediment–water interface, collecting 125 ml of the upper 1 cm of lake-bottom sediments from each of the 22 lakes. In each lake, we sampled along two transects oriented perpendicular to the shore and positioned 10 m apart, with four sites located 5 m, 10 m, 15 m, and 20 m from shore, for a total of 8 samples per lake (4 sites × 2 transects). All lakes on New Providence and Rum Cay and three stressed lakes on San Salvador (Plantation Pond, Salt Pond, Fresh Lake) were sampled in December 2013, and seven other lakes on San Salvador were sampled in March 2009 (previously reported on in Michelson and Park Reference Michelson and Park2013).
To differentiate living from dead individuals, sediments were inoculated with Rose Bengal at the time of sampling to stain the chitinous hinge joining the two valves bright pink (Corrège 1993). Only stained valves with visible appendages were counted as alive at the time of sampling to avoid false-positive assignment of valves from live-caught individuals. Samples were stored in plastic cups, wet sieved into >63 µm and >125 µm fractions, and air-dried. The >125 µm fraction was picked for ostracodes using a dissecting microscope. Only adult valves, identified by well-developed marginal canal pores and inner lamella, were analyzed to ensure that no individual would be double counted. Both articulated and disarticulated valves were counted as coming from individuals that were alive at the time of collection if they were visibly stained and had adhering soft tissue. We counted the total number of valves, whether disarticulated or still articulated, and so counts should be halved to estimate numbers of individuals. Specimens were identified to species level when possible, with higher taxonomic classification based on Brandão et al. (Reference Brandão, Angel, Karanovic, Perrier and Yasuhara2017) (Table 2). Specimens were identified to the species level for 99.6% of living and 99.2% of dead specimens, with the remainder identified to the genus level.
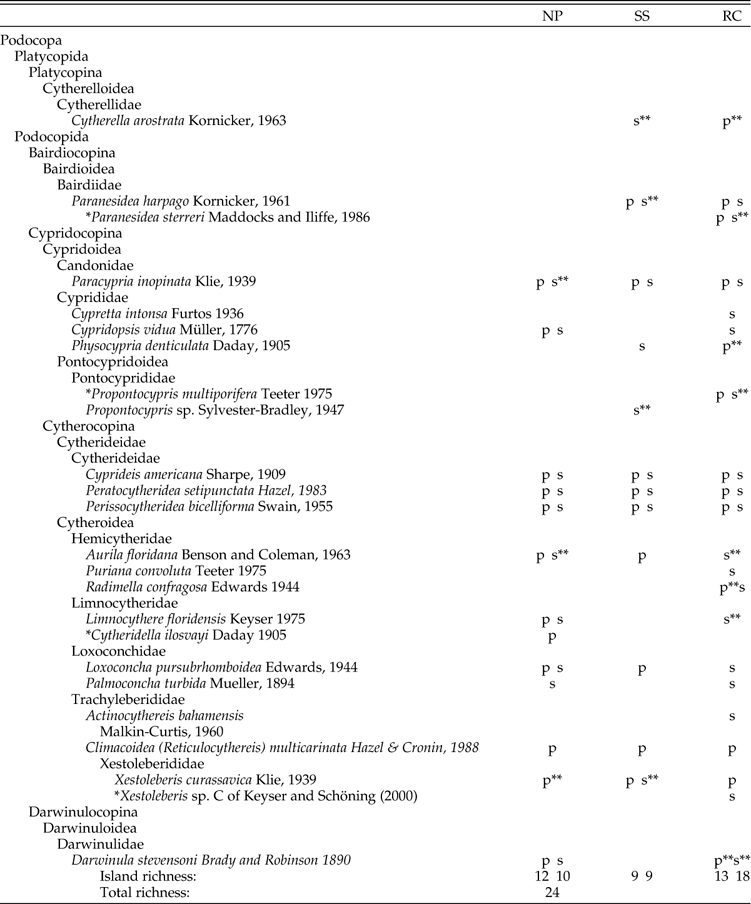
Ostracode species encountered in pristine (p) and stressed (s) lakes, organized by island and following the taxonomy of Brandão (Reference Brandão, Angel, Karanovic, Perrier and Yasuhara2017). Islands are arranged in descending order of human population size as a proxy for likely human impact: NP, New Providence; SS, San Salvador Island; RC, Rum Cay. *, Newly recorded from the Bahamas; **, sampled only in death assemblages. No species were sampled only in living communities.

To identify pairs of lakes that were physically similar other than with respect to human stress, we measured five limnological variables in the field: conductivity (perfectly correlated with salinity), dissolved oxygen, pH, alkalinity, and the range of water depths sampled. Only a subset of these variables were required to pair lakes (Table 1; for full data, see electronic supplement registered with Dryad). A YSI 556 multiparameter meter was used to measure conductivity (salinity), dissolved oxygen, and pH. Lakes ranged from 2.3 ppt to 84.7 ppt in salinity and were categorized as brackish if salinity was <32 ppt, marine if >32 ppt and <40 ppt, and saline if >40 ppt. Dissolved oxygen in lakes ranged from 2.5 to 8.2 mg/L. Lakes were classified as low oxygen if the concentration was ≤4.8 mg/L and fully oxygenated if >4.8 mg/L. pH ranged from 6.2 to 7.9, but was not useful in classifying lakes. A Hach methyl orange and phenolphthalein (total) acidity digital titration kit was used to measure alkalinity. Lake alkalinity ranged from 56 to 380 mg/L CaCO3 equivalent; we classified lakes as low alkalinity if alkalinity was <150 mg/L, and alkaline if >150 mg/L. Water depth at sampling sites was determined with a measuring tape and a measuring stick and ranged from 2 cm to 335 cm. We used the maximum measured depth to classify a lake as shallow (<40 cm) or deep (>300 cm). Lakes ranged in surface area from 3300 m2 to 2.5 km2. We classified lakes as small if <1 km2 and as large if ≥1 km2. All of these classifications reflect only the ranges sampled in this study and therefore cannot necessarily be used to classify lakes more broadly.
Live–Dead Comparison
Live–dead agreement—the similarity of the living community and its locally associated death assemblage—was measured several ways.
Richness (S) is the raw number of species present: living and dead individuals were extracted from the same sedimentary volume. Evenness is characterized using Hurlbert’s probability of interspecific encounter (PIE), which is relatively insensitive to differences in sample sizes (Olszewski and Kidwell Reference Olszewski and Kidwell2007; Chase and Knight Reference Chase and Knight2013). PIE ranges from 0, indicating a monospecific assemblage, to 1, indicating an assemblage in which the same number of specimens constitute each of n species. Live–dead differences in assemblage richness and evenness are expressed in the notation of ΔS and ΔPIE to facilitate tests of differences (delta=dead value minus live value, following Olszewski and Kidwell Reference Olszewski and Kidwell2007). Differences in median per-sample ΔS and ΔPIE between paired pristine and stressed lakes were tested with Mann-Whitney U-tests. Kruskal-Wallis tests were used for the two cases on San Salvador where a stressed lake has two physically similar pristine counterpart lakes.
To facilitate comparison with other studies using surficial sediments to test for the effects of human impacts, we focused on live–dead agreement in taxonomic composition (species’ presence–absence) and in the relative (ranked) abundances of species, following Kidwell (Reference Kidwell2007). The Jaccard-Chao (JC) index of taxonomic similarity is a sample size–corrected measure of the proportion of species shared by two lists that corrects for “unseen shared species” (Chao et al. Reference Chao, Chazdon, Colwell and Shen2005). This index is appropriate, because sediment samples, including ours, commonly yield larger numbers of dead shells than living individuals; death assemblages here contained a median of 113 valves, while live assemblages contained a median of 69 valves. The index ranges from 0 (no species shared by the living and death assemblages) to 1 (all species present both alive and dead). Spearman’s rank-correlation test (rho) assesses live–dead similarity in how species are ranked by abundance and ranges from +1 (the top-ranked, most numerically abundant species in the living assemblage is also top-ranked in the death assemblage, etc.) to −1 (species in one assemblage are ranked in exactly the opposite order to how they are ranked in the other assemblage). Both metrics were calculated using R with the ‘fossil’ package (Vavrek Reference Vavrek2011).
Differences in the median rho and median JC of samples from paired pristine and stressed lakes and of samples between sets of pristine and stressed lakes on different islands were tested for significance using a Mann-Whitney U-test. Kruskal-Wallis tests were used for the two cases on San Salvador where a stressed lake has two physically similar pristine counterpart lakes.
We used Kruskal-Wallis tests to evaluate differences in median agreement metrics across the three islands, based on present-day human population density: New Providence (highest density), San Salvador (intermediate density), and Rum Cay (lowest density). We analyzed this for pairs of islands both using stressed lakes and pristine lakes separately and using all lakes: Did the median JC and median rho increase (i.e., did live–dead agreement improve) with decreasing population density?
We also pooled samples at a series of nested spatial scales to determine the magnitude of effect of coarsening sampling grain on detecting differences between pristine and stressed environments. To contrast with (1) the sample-level (site-level) analyses, in which information on the composition of living and death assemblages and on live–dead agreement is based on the specimens from a single sampled site (most live–dead tests are conducted at this scale), we pooled (2) all samples within a pristine lake to compare with its stressed counterpart (lake-level resolution, equivalent to “habitat-level” resolution of data sets in the meta-analysis of Kidwell Reference Kidwell2007), (3) all samples from the set of pristine lakes on a specific island to compare with the set of stressed lakes on that same island (island- or metacommunity-level resolution, as in Michelson et al. Reference Michelson, Park and Pan2016), and (4) all samples from all pristine lakes across the three islands to compare with all stressed lakes (archipelago- or regional-level resolution; yielding a single estimate of live–dead agreement).
Temporal Resolution of Death Assemblages
The extent of time averaging, relevant to paleoecological interpretation, has not yet been measured directly for ostracode death assemblages in any setting and so must be inferred from other evidence. Sedimentation rates calculated from radiocarbon dating of terrestrial plant leaves in cores from Storrs Lake, San Salvador, one of our sampled lakes, indicates that the top 1 cm of the lakebed records the last 40 to 60 years (Park Reference Park2012). As an estimated duration of time averaging, this value assumes no vertical mixing of dead valves by bioturbation and other processes (processes that would increase the range of valve ages in a sample) and no postmortem loss before permanent burial (which would decrease time averaging). As a minimal estimate, Alin and Cohen (Reference Alin and Cohen2004) suggested that ostracode death assemblages from tropical Lake Tanganyika could represent as little as 1 year of time averaging, based on comparing their species richness to that accrued from monthly sampling of living populations over 1 year.
Amino acid racemization–based (AAR) dating of individual mollusk shells from tropical and subtropical lagoons might serve as useful analogues for ostracode assemblages in the absence of direct dating. Molluscan death assemblages from bioturbated muddy seabeds contain abundant shells less than a few decades old, but specimens up to several hundreds or thousands of years old can also be present in the upper few centimeters, and very young shells also occur down-core over tens of centimeters, indicating considerable upward and downward vertical mixing (Kosnik et al. Reference Kosnik, Hua, Kaufman and Wüst2009, Reference Kosnik, Hua, Kaufman and Zawadzki2015; Olszewski and Kaufman Reference Olszewski and Kaufman2015; and see Kidwell et al. Reference Kidwell, Best and Kaufman2005). In carbonate muds of the Great Barrier Reef, probably the best analogue, Kosnik et al. (Reference Kosnik, Hua, Kaufman and Zawadzki2015) estimated 20–50 years of time averaging for aragonitic bivalve shells from the surficial mixed layer (top ~20 cm; median shell size 8 mm; all >4mm) and 100–200 years per 5 cm increment downcore. They also found that a 210Pb-based age model of fine sediments in their core did not differ significantly from one based on AAR dating of the “coarse” bivalve fraction, suggesting no differential advection.
We thus suspect that although some lakes have low oxygen or high salinity, which probably reduces bioturbation, ostracode death assemblages from the upper 1 cm of sediment in Bahamian lakes are effectively time-averaged on multidecadal time frames, and probably include a substantial number of specimens dating to past centuries.
Results
Faunal Diversity
Sampling yielded 24 species across all three islands, with 7 species reported from the Bahamas for the first time (Table 2). Two species, Cytherella arostrata Kornicker, 1963 (cited in Brandão Reference Brandão, Angel, Karanovic, Perrier and Yasuhara2017) and Propontocypris sp. Sylvester-Bradley, Reference Sylvester-Bradley1947 (Table 2), were encountered exclusively as dead valves; all others were encountered both alive and dead somewhere within the study area. Where a species occurred alive, it almost always occurred dead in the same lake, if not the same sample.
One pristine lake, Jaws Beach Pond on New Providence, did not yield any ostracode valves, either living or dead, and was therefore excluded from pairwise analyses. This lake has the lowest salinity in our study, has low alkalinity, and on the day we sampled, had a thick algal cover. Of these factors, thick algal cover could limit benthic invertebrate biomass through low oxygen due to algal decomposition.
The total number of lakes in the live–dead analysis was therefore 21 (11 pristine and 10 stressed; Table 1). From these 21 lakes, living assemblages ranged in size from 1 to 630 individuals per sample (median 69, total 20,457 live-collected individuals in the study), and death assemblages contained 6 to 694 individuals per sample (median 113, total 30,051 specimens; see data deposited at Dryad).
Combining the species lists of living and death assemblages, species richness ranged from very low (1 species per sample, 2 species per lake) to quite high (12 species per sample, 15 per lake; Fig. 1). Pristine lakes have on average lower total richness than stressed lakes (median 4 vs. 6 species) and contain more low-richness samples having only one or two species (34%, 30 of 88 samples) than do stressed lakes (7.5%, 6 of 80 samples). Many (48%) of the low-richness samples are from saline lakes, both pristine and stressed, which are limited to San Salvador Island.
Live–Dead Differences in Richness and Evenness (Sample-Level Data)
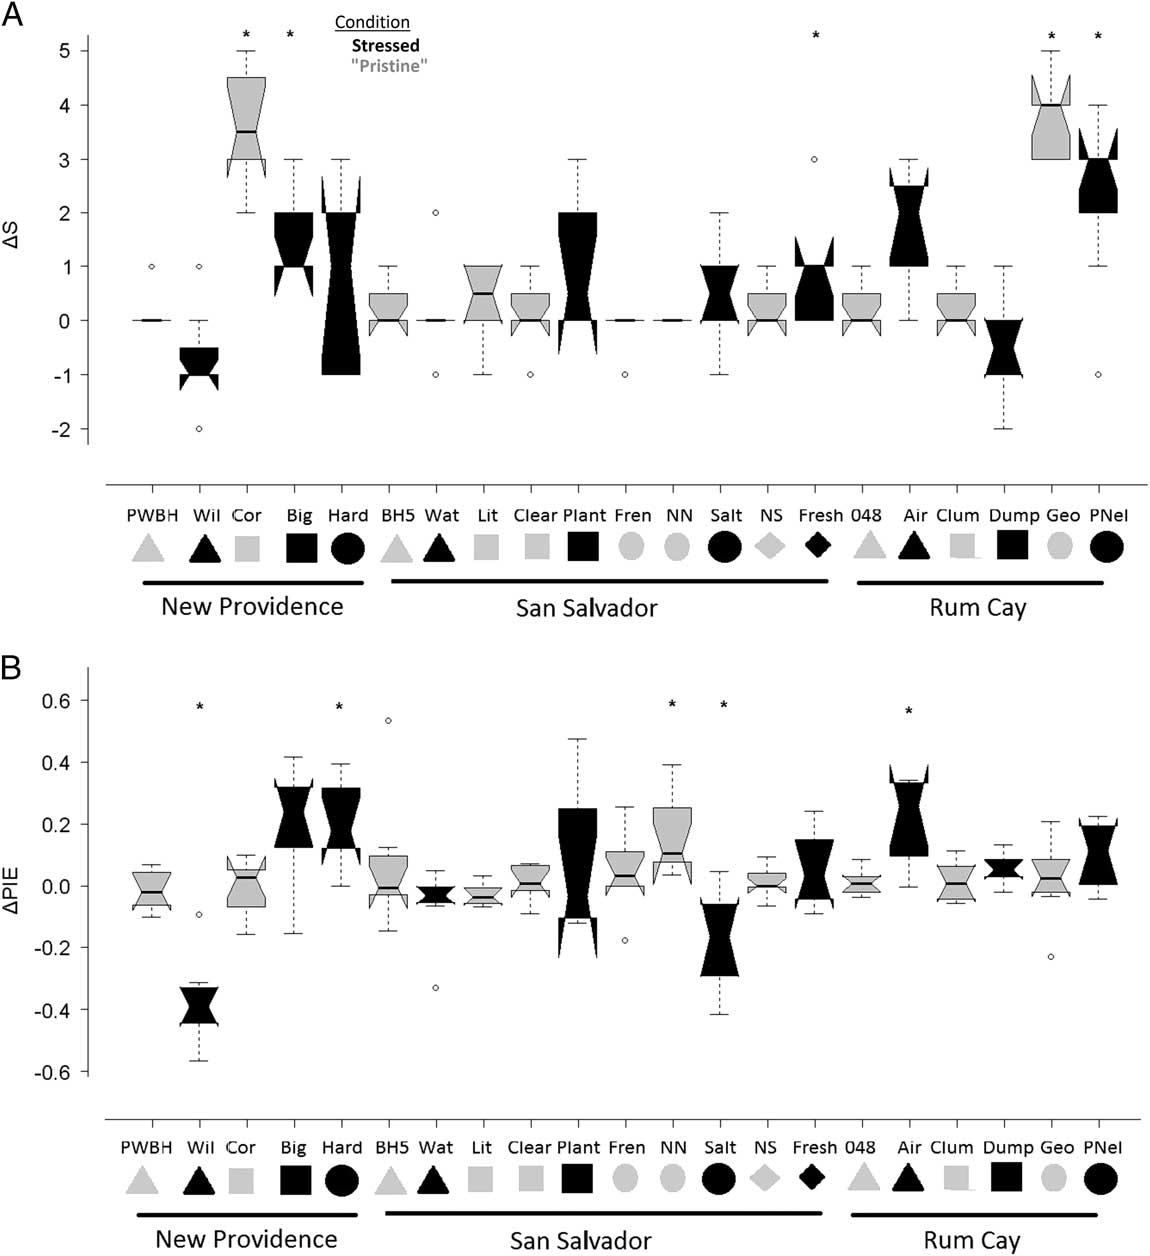
In all lakes, death assemblages generally yield as many or more species as do living assemblages from the same sediment sample, as expected from time averaging. The median ΔS (dead richness minus living richness) of samples is 0 or positive in all 11 pristine lakes and is significantly positive in 2 of them, and it is 0 or positive in 8 of 10 stressed lakes and significantly positive in 3 of them (Fig. 2A). The ΔS of samples from stressed lakes is, however, more variable than in pristine lakes. Three of 10 stressed lakes have significantly higher richness in dead assemblages than live assemblages (Fig. 2A).
Comparisons of two community attributes of living communities and their own associated death assemblages. Box plots representing distributions of within-lake differences between death and living assemblage (A) richness, ΔS (dead richness − live richness), and (B) evenness, ΔPIE (dead evenness − live evenness), are plotted. Notches represent 95% confidence intervals (CIs) about the median. Lakes are grouped by islands, which are arranged in descending order of suspected human stress: New Providence, San Salvador, Rum Cay. Physically similar “pristine” and stressed lakes are plotted next to each other; lakes are also labeled with abbreviations from Table 1 and symbols from Fig. 1; “pristine” lakes are gray and stressed lakes black. An asterisk (*) denotes a significant (p ≤ 0.05) difference in median richness or evenness between death assemblages and living communities as measured by a Mann-Whitney U-test. The living communities in 2 of 11 pristine lakes are significantly depauperate as compared with their counterpart death assemblages, and in only one lake is the living community reduced in evenness. Death assemblages in stressed lakes are significantly richer than living communities in 3 of 10 lakes (A), but significantly more even in as many lakes (2) as they are significantly less even (B). Death assemblages, representing a pre-impact ecosystem state, are often richer, but not necessarily more even than their counterpart living assemblages.

Stressed lakes also exhibit larger live–dead differences in assemblage evenness (ΔPIE) and greater variance among samples in ΔPIE than do pristine lakes (Fig. 2B). Six of 10 stressed lakes have a positive median ΔPIE, but only 2 of these stressed lakes have death assemblages significantly more even than live assemblages (Harold Pond on New Providence and Airport Blue Hole on Rum Cay). Median per-sample ΔPIE is significantly negative in 2 of the 10 stressed lakes. In pristine lakes, ΔPIE is positive in 7 of 11 lakes, as expected from time averaging, but is significantly nonzero (positive) in only 1 lake.
Live–Dead Differences in Taxonomic Similarity and Rank Abundances
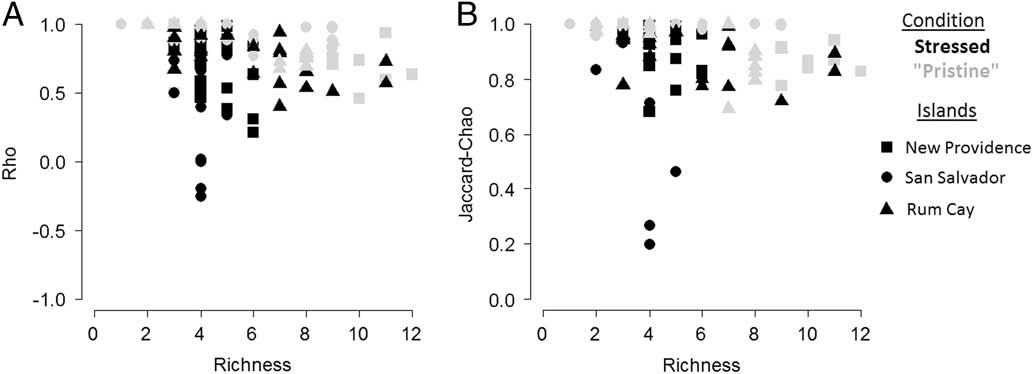
Scatter plots of sample-level live–dead agreement in taxonomic similarity (JC) and rank-correlation (rho), each plotted against the total (live + dead) richness of the sample, are useful for detecting variance unrelated to sample size (Fig. 3). Variance among samples in an agreement metric (here, JC or rho) should decrease with increasing sample size (here, sample richness), settling to a narrower range of values that will approximate a sample size–weighted (“meta-analytic”) average for the collection.
Variation in live–dead agreement in (A) species rank abundance (rho) and (B) taxonomic composition (JC) as a function of species richness, a proxy of sample size. Species richness here is the total number of species based on combining living and death assemblages.

The scatter plots in Figure 3 show that very small samples—that is, with only one to three species total, both those from saline and other lakes—do not show high variance. Instead, both JC and rho are consistently high at small sample richness. Among pristine lakes, the spread of values increases with higher sample richness (especially S ≥ 6 species), but some samples still exhibit “perfect” or nearly perfect live–dead agreement (JC or rho of 1) and even the lowest values of live–dead agreement are still quite high (JC mostly ≥ 0.8 and rho ≥ 0.5; gray icons in Fig. 3). Among stressed lakes, JC and rho values are variable even at sample richness of three or four species, albeit with a high density of samples having very high live–dead agreement, and then roughly “funnel” toward lower average values in high-richness samples, which are all notably <1 (black icons in Fig. 3). No stressed-lake sample richer than five species exhibits “perfect” live–dead agreement.
The scatters of both the pristine and stressed sets are inconsistent with simple sample-size effects: maximum variance should be observed among samples with smallest richness. Lake salinity is the strongest correlate of sample richness, but only samples from saline lakes are restricted to a single (low-richness) part of the richness spectrum: samples from brackish and marine lakes range across the entire spectrum. Removing saline lake samples does not alter the significance of differences in live–dead agreement between stressed and pristine sets on San Salvador (discussed later), where this lake type is restricted, and so the confounding of lake-salinity and sample-richness effects is ignored—all samples are retained in later analyses. If we recalculate medians after weighting samples by their richness (meta-analytic medians), the effects are indeed small. The sample richness–weighted median JC of pristine lakes is 0.95 (unweighted is 0.97) and the weighted median rho is 0.86 (unweighted 0.91); for stressed lakes, the weighted median JC is 0.89 (unweighted is 0.90) and the weighted median rho is 0.69 (unweighted 0.72).
Comparison of Paired Lakes on Islands (Sample-Level Data)
Within all lakes, no significant differences were observed either in median per-sample JC or in median rho between the two sampling transects, or with sample distance from shore. Both of these results are consistent with previous work using a small subset of seven San Salvador lakes reanalyzed here (Michelson and Park Reference Michelson and Park2013): the nearshore part of a lake constitutes a single, approximately homogeneous habitat. We therefore treat all eight samples from individual lakes as replicate draws from the same statistical population.
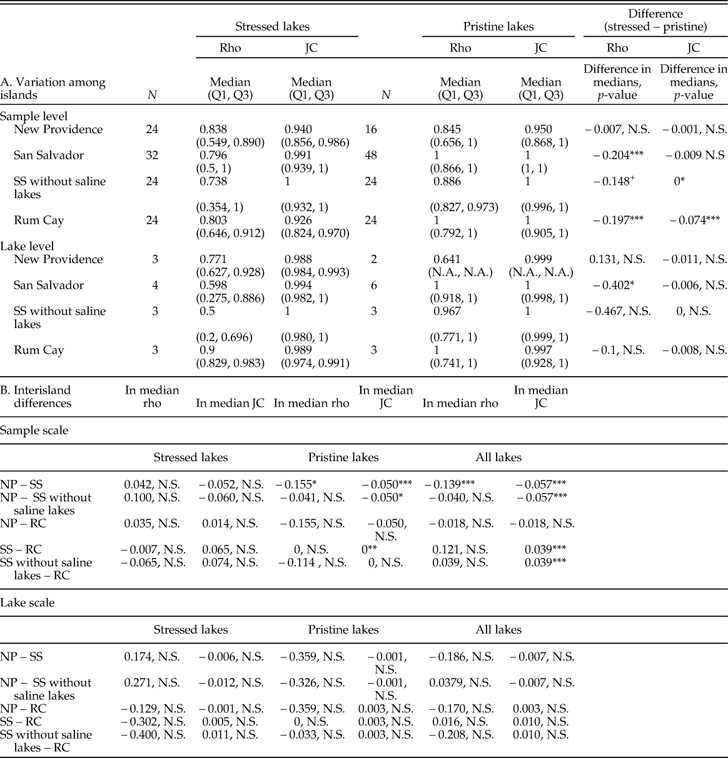
In all but one (eight of the nine) pairwise comparisons of taxonomic composition, the stressed lake had the same or a lower median live–dead taxonomic similarity (JC) than its pristine counterpart(s), and that median JC was significantly lower in five of the nine comparisons (p<0.05; Table 1). The only stressed lake with a higher median taxonomic agreement than its pristine counterpart is Big Pond on New Providence, but that difference is not significant (p=0.156; Table 1A). Variation in JC among stressed lakes was greater than among pristine lakes on New Providence and San Salvador, but not on Rum Cay (Fig. 4, Table 3A). Over the entire study area, the median live–dead taxonomic similarity of pristine lakes was 1 and that of stressed lakes was 0.96, a remarkably small difference that was nonetheless significant (p<0.001) given 168 samples (sample-level results in Table 4).
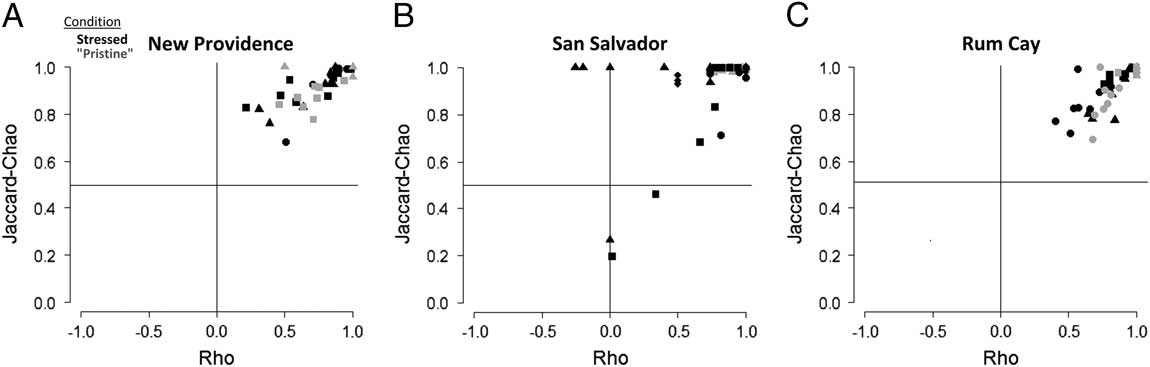
Live–dead agreement for all samples, coded by whether lake was stressed or pristine (8 samples per lake, between 5 and 10 lakes per island) and measured using taxonomic similarity (JC index) and rank-abundance correlation (Spearman’s rho). Owing to overlap of sample values, not all samples per island appear as distinct data points. Islands are arranged in descending order of suspected human stress: A, New Providence; B, San Salvador; C, Rum Cay. Icon shape denotes particular grouping of two to three similar lakes as listed in Table 1. On all islands, samples from pristine lakes display consistently high live–dead agreement in both measures, falling in the upper right corner of these cross-plots, whereas individual samples from stressed lakes vary in live–dead agreement, down to quite low taxonomic similarity, low rank-abundance agreement, or both.

A, Variation among islands in median live–dead agreement in stressed and pristine lakes using both sample-level data (as in previous analyses) and data pooled at the lake level; right column is significance of difference between stressed and pristine islands. San Salvador is described with both all lakes and with saline lakes removed. Saline lakes (limited to San Salvador) tend to have low species richness, so sample size is low for agreement metrics (rho and JC). B, Interisland differences in medians with Bonferroni-corrected significance. Live–dead agreement measured using Spearman’s rank-correlation (rho) and JC taxonomic similarity. Island are arrayed based on current human population as a proxy for likely human stress: New Providence (NP) is the most populous island, San Salvador (SS) intermediate, and Rum Cay (RC) least populous, and so interisland differences are expected to be negative. N=number of comparisons of live–dead agreement; Q3=75th percentile, Q1=25th percentile; N.A., not applicable. ***p<0.001; **p<0.01; *p<0.05; + p<0.06; N.S., not significant.

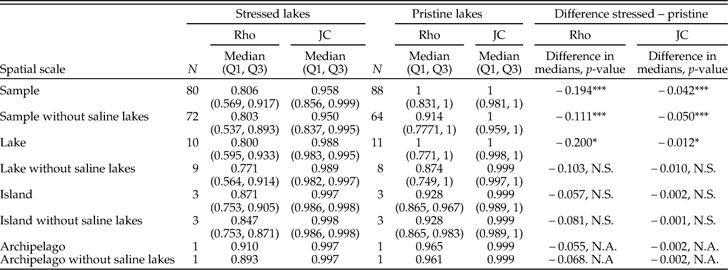
Median live–dead agreement in species rank abundance (Spearman’s rho) and taxonomic composition (JC) in stressed and pristine lakes across the archipelago at four spatial scales of data pooling, and significance of differences using the Mann-Whitney U-test. San Salvador was analyzed with all lakes and without saline lakes that tend to have low species richness, so sample size is low for agreement metrics rho and JC. ***p<0.001; **p<0.01; *p<0.05; N.S., not significant. N=number of comparisons of live–dead agreement; Q3=75th percentile, Q1=25th percentile, N.A., not applicable.

In all nine pairwise comparisons of species rank abundances, the stressed lake had a median live–dead rank-abundance correlation (rho) agreement the same as or lower than its pristine counterpart(s), and that median agreement was significantly lower in six of nine comparisons (Table 1). In the one case where median rank-abundance agreement of samples from the stressed lake (Salt Pond from San Salvador, saline) was equal to that of counterpart pristine lakes, the minimum rho observed among samples in the stressed lake was lower than that in counterpart lakes. These pristine counterpart lakes had uniformly “perfect” rho—all samples in both No Name and French Ponds yielded a rho of 1, while Salt Pond had 3/8 samples <1, resulting in a significant difference in the Kruskal-Wallis test, despite equal medians (Fig. 4B; Table 1B). Variation in rho was greater in stressed lakes than in pristine lakes on all islands (Fig. 4, Table 4A). Over the entire study area, the median live–dead rho of pristine lakes was 1 and that of stressed lakes was 0.8, a significant difference (sample-level results in Table 4).
On a cross-plot of JC index and Spearman’s rho, all samples from pristine lakes fall in the upper right quadrat (JC>0.5, rho>0), displaying high live–dead agreement in both taxonomic similarity and rank abundance (gray icons in Fig. 4); in fact, almost all pristine samples exhibit very high live–dead agreement, with JC ≥ 0.75 and rho ≥ 0.5. In contrast, samples from stressed lakes exhibit greater variance in both agreement metrics (black icons in Fig. 4), although only a few plot outside the upper right quadrat. These samples with <50% shared species and/or 0 to negative rank-abundance correlations are from two historically stressed lakes on San Salvador (Plantation Pond and Watlings Blue Hole) (Fig. 4B). Other samples from stressed lakes on San Salvador and stressed lakes on New Providence and Rum Cay plot within the upper right quadrat, but lower on both metrics than do pristine lakes there (Fig. 4A,C). The only exception is historically stressed Port Nelson Salt Pond on Rum Cay, which has a median taxonomic agreement that is not significantly different from its counterpart pristine lake, Lake George (Table 1C). However, almost all Port Nelson Salt Pond samples yield lower rho values than found for Lake George, producing significantly lower rank-abundance agreement (Fig. 4C, Table 1C).
Comparisons among Islands along a Gradient in Population Density (Sample-Level Data)
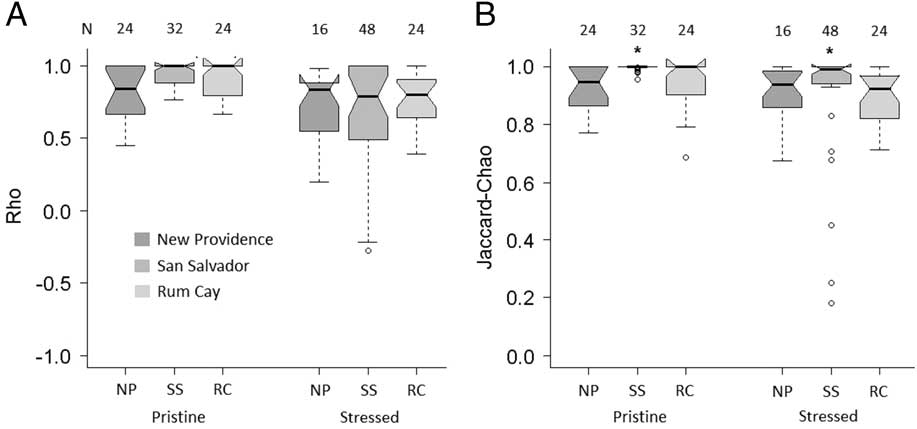
Considering only stressed lakes, live–dead agreement does not decline consistently with increasing human population (from Rum Cay to San Salvador to New Providence), and none of the interisland differences are significant (sample-level data in Table 3B). San Salvador, with intermediate population, has the lowest median per-sample rho values, and Rum Cay, the least populous, has the lowest JC values (sample-level data in Table 3A). Live–dead agreement in pristine lakes is more consistent with a human population effect: all differences are negative (i.e., the more populous island in every comparison has the lower median agreement), and several differences are significant (sample-level data in Table 3B). In contrast, focusing on stressed lakes, neither metric is significantly lower on the more populous island (sample-level data in Table 3B). If saline lakes are excluded from interisland comparisons (they occur only on San Salvador and sample size [richness] is always low, ≤3 species), then the median and minimum per-sample values of JC and rho decrease, but the interisland contrasts are basically unaffected (reduced slightly; Table 3A,B).
Interisland differences in live–dead agreement using all lakes are similarly mixed—the effect observed among pristine lakes does not overcome the mixed results for stressed lakes. New Providence has poorer live–dead agreement than San Salvador and Rum Cay, as predicted, but San Salvador (intermediate population) is not poorer than Rum Cay (Table 3B, far right). More of the interisland differences in median JC are significant than are differences in median rho. These results are unaffected by excluding saline lakes from the comparisons.
For both JC and rho measures and on all three islands, intersample variation in live–dead agreement tends to be greater in stressed lakes than in pristine lakes (Fig. 5, and examine Q1–Q3 spreads in Table 3A). That is, the lower median values returned by stressed lakes arise from high variation among samples in live–dead agreement, not from all samples in a stressed lake yielding lower live–dead agreement.
Box plots of sample-level live–dead agreement across both metrics (A, rho; B, JC) by island. NP, New Providence; RC, Rum Cay; SS, San Salvador. Notches represent 95% CIs about the median; numbers above bars indicate number of samples; asterisk (*) denotes islands with significantly different median live–dead agreement as indicated by Bonferroni-corrected Kruskal-Wallis tests (Table 3B). Stressed lakes have uniformly lower median agreement metrics than pristine lakes on each island, but median agreement does not improve with decreasing human population density: all three islands have nearly equal median rho, and both pristine and stressed lakes on San Salvador (intermediate human population density) have significantly higher median JC than do lakes on the other two islands.

Considering data from the entire archipelago, the differences between stressed and pristine lakes in median JC and median rho values are strongly significant (p<0.001) when data are analyzed with sample-level resolution (Table 4). This result reflects both the large numbers of samples per category (pristine and stressed medians are based on 88 and 80 measurements, respectively) and the magnitude of the differences (difference in median JC is −0.07 and in median rho is −0.20).
Effects of Pooling Data on Living and Death Assemblages (Coarsening of Analytic Grain)
When sample-level data within a lake are combined to yield a single, habitat-level value of live–dead agreement for that lake, differences between paired pristine and stressed lakes on each island are reduced and mostly insignificant (lake-scale data in Table 3A). Species that may be absent from the living (or death) assemblage in one sample in a lake may appear alive (or dead) in another sample from the same lake, thus increasing live–dead agreement as samples are pooled. With such pooling, live–dead agreement in stressed lakes increases more strongly than in pristine lakes, indicating higher between-sample differences in species composition in stressed than in pristine lakes, and JC increases more strongly with pooling than does rho (live–dead discrepancy in the presence–absence of a species can altered by a single specimen).
Lake-level pooling of data also damps interisland differences among stressed lakes, among pristine lakes, and among all lakes (Table 3B). Stressed lakes continue to have lower live–dead agreement than pristine lakes, but the differences between stressed and pristine lakes remain significant only on San Salvador and, even there, only for live–dead agreement as measured by Spearman’s rho. Finally, considering the entire archipelago, the differences in the medians of the 10 stressed lakes and the 11 pristine lakes are less strong but still significant (p<0.05, right column in Table 4).
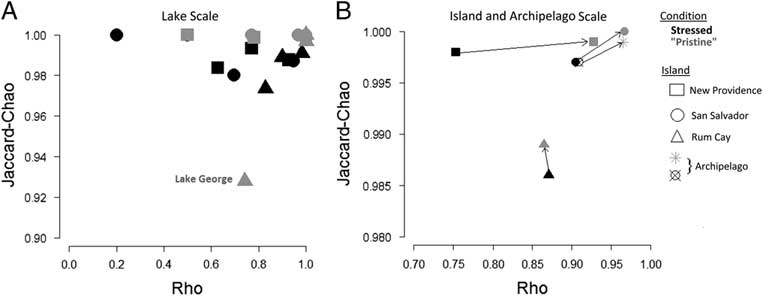
The higher live–dead agreement produced from lake-level data pooling is evident graphically by comparing the scatter plots of Figure 4 (sample-level data) and Figure 6A (lake-level live–dead agreement); note change in scales of JC and rho axes. At lake-scale pooling of data, variation in JC is minimal (ranges only from ~0.93 to 1, including the high-richness Lake George), and variation in rho is reduced compared with sample-level differences but is still substantial (rho ranges from 0.2 to 1).
Live–dead agreement pooled at (A) lake and (B) island and archipelago scales. Agreement is much higher at these coarser spatial scales (note difference in scales of rho and JC axes in both A and B compared with Fig. 3). With pooling, live–dead agreement continues to be lower in stressed lakes than in pristine lakes, but the magnitude of difference contracts, especially for taxonomic composition (JC index). Lake George on Rum Cay is diverse, but three species out of the total 11 species were encountered only as dead individuals.

When data from samples are pooled to the island level, differences in the medians of the three island-level sets of stressed lakes and the three island-level sets of pristine lakes retain their polarity—poorer in stressed than in pristine lakes—but the differences are insignificant for both measures (Table 4): data points shift even farther into the upper-right corner of the cross-plot of JC and rho (Fig. 6B). Live–dead agreement—mismatch—in rank-abundance rho is more robust to this scale of pooling than is taxonomic similarity, although the lowest rho is now ~0.75 (for stressed lakes on New Providence); even the lowest JC similarities are very high (>0.985; Fig. 6B). The contrast between stressed and pristine lakes—illustrated by the distance separating paired data points for islands (Fig. 6B)—is greatest on New Providence, intermediate on San Salvador, and lowest on Rum Cay, concordant with the hypothesized stress gradient among islands in the Archipelago, but only on New Providence would the contrast be detectable.
Finally, when sample-level data from the entire archipelago are pooled, producing a single, spatially very coarse estimate of live–dead agreement in stressed and in pristine lakes, the difference between these categories becomes indistinguishable (Table 4; asterisk in Fig. 6B). The polarity of the difference persists, concordant with analyses at finer spatial scales, but the absolute difference in JC is a meaningless −0.002, and the difference in rho is −0.055. Eliminating saline lakes when pooling data does not change these results (Table 4).
Discussion
We find that ostracodes in Bahamian stressed lakes display lower live–dead agreement in taxonomic similarity and species’ ranked abundances than do physically similar lakes with no current or known past human stressors (“pristine lakes”). Death assemblages from stressed lakes also tend to be more speciose and more even than co-occurring living assemblages. Such diversity differences are expected from time averaging alone (Olszewski and Kidwell Reference Olszewski and Kidwell2007; Tomašových and Kidwell Reference Tomašových and Kidwell2010). However, although ΔS and ΔPIE vary considerably among stressed lakes, positive values are larger and more common in stressed than in pristine lakes, consistent with the depauperate living communities observed there.
This live–dead disagreement emerges at several nested levels—between paired lakes on a single island, between sets of stressed and pristine lakes on individual islands, and between such sets along a gradient of stress across the archipelago, although not all differences are significant (Tables 1, 3, Figs. 4, 6). Differences also persist through pooling of data to the lake (habitat), island (meta-community), and archipelago (regional) scales of spatial resolution, but the magnitude attenuates with coarser scales, especially for taxonomic composition, and loses quantitative certainty (Table 4, Fig. 6).
Causes of Live–Dead Mismatch
Differences between living communities and associated death assemblages may arise from multiple sources that are not mutually exclusive and can be treated as hypotheses: (1) small sample sizes and species-specific collection bias, (2) contamination or other unnatural modification of the death assemblage, (3) natural time averaging of the death assemblage (temporal coarsening of data compared with surveys of living populations), (4) natural taphonomic bias of death-assemblage composition (differential preservation of species), and (5) a directional shift in the composition of the living assemblage within the window of time averaging, driven by natural processes and/or human activities (Kidwell Reference Kidwell2013). We have no reason to suspect any human activities that would have introduced or selectively removed dead ostracodes from one lake to another (hypothesis 2), and so consider only the other hypotheses.
Sample Size
Although one lake failed to yield ostracode valves (Jaws Beach Pond on New Providence), the number of valves recovered in the vast majority of samples was sufficient to estimate live–dead agreement. Only a few of the 168 samples yielded <20 living or dead valves (13 living assemblages, 2 death assemblages). The scatter plots in Figure 3 show that many samples nonetheless had small total (live + dead) richness (≤3 species), which can be problematic for our taxonomic similarity measure that corrects for unseen species (JC) and for rank-correlation coefficients (at such low richness, rho is limited to few values other than +1, 0, and −1). However, Figure 3 shows consistently high values of rho and JC, rather than the high among-sample variance that would be expected at low richness. High variance appears only at richness ≥4 species, suggesting a cause other than sample size for low rho and JC values in stressed lakes.
One likely explanation for the large number of low-richness samples having high JC and rho is that approximately half of these samples are from saline lakes. This stressed physical condition usually limits ostracode community composition to a few species, regardless of the number of specimens counted; in Bahamian lakes, these species have especially broad niches, occurring in lakes of other salinities (Michelson et al. Reference Michelson, Park and Pan2016). Among samples having total richness ≥4, JC and rho values show both greater variance and, as richness increases, the expected narrowing (funneling) of variance (Fig. 3) consistent with an absence of sample-size effects. Pristine lakes yield very high live–dead agreement values even at relatively high richness, whereas stressed lakes do not, which also shows that sample size does not control either set. We thus conclude that the unexpected concentration of high live–dead agreement values among low-richness samples in the Figure 3 scatter plots is a first-order effect of the dominance of physically stressed, saline lakes in that subset.
We thus reject sample size (sample richness) per se as a significant control on live–dead agreement, and it is certainly absent among samples having richness ≥4 species, where stressed and pristine lakes diverge in median JC and rho values. A trial removal of low-richness saline lakes from analyses did not affect results significantly.
Time Averaging
Modeling and empirical studies indicate that the natural, in situ accumulation of multiple generations of dead and discarded remains into a single death assemblage tends to increase richness, the proportion of rare species, and evenness, and only rarely shifts the centroid of assemblage composition significantly away from that of the living assemblage (Tomašových and Kidwell Reference Tomašových and Kidwell2010, Reference Tomašových and Kidwell2011; Kidwell and Tomašových Reference Kidwell and Tomašových2013). Bahamian ostracode death assemblages from pristine lakes are, on average, richer and more even than the local living assemblages (Fig. 2) and have remarkably high taxonomic and relative-abundance agreement with co-occurring living communities, falling in the upper quarter of the upper quadrat of a cross-plot of JC and rho (Fig. 4); these small-scale differences can be attributable to time averaging alone. Samples from stressed lakes tend to have stronger live–dead differences in richness and more widely scattered JC and rho values, requiring the operation of other factors.
These results of high live–dead agreement in pristine lakes strongly support the value of death assemblages for modern-day and paleolimnological biodiversity assessments, extending Michelson and Park’s (Reference Michelson and Park2013) results from lakes on San Salvador. The live–dead mismatch documented here in stressed lakes also supports the application of ostracodes as environmental proxies for sediment cores (Yasuhara et al. Reference Yasuhara, Yamazaki, Tsujimoto and Hirose2007, Reference Yasuhara, Hunt, Breitburg, Tsujimoto and Katsuki2012; Smol Reference Smol2008; Zeppilli et al. Reference Zeppilli, Sarrazin, Leduc, Arbizu, Fontaneto, Fontanier, Gooday, Kristensen, Ivanenko, Sørensen and Vanreusel2015; Michelson and Park Boush Reference Michelson and Park Boush2017). Live–dead discordance indicates that living assemblages have shifted in response to environmental changes caused by humans, and such changes would be preserved as inflection points in sedimentary archives.
Taphonomic Bias
Postmortem alteration of assemblage composition sufficient to mislead biological interpretation—that is, bias arising from interspecies differences in lifespan, postmortem durability, and/or out-of-habitat transport—is unlikely to play an important role here, and there is no reason to suspect that it would be more important in stressed lakes than in pristine counterparts. Assemblage composition and live–dead agreement did not vary with distance from shore within any of the lakes, suggesting either a lack of significant postmortem transport (see also Michelson and Park Reference Michelson and Park2013) or homogeneous spatial mixing over this scale (the two sampling transects bound an area of 150 m2 and span <3.5 m in water depth, usually <1 m). Interspecies differences in postmortem transport of valves are also unlikely to bias samples in principle: the ostracode valves sampled in lakes across all three islands are of similar body sizes. Alin and Cohen (Reference Alin and Cohen2004) documented spatial mixing in tropical lacustrine ostracodes, but sampled rocky and sandy substrata were separated by only a few meters, and so transport distances were still modest. The separation is comparable among our samples, which are drawn from less physically disparate carbonate mud and sand bottoms.
Interspecies differences in preservation are also likely minimal in our data. Species do differ somewhat in valve thickness and degree of calcification, but the most fragile species occur dead-only rather than live-only (i.e., the thinly calcified Paracypria inopinata and Darwinula stevensoni; Table 2), contrary to a preservational bias.
Shift in Community Composition
Modification of community composition within the window of time averaging is the most likely cause for the stronger live–dead discordance observed in samples from stressed lakes, a conclusion reached largely by elimination of alternative explanations. In molluscan live–dead analyses, the ecological tolerances and life histories of species are generally well known, and so the taxonomic identity of the species creating live–dead discordance—that is, the species that occur dead-only, live-only, or that are otherwise ranked very differently in the living and death assemblages—provides insights into the biological significance of live–dead discordance and thus likely drivers of the shift in community composition (Kidwell Reference Kidwell2007, Reference Kidwell2013). The ecological preferences of tropical lacustrine ostracodes are, in contrast, poorly known.
The present analysis has nonetheless identified seven species—Paranesidea harpago, Paranesidea sterreri, Paracypria inopinata, Propontocypris multiporifera, Propontocypris sp., Aurila floridana (two islands), and Limnocythere floridensis (Table 2)—that occur dead-only exclusively in stressed lakes on at least one island. Four of these species (Pa. inopinata, Pr. multiporifera, A. floridana, L. floridensis) occur dead-only in a currently stressed lake and can therefore be considered “canaries” of environmental deterioration. When alive, they may be considered indicator species for pristine habitats. The other three dead-only species occur dead-only in historically stressed lakes in which human impact has lessened: Salt Pond in the case of Pa. harpago, Port Nelson Salt Pond for Pa. sterreri, and Plantation Pond for Propontocypris sp. If the death assemblages in these historically stressed lakes include taxa from stressed conditions due to a long tail of old valves—shell-age dating would permit us to test this—then these three species may be pollution tolerant. An additional three taxa in the regional species list (C. arostrata, Xestoleberis curassavica, D. stevensoni) occur dead-only in both stressed lakes and some pristine lakes, suggesting more general limits, such as stronger seasonality in populations. Live–dead analysis of the fauna thus identifies both lakes and taxa deserving of closer examination, even in the absence of independent biological information. This study thus shows that environmental data complementary to surveys of living individuals can be gleaned from study of dead remains.
Association of Live–Dead Mismatch with Human Stress and Stress Alleviation
Stressed lakes in our study have been subject to a wide range of human activities with potential to change environmental conditions, with some limited to the past and some only in the present day. These stresses range from clear-cut agricultural plantations during the 1780s to 1820s (cotton) and 1880s to 1910s (sisal) on San Salvador and New Providence, to early twentieth century salt harvesting on San Salvador and Rum Cay, nutrient and heavy metal pollution and high resident and tourist populations since the late nineteenth century on New Providence, and modern dumping of refuse on San Salvador and Rum Cay (Farnsworth Reference Farnsworth1996; Neely Reference Neely2012).
On New Providence, all lakes scored as stressed are under current suspected stress from agriculture, light industry, and proximity to Nassau, which is the capital of the Bahamas and its largest city. None of the sampled lakes were proximal to historical plantations to our knowledge, but such stress is possible; hence our categorizing them as “current and possible historical stress” (Table 1). One of the three stressed lakes with high variability in live–dead agreement, Big Pond, is posted against fishing, swimming, or other human use, indicating particular concern with water quality. Both Big Pond and its pristine counterpart Coral Lake have similarly low median agreement metrics (<1; Table 1), suggesting that we underestimated human impacts on Coral Lake, which is near a suburban housing development and has a history of light recreational use. The other two stressed lakes (Harold and Wilson Ponds) are within a small national park that has a history of industrial and agricultural pollution; stress has lessened, but apparently not entirely abated after coming under park protection (Bahamian National Trust, personal communication). Thus, live–dead mismatch in these stressed lakes probably arises from a recent shift in living assemblages in response to stressed conditions, which existed within the window of death-assemblage time averaging.
On San Salvador, two of the three stressed lakes with high variability in live–dead agreement are not currently near any settlements or human activities but were parts of agricultural plantations in colonial times (late eighteenth to early nineteenth century; Watlings Blue Hole) or were postcolonial saltworks (late nineteenth to early twentieth century; Salt Pond). One explanation for live–dead mismatch in lakes with historic but no current stress is that the death assemblages include species that thrived under formerly stressed conditions, whereas the living assemblages reflect now-ameliorated conditions: environmental conditions have been improving within the window of time averaging, owing to abandonment of plantations and saltworks. If dead-only species (and others that are disproportionately abundantly dead) indicate stressed conditions, then live–dead mismatch signals ecological recovery.
A second, alternative explanation of live–dead mismatch in stressed San Salvador lakes is that the dead-only species are relicts of pristine conditions before the onset of stress: that is, live–dead mismatch exists in surficial sediments because such taxa have not yet reappeared or reattained their original abundance in living assemblages. Human stress on these lakes is many decades to ~100 years in the past, and so the persistence of live–dead mismatch would be remarkable. Nonetheless, all four species that occur dead-only in historically stressed lakes on San Salvador (and Rum Cay) are present as living populations (and dead shells) in a pristine lake on the same or another island, suggesting that they are canaries rather than stress-tolerant species and that their absence alive in the historically stressed lake is not the result of limits on dispersal, but rather of recalcitrant recolonization. We thus suggest that live–dead mismatch in historically stressed lakes could signal some unsuspected and prolonged legacy condition(s) in the lakebed or watershed that disallow successful occupancy by species that characterize pristine lakes of the same type elsewhere on the island. Shell age dating and/or new biological insights into species tolerances would permit discrimination of these two alternative, indeed opposing scenarios—advanced recovery versus incomplete, long-delayed recovery. Human-induced loss and century-scale recalcitrant recovery of shelly macrobenthos has been documented in coastal ocean systems using such an approach (Tomašových and Kidwell Reference Tomašových and Kidwell2017).
The third San Salvador lake with high variability in live–dead agreement, Fresh Lake, is currently used as a dumping ground, and so its living community is likely shifted in response to this recent human activity, but the live–dead mismatch is very small (Table 1). Finally, we classified Plantation Pond as historically stressed because it was on a late eighteenth to early nineteenth century plantation, like Watlings Blue Hole, but it failed to yield lower live–dead metrics than its counterpart pristine lakes (Clear and Little Lakes). Those pristine lakes have relatively high live–dead agreement and no known substantial history of human use. Plantation Pond thus apparently (1) was unperturbed by plantation activities, that is, human stress was insufficient to shift community composition from its prestress baseline; or (2) has such high sedimentation rates and/or low bioadvection that surface death assemblages do not retain specimens from colonial-era stressed conditions. Sediment cores would be necessary to distinguish these hypotheses.
Finally, diverse conditions exist on Rum Cay. One of the three stressed lakes with high variability in live–dead agreement is a community dump where trash of all types is burned (Dump Lake). Death assemblages here apparently record the predump community state, like Fresh Lake on San Salvador. Similarly, another stressed lake on Rum Cay yielding variable sample-level live–dead agreement—Airport Blue Hole—is near a recently constructed runway; its living community is likely shifted, while its death-assemblage records the prerunway state. The final stressed lake with high sample-level live–dead variability on Rum Cay is not associated with any human activities today (Port Nelson Salt Pond), but was the site of postcolonial saltworks like Salt Pond on San Salvador. Low average live–dead agreement probably reflects recovery of the living community from a formerly more degraded state, which the death-assemblage records, or recalcitrance recovery, that is, the same alternative scenarios proposed for Salt Pond and Watlings Blue Hole on San Salvador.
Comparisons of lakes on the three islands thus reveal that live–dead mismatches are associated with lakes subject to human activities, as has been well documented in the case of subtidal mollusks (Kidwell Reference Kidwell2007, Reference Kidwell2013; Yanes Reference Yanes2012a; Chiba and Sato Reference Chiba and Sato2013; Korpanty and Kelley Reference Korpanty and Kelley2014). Although not every sample in these stressed lakes exhibits poor live–dead agreement in ostracode assemblages—intersample variation in live–dead agreement is typical—the median agreement within such lakes is consistently lower than in counterpart pristine lakes, where live–dead agreement is consistently excellent (Table 1, Fig. 4). Live–dead mismatch in lakes subject to current stress—mostly dumping (e.g., Fresh Lake on San Salvador, Airport Blue Hole and Dump Lake on Rum Cay)—is relatively small. In contrast, live–dead mismatch in Bahamian lakes subject to “historical” stress—they are presently isolated or largely protected from human activities—arises either from the alleviation of stress, that is, from conditions that are now improved over those in the past, or, alternatively, from long-delayed recovery of original pristine conditions. Differentiating these hypotheses requires shell age dating of some type to establish the cultural ages of key species (i.e., those occurring far more abundantly dead than alive or occurring dead-only). Because of the long tail of very old shells that may be present, death assemblages in these historically stressed lakes could incorporate specimens from 100 or more years ago, and so in principle either scenario is possible. Additionally, independent assessment of the magnitude of human impact in these lakes would be needed to identify species particularly sensitive to human impact or identify community changes caused by different effects: How does nutrient pollution affect the ostracode community differently than heavy metal pollution, for example? Sediment cores showing biological and geochemical variation will be helpful in this regard, although independent assessment of limnological changes driven by human impact in these lakes could prove more valuable.
At a regional scale, and contrary to expectation, live–dead analysis does not detect a clear, monotonic gradient of live–dead mismatch in stressed lakes along the present-day gradient in human populations, contrary to our motivating hypothesis (Table 3B, Fig. 5). Variation in live–dead agreement across the archipelago is apparently not a signal of the magnitude of a single stressor (present-day population), but rather arises from a range of current and legacy effects. Live–dead discordance is, instead, a signal of ecological change within individual habitats (lakes): stressors on lakes are too variable in nature and timing for a clear trend at the regional scale. Low live–dead agreement—specifically, high intersample variation in agreement—should thus be regarded as a valuable qualitative indicator of within-habitat human impact rather than as a proxy for the magnitude of human effects, at least on landscapes with such a mosaic of high- and low-intensity stress on varied time scales.
Biological, Taphonomic, and Management Implications of Live–Dead Mismatch
Pooling sample-level living and dead occurrences to lake, island, and archipelago scale diminished but did not eliminate differences in median live–dead agreement between pristine and stressed environments: at all grains, stressed environments had lower live–dead agreement than their pristine counterparts. However, differences that were significant for resolution at the sample (point) and lake (habitat) level became insignificant as data were pooled at coarser scales (island/metacommunity and archipelago/regional levels; Table 4, Fig. 6).
The variation in live–dead agreement among samples in stressed lakes has several implications. First, environmental assessment using live–dead mismatch requires sampling at multiple stations: low median live–dead agreement manifests as high intersample variability in agreement, not as consistently low agreement. This variability is not unique to lacustrine ostracodes, but rather is common to many tests of live–dead mismatch at the sample level in altered systems (e.g., Yanes Reference Yanes2012a; Chiba and Sato Reference Chiba and Sato2013; Korpanty and Kelley Reference Korpanty and Kelley2014; Albano et al. Reference Albano, Filippova, Steger, Kaufman, Tomašových, Stachowitsch and Zuschin2016). This intersample variability mirrors high variability among molluscan habitat-scale data sets from human-stressed settings (meta-analysis of Kidwell Reference Kidwell2007).
Second, our analysis shows that, as expected, high variability at the sample level was reduced by spatial pooling to the habitat level, often collapsing live–dead mismatch to values in stressed lakes that overlap or closely approximate those from pristine lakes (i.e., they have very high taxonomic and rank-abundance agreement, placing them high within the upper right quadrat of a cross-plot such as Fig. 6; see comparable effects of spatial pooling in Weber and Zuschin [Reference Weber and Zuschin2013] and Kidwell and Tomašových [Reference Kidwell and Tomašových2013]). Habitat-level data sets with lower JC values and rho values than these thus signal the most concern, ecologically and environmentally (each island has several lakes with quite low habitat-level rho; Fig. 6). In molluscan habitat-level meta-analyses, such data sets were associated most strongly with stress from anthropogenic eutrophication, which can fundamentally alter trophic structure and/or the physical habitat (hypoxia, loss of seagrass) and were accompanied in some instances by other pollution (commercial harbor, pulp mill; Kidwell Reference Kidwell2007).
Third, processing samples for species-abundance information is important. As shown here, although low taxonomic similarity (JC) is more likely to differentiate stressed systems at the sample scale in this system (and others), spatial pooling of data (and, up to a point, increases in sample size at a given site) increases live–dead taxonomic similarity more quickly than it increases similarity in species’ abundances (rho; Tables 3, 4, Fig. 6). This differential sensitivity in live–dead metrics will be generally true, because a single specimen can shift a species’ status from dead-only or alive-only to live–dead co-occurrence, whereas many specimens are needed to shift a species multiple ranks up or down in abundance within an assemblage sufficiently to affect a correlation coefficient. Biologically, changes in rank abundance are also arguably more revealing of structural change in a community than are small differences in taxonomic composition, unless those taxa represent an entire functional group (e.g., seagrass obligates). Presence–absence information alone will thus rarely suffice to appreciate live–dead mismatch, although dead-only and live-only occurrences that persist in the face of continued sampling and sample pooling will always be a compelling focus of mismatch analysis.
Fourth, we suspected that sample-level variability in stressed Bahamian lakes might arise from intersample differences in living assemblages rather than in death assemblages: that is, that live–dead mismatch in stressed systems was produced by spatially heterogeneous living populations. This underlying pattern would imply that, under stress, populations decline in occupancy—become spatially patchier—rather than decline in abundance everywhere. Non-metric multidimensional scaling revealed that living assemblage samples were in fact compositionally more disparate than death assemblages in two of three stressed lakes on New Providence (plus in Coral Lake, which we believe we miscategorized as pristine) and in all three stressed lakes on San Salvador, but in none of the three stressed lakes on Rum Cay (Supplementary Fig. 1). This weak majority result (5/9 lakes or 6/10 lakes) is thus promising as a biological explanation of high intersample variability of live–dead agreement in stressed systems, and its generality could easily be tested in sample-level data sets from other systems. Ultimately, and promisingly, losses among ostracode assemblages have been at the lake level rather than regional extirpations: with pooling, all species except two, C. arostrata and Propontocypris sp., become known both dead and alive in the region, if not on each of the three islands (Table 2). These losses would be unrecognized without live–dead comparison.
Fifth, live–dead discordance can reveal the progress of recovery, not just the detection of degradation, which has been the primary focus of the approach. Our discovery of significant mismatch in historically stressed lakes that have been absent human stresses for many decades could have two explanations. (1) Live–dead mismatch arises because death assemblages reflect past stressed conditions and the living assemblages reflect heretofore unsuspected recovery. (2) Alternatively, live–dead mismatch reveals heretofore unsuspected legacy effects that are retarding the recovery of communities from past stress, given that dead-only species are encountered living in other lakes during the same season of sampling (Table 2). Determining the ages or age range of dead valves, either by direct dating or by detecting cultural inclusions in shells, would discriminate these hypotheses. If valve ages extend back only to the period of human impact—for example, the 1780s to 1820s window for some lakes, as recently as the 1920s for others—then dead-only species are likely stress indicators, and thus recovery is supported. If valve ages extend back before that period, then those species are more likely canaries of prestress conditions, and full recovery has apparently stalled for some reason.
Finally, live–dead mismatch in historically stressed Bahamian lakes contrasts with preliminary data on ostracode and mollusk assemblages in temperate lakes that were industrially acidified in the 1970s and since remediated. Live–dead agreement in these remediated lakes is very good, comparable to that in never-altered lakes (Fitzpatrick et al. Reference Fitzpatrick, Kimball, Spergel, Michelson and Leonard-Pingel2015; Sbardella et al. Reference Sbardella, J. Leonard-Pingel and Michelson2015). This ecological recovery, along with the rapid taphonomic equilibration of the death assemblage to the new community state (and see rapid scales for lacustrine diatoms in Cameron Reference Cameron1995) contrasts with the decadal and longer taphonomic inertia exhibited by marine mollusks, wherein mismatch is a signal of environmental deterioration (Ferguson and Miller Reference Ferguson and Miller2007; Kidwell Reference Kidwell2007; Korpanty and Kelley Reference Korpanty and Kelley2014; Bizjack et al. Reference Bizjack, Kidwell, Velarde, Leonard-Pingel and Tomašových2017; but see Feser and Miller Reference Feser and Miller2014). The temperate lake result suggests less time averaging in surficial sediments, presumably owing to higher sediment accumulation rates and/or less bioadvection. In contrast, relatively low sedimentation rates in Bahamian lakes (as in Park Reference Park2012) and/or relatively vigorous and deep bioadvection appears to maintain skeletal remains in surficial sediments over multidecadal to centennial scales, as is more typical of marine settings.
Conclusions
Here we have shown that low average live–dead agreement, and especially sample-to-sample variability in live–dead agreement, can be a useful indicator of current and historical human alteration of lacustrine ostracode communities, a new extension of the approach. We have demonstrated that human stresses are associated with significantly lower live–dead agreement in both species composition and rank abundance and result in lower species richness in most living communities as compared with co-occurring dead remains and that these effects persist at habitat-level pooling of samples and qualitatively up to regional scales of spatial pooling. Live–dead comparison also reveals previously unappreciated species losses at the lake and island levels in the region and identifies a series of indicator species (canaries) for pristine conditions, based on their dead-only occurrences in currently stressed lakes.
Contrary to expectations, live–dead mismatch in stressed lakes does not correlate with human population density across the archipelago: the type and timing of human stresses on individual lakes and the possible recovery of some communities have been too heterogeneous for live–dead agreement to serve as a simple proxy for the magnitude of human effects. “Failure” at this regional scale, however, is compensated by novel biological insights at the level of individual islands and lakes.
Currently stressed lakes exhibit poorer live–dead agreement than pristine lakes, indicating environmental degradation; some historically stressed (saline) lakes have good live–dead agreement that suggests either rebound to their natural state or a lack of biological reaction to human stresses; and most historically stressed lakes still exhibit low average live–dead agreement, suggesting either unsuspected and recalcitrant legacy effects or, alternatively, recovery of communities in response to amelioration of human stress. This result is both an object lesson for the complexity of regional-scale analysis and an alert to the untapped power of live–dead comparison for evaluating ecological recovery, not just degradation.
Live–dead comparison of lacustrine ostracodes thus provides a powerful means of recognizing environmental status, local species losses, and lags in recovery, counteracting the “shifting baseline” syndrome that arises when direct observations are limited to habitats and biotas in the present day.
Acknowledgments
We are grateful to: The Bahamas National Trust, V. Haley-Benjamin, and L. Knowles for advice and logistical support of fieldwork in December 2013; the Gerace Research Centre, College of The Bahamas, and T. and E. Rothfus for support during fieldwork and liaisons with the Bahamian government; The National Lacustrine Core Facility (LacCore), K. L. Brady, and A. Myrbo for technical support in the field and laboratory; S. Bright, M. Dalman, E. Draher, and E. Woodward for field assistance; J. Leonard-Pingel, M. Marshall, P. Tierney, and K. Jenkins Voorhies for advice on sampling design; J. Spergel, M. Viteri, K. Kimball, and T. Quick for lab assistance; M. Abbott and J. Werne for collegial support;and J. S. Lefcheck for advice on data analysis. We also thank A. Henry and two anonymous reviewers for helpful comments on an earlier version of this article. Research was supported by National Science Foundation grants EAR-1249831 to A.V.M. and EAR-0851847 to L.E.P.B. and carried out under permits G252, G234, and G235 from Bahamas Environment, Science & Technology Commission. The authors declare no conflicts of interest.
Supplementary Material
Data available from the Dryad Digital Repository: https://doi.org/10.5061/dryad.8sp77v5