



Madam
The paper by Luiten et al.( Reference Luiten, Steenhuis and Eyles 1 ) applies a flawed methodology, makes several misleading statements regarding the healthfulness of packaged food and reaches conclusions that are not substantiated.
The main concern with the paper is the flawed methodology. This relates to the use of a truncated version of the Nutrient Profiling Scoring Criteria (NPSC). To understand the flaw, one needs to understand the development and application of the NPSC and the reason it was not used in its regulated form to underpin the recently developed Health Star Rating (HSR) system to indicate healthfulness of foods. The HSR is currently rolling out across New Zealand and Australia. The NPSC in its regulated form includes ‘fruit, vegetables, nuts, coconut and legumes’ (FVNL) and fibre. The fundamental structure of the NPSC depends on the interaction between all of its food nutrients, and to omit nutrients because the data are inconvenient or difficult to obtain demonstrates a fundamental failure to understand how the NPSC is structured, the effect of missing nutrients on scores and why the full suite of nutrient tables must always be brought to interact in concert in any comparison of foods using this method.
The NPSC was developed by Food Standards Australia New Zealand (FSANZ) specifically for the regulation of health claims used in the marketplace to promote aspects of primarily packaged foods in Australia and New Zealand. An early version in 2007( 2 ) did not refer to fibre or fruit and vegetables, but by 2008( 3 ) the NPSC appeared with ‘baseline’ points allocated for increasing amounts of energy, saturated fat, sodium and total sugars offset by ‘modifying’ points allocated for the increasing percentage of the product that was fruit, vegetables, nuts, legumes, coconut, spices, herbs, fungi and algae, and the amount of fibre, and in some cases protein, all up to capped levels. FVNL and fibre are essential for the integrity of the NPSC and were included for two key reasons: (i) there was a need for the NPSC to take both risk-increasing and risk-decreasing components into account; and (ii) the importance of foods such as fruits and vegetables as fundamental elements of a healthy diet and the logic for such foods to be able to make health claims. These together were primary drivers for developing a system beyond the ‘disqualifying criteria’( 3 ) (p. 27).
The NPSC is a very useful tool when operating in the vicinity of health claim cut points. No assumptions about ‘healthiness’ are required for working up a binary classification system within a narrow band of nutrient content. The only decisions required concern the range of allowable content, the risk-associated nutrients in qualifying foods and how much the risk-associated nutrients might be offset by beneficial nutrients to arrive at a qualifying score. It is of note that the risk-associated nutrients in the NPSC outweigh the beneficial offsets by about 2:1.
The NPSC was not used in its full and regulated form to indicate ‘healthfulness’ of foods for the government-supported HSR system that is currently rolling out across New Zealand and Australia. The HSR Technical Design Group, in conjunction with FSANZ, took a very thorough look at the merits of the NPSC as a tool for assessing relative healthfulness across the food system (that is, beyond its intended purpose). For such a purpose (before foods could be compared for healthfulness) the HSR Technical Design Group found that three major changes were required: (i) the underlying tables had to be substantially altered; (ii) the profiler scores had to be re-centred; and (iii) categories had to be utilised other than those found in the NPSC and tested against external criteria (the Australian Dietary Guidelines). For testing purposes in the development of an algorithm of healthfulness, test data had to be available that were complete (including FVNL and fibre), representative and validated.
Luiten et al.’s paper( Reference Luiten, Steenhuis and Eyles 1 ) fails to explain what happens with NPSC scores beyond the range covered by the NPSC tables, where many nutrient content scenarios with healthiness implications are operating. It may be the authors were unaware of this constraint within the Health Claims version of the NPSC that was used in their paper. According to a member of the HSR Technical Design Group, and based on the Group’s experience with the HSR food data (which do include FVNL and fibre data), it is when foods drift outside the working range of the NPSC nutrient tables in one or more nutrients that they become more and more difficult to assess. Beyond the design scope of the NPSC nutrient tables, assessment struggles because there are a large number of foods with nutrient content beyond the range covered by the NPSC nutrient tables. For example, the standard NPSC fibre table does not extend above 4·7 % (even if the full NPSC was used) nor protein above 8 %. A very large percentage of foods have content beyond these levels.
If the FVNL or fibre data (or both) are missing, the results will be biased against anything that contains whole or concentrated fruit, vegetable, nuts, legumes, herbs and spices. In some major food categories this results in a quite severe bias. This is particularly the case for beverages such as juices and for breakfast cereals. Overall, this means the results will be heavily biased against processed foods.
For the same reason, if the FVNL or fibre data are missing, comparisons about the degree of processing cannot be made, compared or used in any constructive or enlightening way because the FVNL and fibre content is, by nature, a function of the degree of processing. The results are essentially a biased artifact of a flawed methodology. Even if FVNL and fibre data were present, an NPSC classification of the food system produces a severely bimodal distribution of food scores for three reasons: (i) there is a linear relationship between nutrient content and scoring points in the NPSC points tables A and C wherein a single nutrient may distort the final score if present at high levels; (ii) there is a restricted range of nutrient content covered in the NPSC tables; and (iii) the profiler’s energy density categories must be taken into account when making comparisons between the relative healthfulness of foods, a fundamental property of the NPSC not considered in the paper. The nutrients used by the NPSC are not bimodal across the food system.
To demonstrate bias, the validated data used in the development of the HSR (data for more than 3500 foods from New Zealand and Australia validated using FSANZ validation tools and checked and re-checked by industry for accuracy) were used to compare application of the NPSC and the HSR with and without FVNL and fibre.
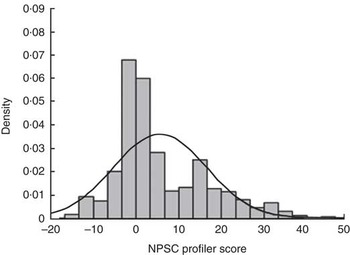
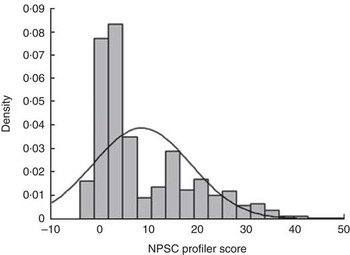
Without FVNL and fibre, the mean NPSC score shifts by approximately 2·3 points on average (about 30 % of the mean) towards ‘unhealthy’ and there is a significant change in skewness towards the unhealthy end. A more exaggerated bimodal distribution of NPSC scores generally also occurs (Figs 1 and 2). By removing wholefood components, packaged foods appear unhealthier than they would appear otherwise. Just how much, depends on where the degree-of-processing classification system intersects with the distribution of NPSC scores, for each NPSC category.
NPSC applied to validated food system data with FVNL and fibre:  , NPSC profiler score;
 , normal distribution (mean/median 6·084, SD 11·044); n 3506 (NPSC, Nutrient Profiling Scoring Criteria; FVNL, fruit, vegetables, nuts, coconut and legumes)
NPSC applied to validated food system data without FVNL and fibre: , NPSC profiler score; , normal distribution (mean/median 8·369, SD 9·922); n 3506 (NPSC, Nutrient Profiling Scoring Criteria; FVNL, fruit, vegetables, nuts, coconut and legumes)
Applying the HSR with and without FVNL and fibre also creates bias (Figs 3 and 4). The shift towards ‘unhealthy’ with the application of HSR excluding FVNL and fibre is very noticeable, and the distribution reverts to bimodal when FVNL and fibre are removed from the food data. It is not clear where the bimodality intersects with the degree-of-processing classification used in the paper. It is clear that removal of FVNL and fibre makes packaged foods appear less healthy.
HSR applied to validated food system data with FVNL and fibre: , HSR star points; , normal distribution (mean/median 6·193, SD 2·452); n 3506 (HSR, Health Star Rating; FVNL, fruit, vegetables, nuts, coconut and legumes)

HSR applied to validated food system data without FVNL and fibre: , HSR star points; , normal distribution (mean/median 5·383, SD 2·259); n 3506 (HSR, Health Star Rating; FVNL, fruit, vegetables, nuts, coconut and legumes)

Comparing the NPSC scores and the HSR demonstrates clearly the reason why the NPSC in its Health Claims form that is used by Luiten et al.( Reference Luiten, Steenhuis and Eyles 1 ) was not used as an indicator of healthfulness by the New Zealand and Australian Governments for the HSR.
A further comment on the NPSC is that the three major categories of the NPSC profiler are based on energy density, each with its own range of scores. Comparison of foods across the NPSC categories cannot be made unless the profiler scores are either normalised for energy density or calibrated after the profiling against some external criteria of healthfulness, such as the Australian Dietary Guidelines. This must be done with regard to the energy density category, as with the HSR.
The NPSC is dichotomous. The correct analysis using the NPSC is the proportion of foods eligible or ineligible. One cannot make comparisons between NPSC scores when those comparisons are simplistically averaged without regard to energy density categories. The NPSC categories will also suffer edge-crossover effects from the degree-of-processing classification system. As noted above, if scores are compared (even if distorted already by missing FVNL and fibre), this can only be done legitimately within the energy density categories. Otherwise, the category scores must be normalised (the distribution of scores shifted and re-centred) against an external standard of healthfulness, such as ‘everyday foods’ in the Australian Dietary Guidelines, before they can be compared across energy density categories in the manner the paper undertakes.
The impact of not including FVNL and fibre when using the NPSC for specific product groups is even more significant, as Figs 5–14 show.
Distribution of NPSC scores for processed vegetables with FVNL and fibre: , 1.2.7 NPSC score; , normal distribution (mean/median –6·268, SD 5·769); n 205 (NPSC, Nutrient Profiling Scoring Criteria; FVNL, fruit, vegetables, nuts, coconut and legumes)

Distribution of NPSC scores for processed vegetables without FVNL and fibre: , 1.2.7 NPSC score; , normal distribution (mean/median 0·859, SD 3·144); n 205 (NPSC, Nutrient Profiling Scoring Criteria; FVNL, fruit, vegetables, nuts, coconut and legumes)

Distribution of NPSC scores for processed fruit with FVNL and fibre: , 1.2.7 NPSC score; , normal distribution (mean/median 2·034, SD 5·064); n 118 (NPSC, Nutrient Profiling Scoring Criteria; FVNL, fruit, vegetables, nuts, coconut and legumes)

Distribution of NPSC scores for processed fruit without FVNL and fibre: , 1.2.7 NPSC score; , normal distribution (mean/median 6·263, SD 5·217); n 118 (NPSC, Nutrient Profiling Scoring Criteria; FVNL, fruit, vegetables, nuts, coconut and legumes)

Distribution of NPSC scores for breakfast cereal with FVNL and fibre: , 1.2.7 NPSC score; , normal distribution (mean/median 1·912, SD 5·150); n 193 (NPSC, Nutrient Profiling Scoring Criteria; FVNL, fruit, vegetables, nuts, coconut and legumes)

Distribution of NPSC scores for breakfast cereal without FVNL and fibre: , 1.2.7 NPSC score; , normal distribution (mean/median 6·316, SD 4·482); n 193 (NPSC, Nutrient Profiling Scoring Criteria; FVNL, fruit, vegetables, nuts, coconut and legumes)

Distribution of NPSC scores for processed meat and fish with FVNL and fibre: , 1.2.7 NPSC score; , normal distribution (mean/median 2·109, SD 4·952); n 238 (NPSC, Nutrient Profiling Scoring Criteria; FVNL, fruit, vegetables, nuts, coconut and legumes)

Distribution of NPSC scores for processed meat and fish without FVNL and fibre: , 1.2.7 NPSC score; , normal distribution (mean/median 2·151, SD 4·978); n 238 (NPSC, Nutrient Profiling Scoring Criteria; FVNL, fruit, vegetables, nuts, coconut and legumes)

Distribution of NPSC scores for nuts with FVNL and fibre: , 1.2.7 NPSC score; , normal distribution (mean/median 0·579, SD 7·443); n 57 (NPSC, Nutrient Profiling Scoring Criteria; FVNL, fruit, vegetables, nuts, coconut and legumes)

Distribution of NPSC scores for nuts without FVNL and fibre: , 1.2.7 NPSC score; , normal distribution (mean/median 14·719, SD 6·665); n 57 (NPSC, Nutrient Profiling Scoring Criteria; FVNL, fruit, vegetables, nuts, coconut and legumes)

Figures 11 and 12 show that FVNL and fibre have almost no effect on NPSC scores for the protein-rich meat and fish products and therefore the general healthfulness of such products is unaffected by the omission of FVNL and fibre. However, when compared with another protein-rich and generally healthful food group such as nuts, as seen in Figs 13 and 14, the effect of omitting FVNL and fibre is quite dramatic. Comparisons between such groups lose relevance. One cannot even say that ‘the more refined and processed the food, the more energy, saturated fat, sodium and sugar it contains’ because these nutrients, as well, vary by category. The overlap of those categories with the degree-of-refinement categories is nothing more than fortuitous.
The paper by Luiten et al.( Reference Luiten, Steenhuis and Eyles 1 ) does not use the NPSC within its design scope; but worse, if FVNL containing whole foods are left out, statements about relative healthfulness and the food system cannot be made because the NPSC in its intended form must consider and account for the huge range of foods within the food system that contain these components. For the same reason, valid comparison of processed and unprocessed foods cannot be made. Any results using either the full NPSC or a truncated version for a broader purpose than intended are therefore using it for a purpose for which it has not been validated.
The methodology applied by Luiten et al.( Reference Luiten, Steenhuis and Eyles 1 ) in their study not only applies a tool beyond its intended purpose but modifies the NPSC by excluding all the risk-decreasing components – fibre and FVNL – and therefore excludes foods that are fundamental elements of a healthy diet. The rationale by the authors for excluding fibre was that ‘since it can be expected that fibre is mostly listed in specific food categories (e.g. cereals), it was decided to exclude this from the NPSC to make the comparison between food categories more equitable’( Reference Luiten, Steenhuis and Eyles 1 ) (p. 3). The immediate result is that the authors are no longer using the NPSC and it is misleading to call it that when fundamental changes have been made to its application. It discredits the system and removes the legitimacy of its correct use. The more serious consequence is to reach conclusions about foods such as breakfast cereals that, as a food category, are likely to be incorrectly associated with non-communicable diseases( Reference Luiten, Steenhuis and Eyles 1 ) (p. 4). As well, the ‘equity’ the authors seek to promote perverts the true benefit of products specifically aimed at providing fibre such as breakfast cereals (including mueslis and wheat biscuits) which rely heavily on fibre and fruit and nuts to deliver the nutrition essential to starting the day. Starting the day with breakfast is well known to be beneficial( Reference Williams 4 ) and a reason why in New Zealand there are several programmes delivering breakfasts into schools.
Luiten et al.( Reference Luiten, Steenhuis and Eyles 1 ) state that ‘the NPSC is a rigorous method of assessing the healthiness of foods as it looks at both positive and negative nutrients’ (p. 8), which is not correct if the tool is employed outside its intended purpose. In any case, the application of the NPSC in Luiten et al.’s study removes any account of positive nutrients. When the unintended consequences of a certain method of approach are not investigated, particularly when they are known elsewhere, one cannot avoid those consequences by a mere description of why the consequences were ignored by the method.
In addition to concerns about methodology, there are some basic errors made in referring to specific companies. The most significant is attributing 29·6 % (n 92) of the 311 breakfast cereals to two companies, Ozone Organics and Kellogg’s, when Ozone Organics does not make cereal products. The cereal market share in New Zealand is as follows (Nielsen data, 12 July 2015):
Sanitarium, 42·9 %
Private Label, 17·2 % (manufactured under contract by Sanitarium, Vogels and Hubbards)
Kellogg’s, 12·0 %
Harraways, 9·4 %
Hubbards, 6·1 %
Other manufacturers, 12·4 %.
Foodstuffs and Progressive Enterprises Ltd are both described as cooperatives when Progressive Enterprises Ltd is wholly owned by Woolworths Ltd, a publicly listed company. The authors refer to the site of the New Zealand Ministry of Economic Development. The Ministry ceased to exist on 30 June 2012. A new Ministry was formed with several other agencies including the former Ministry of Economic Development on 1 July 2012 and is known as the Ministry of Business, Innovation and Employment.
The introductory comments state that ‘Different studies have indicated … in particular foods high in fat and sugar have been found to be cheaper than less energy-dense foods’ and references Powell et al.( Reference Powell, Auld and Chaloupka 5 ), which considers fast food and takeaways not related to packaged food sold in supermarkets.
It is also stated in the Luiten et al. paper( Reference Luiten, Steenhuis and Eyles 1 ) that ‘…many of the products available are in processed form and contain excessive salt, sweeteners, refined grains and oils…’ and supposedly substantiated by a paper by Nugent( Reference Nugent 6 ). Nugent’s paper makes no reference to processed products containing certain nutrients in excess. Nugent( Reference Nugent 6 ) states that ‘While global commercialization provides a great variety of food and beverages to most people, it also offers more products in processed and packaged forms containing a wide array of ingredients, including salt, sweeteners, and oils. Consumption of excess amounts of those ingredients and products, combined with other lifestyle changes, manifests in adverse health outcomes’ (p. 10). Nowhere in Nugent’s article does it suggest processed products generally contain excessive quantities of salt, sweeteners, refined grains and oils.
Another statement in Luiten et al.’s paper( Reference Luiten, Steenhuis and Eyles 1 ) reads ‘…the focus was on the food categories most likely to be adversely associated with non-communicable diseases, including ready meals, crisps and snacks, biscuits, chocolates and sweets, breakfast cereals and soft drinks…’ that references a paper by Moodie et al.( Reference Moodie, Stuckler and Monteiro 7 ). Moodie et al.’s paper makes no reference to ‘breakfast cereals’ in relation to non-communicable diseases.
Finally, in terms of recommendations, the paper by Luiten et al.( Reference Luiten, Steenhuis and Eyles 1 ) suggests that a ‘…reduction or relocation of unhealthier foods to less prominent shelf-space, the placement of healthier foods in more visible and highly accessible locations…’ (p. 7). This ignores the New Zealand supermarket arrangements that both Progressive Enterprises Ltd and Foodstuffs subscribe to in the vast majority of their supermarkets of placing an entire aisle of fresh fruit and vegetables at the entrance to their retail outlets, thereby requiring customers to be exposed to fresh produce before exposure to any processed food.
Acknowledgements
Financial support: This research received no specific grant from any funding agency in the public, commercial or not-for-profit sectors. Conflict of interest: K.R. is the CEO of the New Zealand Food & Grocery Council. Authorship: K.R. is the exclusive author of the manuscript. Ethics of human subject participation: Not applicable.



