I. INTRODUCTION
Bismuth telluride-based materials are widely used in thermoelectric devices due to their optimal ZT ∼ 1 at room temperature.Reference Goldsmid1 The efficiency of the thermoelectric materials is determined by the dimensionless figure of merit ZT = α2σT/(κe + κl), where α is the Seebeck coefficient, σ is the electrical conductivity, T is the absolute temperature in Kelvin, and κ is the thermal conductivity (κe is the carrier thermal conductivity and κ l is the lattice thermal conductivity).Reference Snyder and Toberer2 An ideal thermoelectric material, in principle, should be electrically short-circuited and thermally open-circuited with a high thermoelectric power.Reference Soni, Zhao, Yu, Aik, Dresselhaus and Xiong3 However, it is actually difficult to improve the ZT value of thermoelectric materials due to the interdependency of the three physical parameters (α, σ, and κ).
Goldsmid and PennReference Goldsmid and Penn4 proposed that reducing the lattice thermal conductivity could be an excellent way of improving the ZT value. Theoretical calculations and experimental results have demonstrated that the lattice thermal conductivity can be greatly reduced by increasing the phonon scattering at interfaces and boundaries.Reference Yang and Chen5,Reference Jiang, Chen, Zhu, Liu and Zhao6 To increase the phonon scattering, nanostructures such as nanowires, multilayer thin films, and semiconductor superlattices, etc. were used in the thermoelectric materials.Reference Dresselhaus, Chen, Tang, Yang, Lee, Wang, Ren, Fleurial and Gogna7,Reference Jood, Peleckis, Wang and Dou8 Since many traditional and prospective thermoelectric applications require thermoelectric materials with macroscale dimensions, it is also critical to develop fabrication methods to realize the advantages of the interface traits in bulk materials.
Up till now, significant efforts have been made to fabricate Bi2Te3-based bulk materials by using powder metallurgy techniques such as hot pressing (HP)Reference Combe, Funahashi, Azough and Freer9 and spark plasma sintering (SPS).Reference Kim and Hong10 Kim and MitaniReference Kim and Mitani11 fabricated Bi2Te3 materials by combining the hydrogen reduction method with subsequent HP, and a maximum ZT value of 0.46 was obtained with an average grain size of 1.2 μm at room temperature. Soni et al.Reference Soni, Shen, Yin, Zhao, Yu, Hu, Dong, Khor, Dresselhaus and Xiong12 used the SPS process to produce bulk Bi2Te2.7Se0.3 nanocomposites with an optimal number of interfaces gained at 523 K, and achieved a ZT value of 0.55. It can be seen that the ZT value of the materials fabricated by the traditional powder metallurgy is not high, and even lower than the conventional single crystal materials, especially for n-type Bi2Te3-based bulk materials. In addition, the high-facility cost of SPS prevents it from being used for extensive applications.
To improve the ZT value of bulk materials fabricated by powder metallurgy, a semisolid powder processing (SPP) was used to fabricate n-type porous bulk Bi2Te2.85Se0.15 ternary alloys in this study. The Bi2Te2.85Se0.15 composites were used here due to the reason that the Se doping leads to a convergence of the degenerate electronic bands for enhanced thermoelectric performance.Reference Pei, Shi, Lalonde, Wang, Chen and Snyder13 The solution of Se in Bi2Te3 results in a modification of the crystalline structure and electronic density of states, which is advantageous for inhibiting the onset of intrinsic conduction and is an important factor for the thermoelectric properties of Bi2Te3-based alloys.Reference Soni, Zhao, Yu, Aik, Dresselhaus and Xiong3
The SPP is a metallic material processing approach in the semisolid temperature range, combining the advantages of semisolid forming and powder metallurgy. Semisolid material behavior and their processing techniques were first investigated by Spencer et al. (1972) in the 1970s, followed by Clyne et al. (1986), Maurice et al. (1994), and Steinhoff et al. (2004). SPP exploits unique material behaviors involving both solid and liquid phases, and becomes a promising technology in metallic power processing.Reference Wu and Kim14 During the SPP process, there exist active recrystallization and rearrangement of grain boundaries, which are beneficial for the emerging of the nanoscale grains in SPP samples.Reference Chen, Hao and Sun15 Mesoscale pores were also formed due to the different shrinkage rates of the solid phase and the liquid phase in the solid–liquid slurry.Reference Seo, Youn and Kang16,Reference Takashiri, Tanaka, Hagino and Miyazaki17 The nanoscale grains combined with the mesoscale pores had caused a remarkable reduction of κl for the SPP sample compared with the unprocessed counterparts. In this study, the reduction of κl contributed to the significant enhancement of the ZT value in the SPP samples. This is consistent with our previous experimental findings on the n-type PbTe bulk materials fabricated by the SPP method.Reference Mei, Li, Yao, Wang, Zhu and Chen18 In our previous study, the thermoelectric properties of the PbTe SPP samples were primarily affected by nanoscale pores and the atomic scale defects of the Te vacancy. Both the nanoscale pores and the Te vacancy have contributed to the reduction of κl via scattering phonons with short or medium mean free paths (MFPs).
II. EXPERIMENTAL DETAILS
A. Specimen preparation
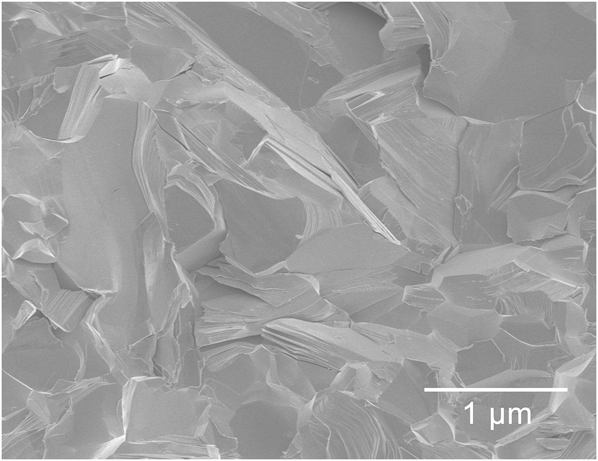
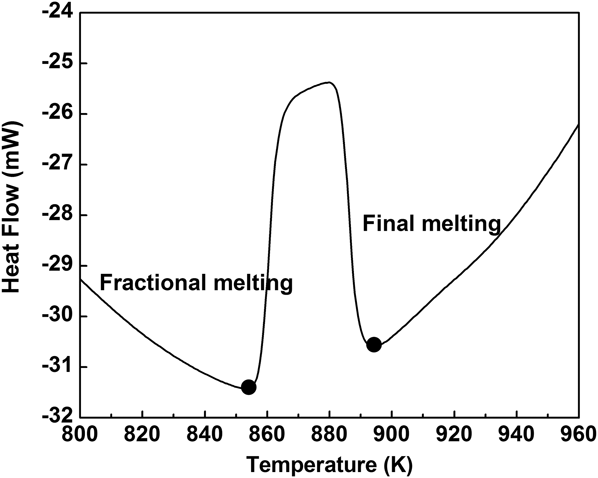
Commercial high-purity elemental granules of Bi (99.999%), Te (99.999%), and Se (99.999%) were weighed according to the nominal stoichiometric ratio of n-type Bi2Te2.85Se0.15 and sealed into a quartz tube at 10−3 Pa. The mixtures in the quartz tube were melted at 1073 K for 10 h and then rapidly cooled to room temperature using liquid nitrogen quenching to obtain the ingots. The average grain size of the obtained ingots was around 0.8 μm, and a typical field emission scanning electron microscope (FESEM) image of the ingots is shown in Fig. 1. The ingots were ground and mechanically sieved to fine powders smaller than 40 μm. And these powders consist of mass small particles due to the agglomerate phenomena in the hand-grinding. The obtained powders were then filled into a carbon-coated steel die with a hollow cylinder diameter of 12.7 mm and heated to a sintering temperature T with a heating rate of 20 K/min. Differential scanning calorimeter (DSC, NETZSCH STA 449 F3, Selb, Germany) was used to analyze the melting temperature range (i.e., the semisolid temperature range) of the powders. The semisolid temperature range of the Bi2Te2.85Se0.15 powders was 853–893 K, as shown in Fig. 2. According to the DSC result, the sintering temperature T was selected as 878 K. With the temperature T maintained at 878 K, the powders were compacted into bulk disk samples under a uniaxial pressure of 100 MPa for 6 min. The bulk samples were then furnace cooled down to room temperature without loading. The prepared sample was defined as SPP878.
FESEM image of the Bi2Te2.85Se0.15 ingots.

DSC analysis results of the Bi2Te2.85Se0.15 powders. The semisolid temperature range was from 853 to 893 K.
We also prepared samples using traditional HP at 773 K and die-casting at 973 K for comparison. The corresponding samples were then defined as HP773 and CAST973, respectively. To clearly demonstrate the unique behaviors in the semisolid state, we have conducted experiments for the same materials and the same processing conditions.
B. Characterizations and thermoelectric property measurements
The bulk disk samples were then polished for further characterization. The phase structure and the grain orientation of the bulk samples were characterized by x-ray diffraction (XRD, PANalytical X'pert PRO with a Cu Kα radiation, wave length = 1.54 Å). The fractured cross sections of the samples were observed in a FESEM (FEI Sirion100). The chemical compositions were analyzed by an electron probe microanalyzer (EPMA, JEOL JXA-8100, Tokyo, Japan) with a wave dispersive spectrometer. The relative densities (ρ) were measured using the Archimedes method. The Hall coefficient (R H) of the samples was measured at 300 K using a commercial physical properties measurement system (Quantum Design PPMS-9T) with a four-probe configuration. The carrier concentration (n) and Hall mobility (μH) were calculated using n = −(1/eR H) and μH = σR H,Reference Zou, Zhang, Ge and Zhang19 respectively. To avoid the thermal conductivity anisotropy in these textured bulk samples, the square samples of 9 × 9 × 3 mm3 were cut from the pressed disks. The square samples were then cut into three bars with the dimension of 9 × 3 × 3 mm3. These three bars were glued together using JB Weld® after rotated 90° anticlockwise. Then, the radial thermal diffusivity (λ, perpendicular to the pressing direction) was measured with a laser flash apparatus (NETZSCH LFA 457, Selb, Germany) and the specific heat (C P) was measured by NETZSCH DSC 404C (Selb, Germany). Thus, the thermal conductivity could be calculated using the formula κ = λρC P. The Seebeck coefficient and the electrical conductivity were simultaneously measured by the direct-current four-probe method and the differential voltage/temperature technique using a commercial Linseis® LSR-3 system.
III. RESULTS AND DISCUSSION
A. Microstructure of sintered Bi2Te2.85Se0.15 alloys
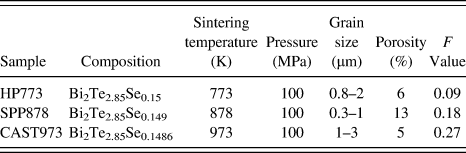
Normalization has been done for the XRD patterns of the three samples as shown in Fig. 3. The XRD patterns show that all the bulk samples are single-phase Bi2Te2.85Se0.15. Note that the (00l) peaks of the CAST973 sample are much higher than those of the HP773 and SPP878 samples, indicating that the CAST973 bulk sample is preferentially oriented with the (00l) texture. The orientation degree of (00l) planes F has been calculated using the Lotgering method: F = (P − P 0)/(1 − P 0), P = I(00l)/∑I(hkl), and P 0 = I 0(00l)/∑I 0(hkl), where I(00l) and I 0(00l) are the peak integral intensities of the measured sample and randomly oriented samples, respectively. The F values of the three samples are shown in Table I. The formation of the texture can be attributed to the good fluidity of the liquid phase at high temperature and the hexagonal structure.Reference Soni, Zhao, Yu, Aik, Dresselhaus and Xiong3,Reference Shen, Hu, Zhu and Zhao20 On the other hand, the strong texture is usually difficult to form when the grain size is small, but it will get easier for the larger grain size.Reference Jiang, Chen, Bai, Yao and Wang21 In this study, it is obvious that the degree of texture also depends largely on the grain size. The peaks of the CAST973 bulk sample are sharper than those of the HP773 bulk sample and the SPP878 bulk sample, indicating that the grain size of the CAST973 sample is larger than that of the HP773 sample and the SPP878 sample. Besides, the sharper peaks might also arise from the decrease of the crystalline defects and the remnant stress after high-temperature pressing. The crystalline defects of the Bi2Te2.85Se0.15 bulk samples include the atomic scale point defects like antisite defects ( ${\rm{Bi}}_{{\rm{Te}}}^\prime$ and
 ${\rm{Bi}}_{{\rm{Se}}}^\prime$) and donor-like defects (
 ${\rm{V}}_{{\rm{Te}}}^{ \bullet \bullet }$ and
 ${\rm{V}}_{{\rm{Se}}}^{ \bullet \bullet }$). The antisite defects occur during the crystal growth from the stoichiometric melting and the donor-like defects occur during the hand-grinding. And the crystalline defects also include the lattice defects like the dislocations emerge in the deformation process.
The normalized XRD patterns of the Bi2Te2.85Se0.15 samples sintered at various temperatures (as denoted on the right of each trace). The presence of 006, 015, 1010, and 0015 diffraction peaks illustrates the typical orientation of the Bi2Te2.85Se0.15 structure.
Processing parameters and structure properties of the Bi2Te2.85Se0.15 samples fabricated at various sintering temperatures.
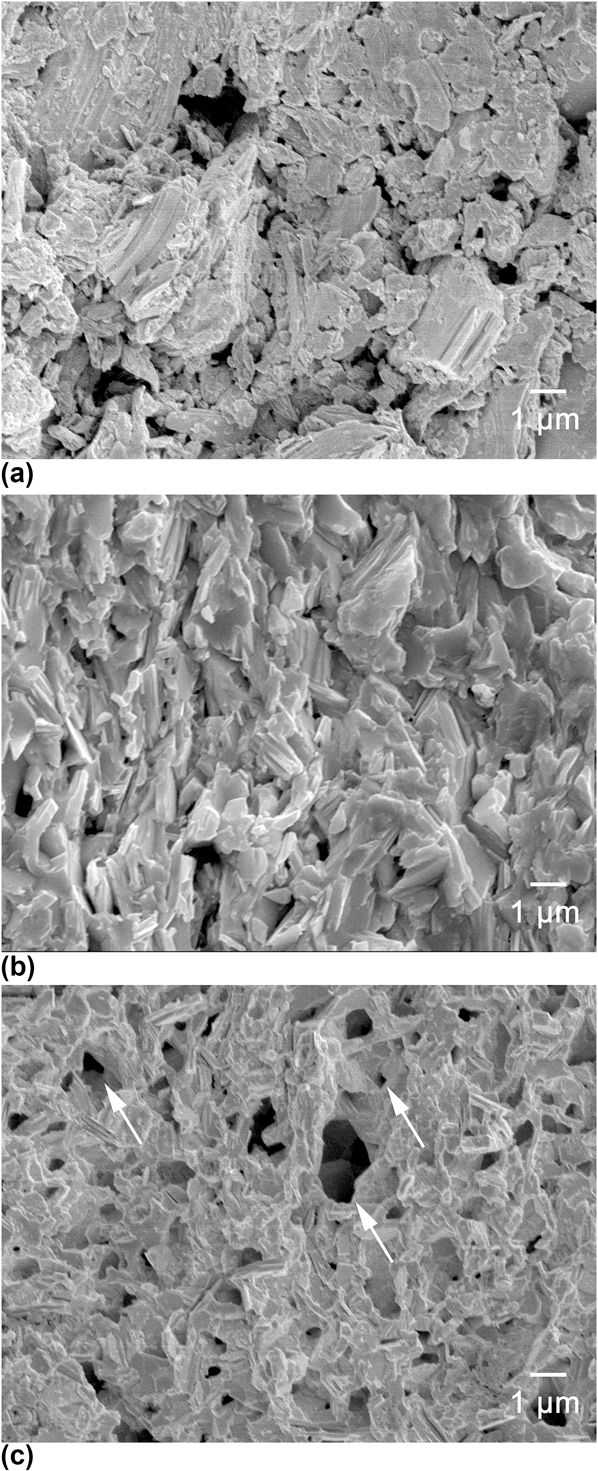
The SEM images of the fracture surfaces of all the bulk samples are shown in Fig. 4. The boundaries of the HP773 powder particles can be clearly observed in Fig. 4(a), implying that sintering was inadequate at this temperature. The separated particles were due to the low sintering temperature and had led to a low electrical conductivity. Besides, the grain arrangement of the HP773 sample is more relatively random, whereas the CAST973 sample shows a more preferentially oriented configuration, as shown in Fig. 4(b). The variation of texture exhibits a good consistency with the former XRD results.
FESEM images of Bi2Te2.85Se0.15 bulk materials. The cross section views of (a) HP773, (b) CAST973, and (c) SPP878, respectively. The arrows represent the mesoscale pores (∼0.1–1.0 μm).
Figure 4(c) shows a reticulate structure and an internal porosity feature for the SPP878 sample. The Bi2Te2.85Se0.15 powders were turned into a solid–liquid mixed slurry when heated to the semisolid temperature. The interaction in the slurry mainly included the partial remelting of the solid phase and the partial recrystallization of the liquid phase along their contacted grain boundaries.Reference Mahmoud, Mahmoud, Zakaria and Khalifa22 In addition, due to the existence of the solid phase material, there were severe internal stress and grain deformations under a punch pressure of 100 MPa, thereby enhancing the rearrangement and recrystallization of the grains in the semisolid slurry.Reference Hu, Gao, Liu, Xie, Shen, Zhu and Zhao23 The rearrangement and recrystallization of the grains during deformation were responsible for the uniform distribution of the nanoscale grains in the SPP878 sample. The grain size of the SPP878 sample ranges from 300 nm to 1 μm, smaller than that of the HP773 sample (0.8–2 μm) and the CAST973 sample (1–3 μm), as can be seen in Fig. 4.
The mesoscale pores were mainly caused by the liquid segregation phenomenon due to the different shrinkage rates of the solid phase and the liquid phase.Reference Seo, Youn and Kang16,Reference Pinsky, Charreyron and Flemings24 On the other hand, some of the gas was largely stored in the semisolid slurry with parts dissolved in the slurry and parts enveloped around or trapped in the cluster of the reinforcement particles.Reference Nguyen and Favier25 Most of the gas adsorbed on the surface of the particles is a mixture of hydrogen, oxygen, and nitrogen, and its quantity increases as the average size of the particles decreases.Reference Mahmoud, Mahmoud, Zakaria and Khalifa22 The stored gas combined with the liquid segregation process contributed to the considerable porosities in the bulk material.Reference Seo, Kang and Son26 The porosity of the SPP878 sample was 13% according to the relative density measured by the Archimedes method and the pore size was of the mesoscale (∼0.1–1.0 μm) observed from the SEM images. However, the porosities of the HP773 sample and the CAST973 sample were 6 and 5%, respectively. With the existence of the mesoscale pores and the nanoscale grains, a high number of interfaces and grain boundaries can be expected in the SPP878 sample. Detailed processing parameters and structure properties of the three samples are shown in Table I.
B. Carrier concentration and carrier mobility
The room-temperature carrier concentration and Hall mobility of all the samples fabricated at various sintering temperatures are shown in Fig. 5. The carrier concentration apparently increases from 2.9 × 1019 cm−3 to 4.7 × 1019 cm−3 when the sintering temperature increases. This can be explained by the evaporation of selenium with a low boiling point (958 K). We have performed the EPMA analysis for the bulk samples. The measured compositions of the HP773, SPP878, and CAST973 samples were Bi2Te2.85Se0.15, Bi2Te2.85Se0.149, and Bi2Te2.85Se0.1486, respectively, as shown in Table I. The EPMA results are consistent with the above explanation. Meanwhile, the Hall mobility has almost the same variation tendency with the carrier concentration. This should be due to a reduced density of the crystalline defects with a higher sintering temperature in the SPP878 sample and the CAST973 sample.Reference Kuo, Hwang, Jeng, Su, Chou and Ku27 It is believed that the overall increase in the electrical carrier mobility of the SPP878 sample and the CAST973 sample is attributed to the recovery process in the material at elevated sintering temperatures. The recovery process is similar to the high-temperature annealing. A part of the unstable crystalline defects will disappear, and the prior grain boundaries will extend in the recovery process. For the temperatures between 250 and 300 K where the velocity distribution of the carriers was usually constant, it is reasonable to assume that the Hall mobility, μH, is equal to the carrier mobility μ.Reference Kim and Mitani11 Thus, the carrier mobility of the HP773, SPP878, and CAST973 samples at room temperature is calculated to be 41.9, 74.5, and 80.2 cm2 V−1 s−1, respectively. Some room-temperature electron and phonon transport properties of the samples are shown in Table II.
The room-temperature carrier concentration and carrier mobility of Bi2Te2.85Se0.15 bulk materials fabricated at various sintering temperatures.
Electron and phonon transport properties of the Bi2Te2.85Se0.15 samples sintered at 773, 878, and 973 K. The measurements were taken at room temperature (T = 300 K).
C. Electrical conductivity and Seebeck coefficient
Figure 6 shows the thermoelectric properties of the Bi2Te2.85Se0.15 bulk samples measured at the temperature range of 280–520 K. As expected, the temperature dependence of the electrical conductivity, σ(T) [Fig. 6(a)], shows a metallic behavior in each bulk sample. And apparently, the electrical conductivity increases with the sintering temperature increased as shown in Fig. 6(a). It can be seen that the room-temperature electrical conductivity increases from 1.94 × 10⁴ S m−1 for the HP773 sample to 4.07 × 10⁴ S m−1 for the SPP878 sample, and further increases to 6.04 × 10⁴ S m−1 for the CAST973 sample. This tendency is consistent with the monotonic increases of the carrier concentration and carrier mobility with the temperature as shown in Fig. 5. The improvement in the electrical conduction for the CAST973 sample was due to the improved carrier mobility arising from the decrease of the crystalline defects and the Se evaporation during sintering at high temperature. And the high electrical conductivity of the SPP878 sample largely benefits from its improved carrier concentration. The negative values of α indicate that all the samples are n-type conductive. The absolute value of the Seebeck coefficient has an inverse tendency against the electrical conductivity as shown in Fig. 6(b), since it is inversely proportional to the carrier concentration.
Temperature dependence of (a) electrical conductivity, (b) Seebeck coefficient, (c) power factor, (d) thermal conductivity, (e) lattice thermal conductivity κl, and (f) figure of merit of Bi2Te2.85Se0.15 bulk materials sintered at different temperatures.
Figure 6(c) shows the variation of the power factor (α2σ) of the samples with the sintering temperature. It is noteworthy that the SPP878 sample possesses a higher power factor value than the other two samples. All the sintered bulk samples show a decreasing trend in the power factor when raising the measurement temperature. The maximum power factor value obtained in this study was 1.19 mW m−1 K−2 at 343 K for the SPP878 sample, owing to its relatively high electrical conductivity of 4.07 × 10⁴ S m−1 and its Seebeck coefficient of −180.4 μV K−1.
D. Thermal conductivity
The electrical component in the thermal conductivity is due to the heat transport by the electrons and can be estimated from electrical conductivity using the Wiedemann–Franz lawReference Nolas, Sharp and Goldsmid28 (κe = LσT, with Lorentz constant L = 2.45 × 10⁻⁸ V2 K−2). The lattice component in the thermal conductivity is due to the heat transport by phonons and is low for amorphous or disordered materials.Reference Zhao, Ji, Zhang, Zhu, Tu and Zhang29 The internal porosity defects and the nanoscale grains in the SPP878 sample lead to a significant reduction in the thermal conductivity as shown in Figs. 6(d) and 6(e). It is worth noting that the Se evaporation was little and the Se defects were not obvious comparing with the porosity defects. In the current literature, both the porosity and the grain size have an effect on the lattice thermal conductivity. According to Ref. Reference Takashiri, Tanaka, Hagino and Miyazaki17, the lattice thermal conductivity decreases as the porosity increases. The lattice thermal conductivity becomes 70% of the value for fully dense alloys at a porosity of 20%, and it reaches half of that value at a porosity of 40%. The Niarchos' group has also proposed a model to precisely estimate the reduction of lattice thermal conductivity in porous materials.Reference Tarkhanyan and Niarchos30 The model is based on a porous medium in the presence of two different groups of nonoverlapping spherical hollow pores with various size scales, namely, nanoscale pores with volume fraction φ1 and randomly distributed pore diameters d 1 around average diameter  $\overline {{d_1}}$, and microscale pores with volume fraction φ2 and diameters d 2 around average diameter
 $\overline {{d_2}}$. The relationship between the porous structure and the lattice thermal conductivity can be defined as
 $${{{K_{\rm{L}}}} \over {{K_{\rm{b}}}}} = {{1 - {\varphi _1} - {\varphi _2}} \over {1 + {\Lambda _{\rm{b}}}G}}\quad ,$$
where K L and K b are the lattice thermal conductivity in a porous medium and a bulk medium with zero porosity, respectively; Λb is the phonon MFP in the bulk medium, and G is given by
 $$G = {G_1} + {G_2},\;\;\;{G_i} = {{3{\alpha _i}{\varphi _i}} \over {2\left( {{\alpha _i} + 2} \right)\overline {{d_i}} }},\;\;\;i = 1,2\quad ,$$
where αi is the “shape” parameter of the gamma distribution.Reference Jambunathan31
The model verified that bulk materials with randomly distributed pores of varying diameters from nano- to microscale sizes had considerable lower lattice thermal conductivity than those with pores of an identical diameter. In this study, the pore sizes of the SPP878 sample distributed widely from 0.1 to 1.6 μm. However, the mesoscale (∼0.1–1.0 μm) pores are in the majority of the pores as shown in Fig. 7.
Pore size histogram of the Bi2Te2.85Se0.15 bulk sample sintered at the semisolid temperature (T = 878 K). The red columns represent the pore size of the mesoscale (∼0.1–1.0 μm).
As a combined effect of the relevant nanoscale grain boundaries and the mesoscale (from nanoscale to microscale ∼0.1–1.0 μm) pores' boundaries, phonons with a MFP approximately between 300 nm and 1 μm were effectively scattered. According to the Born–von Karman (BvK)’ dispersion model,Reference Takashiri, Tanaka, Hagino and Miyazaki17 phonons with such a broad wave length spectrum will cumulate about 80% of the lattice thermal conductivity compared to the fully dense Bi2Te2.85Se0.15 at room temperature.Reference Minnich and Chen32 The minimum value of the lattice thermal conductivity for the SPP878 sample is 0.163 W m−1 K−1 at 383 K, approximately 60% smaller than their nonporous Bi2Te2.85Se0.15 polycrystalline bulk counterparts.Reference Soni, Zhao, Yu, Aik, Dresselhaus and Xiong3,Reference Li, Qin, Dou, Li, Sun, Wang, Li, Xin, Wang, Wang, Song, Liu and Zhang33
The temperature dependence of thermal conductivity of the samples is shown in Fig. 6(d). The thermal conductivity has the highest value for CAST973 and then decreases in the sequence of HP773 followed by the SPP878 samples. Their corresponding minimum thermal conductivities are 0.86, 0.54, and 0.49 W m−1 K−1, respectively. The HP773 sample possesses a low thermal conductivity due to its cleavage structure and its relatively low carrier concentration. But the CAST973 sample possesses a relatively higher thermal conductivity owing to the grain growth at high temperature. The significant reduction of the lattice thermal conductivity for the SPP878 sample appears to be the obvious reason for the decrease of its total thermal conductivity.
E. The dimensionless figure of merit ZT
The distribution of MFPs for the electrons in electronic transport is much narrower than that of the phonons in heat transport, causing the electrons to be less scattered than the phonons at grain boundaries and pore interfaces. Thus, although the moderate Seebeck coefficient and electrical conductivity in both cases suggest that the boundaries and interfaces have reduced the carrier mobility, this degradation is more compensated by the reduced thermal conductivity in the denominator, leading to significant improvements of ZT for the SPP878 sample compared with the HP773 and the CAST973 samples. A maximum ZT value of 0.89 was obtained at 423 K for the SPP878 sample, as shown in Fig. 6(f), whereas the HP773 sample and the CAST973 sample reach their peak ZT values of 0.54 and 0.44 at 400 K, respectively. The SPP method can easily promote the thermoelectric properties of n-type Bi2Te2.85Se0.15 bulk materials owing to a combined effect of the mesoscale pores and the nanoscale grains.
IV. CONCLUSIONS
In this study, the SPP was applied to improve the thermoelectric properties of the n-type Bi2Te2.85Se0.15 materials by introducing nanostructures like the mesoscale pores and the recrystallized nanoscale grains. The ZT values of the SPP sample are higher than their counterparts at 280–520 K. The maximum ZT value of the SPP sample was 0.89 at 423 K, showing an enhancement of 65.7 and 101.3% compared with the HP and the die-casting counterparts, respectively. This remarkable enhancement mainly resulted from the reduced lattice thermal conductivity of the SPP samples. The mesoscale pores and the nanoscale grains introduced by the SPP method have induced abundant grain boundaries and interfaces, which significantly reduce the lattice thermal conductivity by 60%. In addition, the nanostructures exhibited a significant potential to suppress the thermal conductivity with a minimized decrease in the electrical conductivity. Thus, the SPP method is considered to be a successful method to gain high-performance Bi2Te3-based materials.
ACKNOWLEDGMENTS
The work was supported by the National Natural Science Foundation of China (Grant Nos. 51175460 and 51275466), Science Fund for Creative Research Groups of National Natural Science Foundation of China (Grant No. 51221004), Zhejiang Provincial Funds for Distinguished Young Scientists of China (Grant No. LR14E050002), and the Program for New Century Excellent Talents in University (Grant No. NCET-13-0518).