Medications account for more than 10% of healthcare spending, and antimicrobials are consistently among the medication classes with the most expenditures in US hospitals.1,2 Both the volume and choice of antimicrobials used, however, vary substantially across centers.3,4
Antimicrobial stewardship programs (ASPs) are patient safety and quality improvement initiatives shown to reduce antimicrobial overuse while improving clinical outcomes.5-7 Although the primary target of ASPs should be improving patient outcomes, secondary measures include the impact on healthcare costs. Recent studies have estimated antimicrobial expenditures in hospitalized patients but have not compared antimicrobial spending across hospitals.1,8 Identifying the impact of different antimicrobial use patterns across children’s hospitals could yield potential targets for pediatric ASPs.
METHODS
We performed a cross-sectional analysis to examine the volume and cost of antimicrobial use for hospitalized children. Data were obtained from the Pediatric Health Information System, an administrative database of freestanding US children’s hospitals. Analyses were restricted to 36 hospitals after excluding institutions with data quality issues, with incomplete data, or without an available cost-to-charge ratio. We included all inpatient and observation patients discharged in 2012.
Billed charges were obtained for all antimicrobials by any route of administration. To assess volume, the number of days of therapy (DOT) was calculated.3 For cost, presented in US dollars, the hospital- and department-specific cost-to-charge ratio was used to calculate cost from charges. Antibiotic use was summarized by condition using All Patient Refined Diagnosis Related Groups, version 25, codes.9 To examine variation across hospitals, we chose 2 clinical conditions, pneumonia and appendectomy, that (1) have previously been identified as stewardship targets,4 (2) had high antimicrobial use in both cost and DOT, and (3) do not vary greatly in clinical presentation across hospitals.
Antimicrobial use was summarized by the proportion of overall medication costs and of total DOT contributed by antimicrobials. The cost-to-DOT ratio, the proportion of total antimicrobial cost divided by the proportion of total DOT, was calculated to identify antimicrobials that were disproportionately costly relative to utilization (ie, ratio >1.0). For variability analyses, log-gamma (cost) and Poisson (DOT) models were fit overall and for individual conditions, with hospitals as fixed effects. Using marginal standardization, we estimated the standardized cost and DOT per patient-day. Correlation between DOT and cost was assessed by the Pearson correlation coefficient.
Overall analyses standardized for the following patient covariates: age (<1 year, 1-4 years, 5-11 years, ≥12 years), sex, complex chronic conditions,10 surgical procedure, and need for critical care (≥2 consecutive days with mechanical ventilation or vasoactive medications, or a single day of extracorporeal membrane oxygenation). Analysis by condition excluded patients with complex chronic conditions and those who required critical care (mechanical ventilation or vasoactive medications for children with pneumonia; vasoactive medications for children with appendectomy) and standardized for age, sex, surgical procedure, and All Patient Refined Diagnosis Related Groups severity of illness. SAS, version 9.3 (SAS Institute), and Stata, version 13.1 (StataCorp), were used.
RESULTS
In 2012, there were 599,518 patients discharged from 36 hospitals, of whom 357,522 (59.6%) received antimicrobial therapy. Overall, $192.9 million was spent on antimicrobials, accounting for 17.1% of the total pharmacy budget ($1.13 billion).
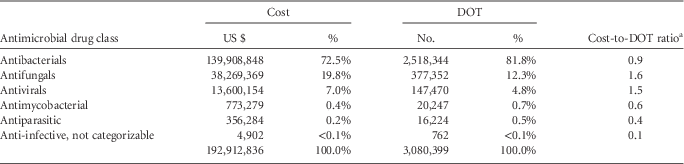
Table 1 describes use by antimicrobial category. Of all antimicrobial use, antibacterials accounted for 72.5% of cost and 81.8% of DOT. Cost-to-DOT ratio was greater than 1 for both antifungals and antivirals. The top 5 drugs contributing to cost—vancomycin ($15.9 million), meropenem ($15.4 million), piperacillin-tazobactam ($14.7 million), amphotericin B-lipid ($12.2 million), and ceftriaxone ($10.1 million)—accounted for more than 35% of total antimicrobial expenditures and 22% of DOT.
Cost and Days of Therapy (DOT) by Antimicrobial Category Among 357,522 Patients

a Cost-to-DOT ratio is proportion of total cost divided by proportion of total DOT.
Meropenem accounted for 8.0% of total antimicrobial costs but only 2.8% of antimicrobial DOT (cost-to-DOT ratio, 2.8). Linezolid also had a disproportionately large proportion of cost relative to DOT (ratio, 3.8), whereas vancomycin contributed equally in cost and DOT (ratio, 1.0). Cefazolin had one of the lowest ratios (0.6) among commonly used antibacterials.
Among antifungals, amphotericin B-lipid and the echinocandins (micafungin/caspofungin) each accounted for $11.5 million (ie, each accounted for more than 6% of antimicrobial costs), followed by voriconazole at $7.8 million (4%).
Among antimicrobials used for at least 10,000 DOT (43 drugs accounting for 93.3% of all DOT), 4 of the 5 most expensive drugs by cost-to-DOT ratio were antifungals: amphotericin B-lipid (8.6), caspofungin (6.5), micafungin (3.3), and voriconazole (2.9).
Children with bone marrow transplant and cystic fibrosis exacerbation accounted for the largest share of antimicrobial spending (10.7% and 7.3%, respectively) and had the third and fifth highest cost-to-DOT ratios among conditions with at least 10,000 DOT (1.8 and 1.7, respectively). Neonatal admissions accounted for the third highest total expenditures (6.8%) but nearly the lowest cost-to-DOT ratio (0.5).
Across hospitals, the median (range) proportion of the total pharmacy budget spent on antimicrobials was 17.1% (11.7%-33.7%). After standardizing for patient characteristics, the median (range) antimicrobial cost per patient-day at each hospital was $48 ($9-$139) (interquartile range, $38-$66).
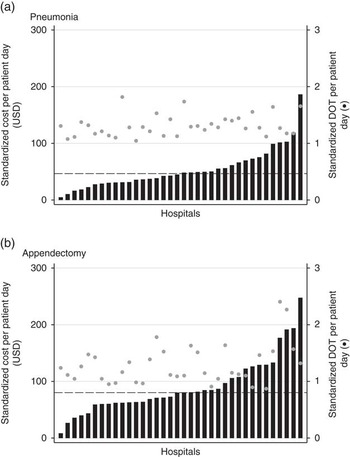
After standardizing for patient demographic characteristics and severity of illness, the median (range) antimicrobial cost per patient-day at each hospital was $47 ($5-$186) (interquartile range, $31-$69) for pneumonia and $80 ($8-$248) (interquartile range, $62-$119) for appendectomy, and the variation in cost was not strongly correlated with DOT (Figure 1A and 1B; r = 0.3 and 0.4, respectively).
Standardized cost in US dollars (USD) and days of therapy (DOT) of antimicrobial treatment per patient-day by hospital. Black bars are cost and associated with the left y-axis. The dashed line is median cost. Gray dots are DOT and associated with the right y-axis. Patients with pneumonia (n=11,826) and appendectomy (n=13,214) were identified using All Patient Refined Diagnosis Related Groups. Analyses excluded patients with complex chronic conditions or who received critical care and were standardized for age, sex, surgical procedure, and All Patient Refined Diagnosis Related Groups severity of illness.

DISCUSSION
We examined the cost of antimicrobial prescribing by drug, therapeutic class, and clinical condition at 36 freestanding children’s hospitals. We found that (1) antimicrobial drugs made up a sizable proportion of each hospital’s total medication expenditures, (2) a few specific drugs accounted for a large proportion of antimicrobial cost, (3) some drugs that accounted for a large proportion of cost did not account for a similar amount of use (eg, antifungals), and (4) antimicrobial costs for common pediatric infections varied across hospitals.
These findings highlight cost as an important metric to identify antimicrobial stewardship targets. First, antimicrobials accounted for 17.1% of pharmacy drug costs. Thus, promoting judicious antimicrobial use could substantially impact a hospital’s budget. This finding is consistent with prior studies of all acute care hospitals (not pediatric specific), which revealed that antimicrobials are in the top 3 pharmacy expenditures.1,2,11
Second, only a few drugs accounted for a third of total antimicrobial costs; however, these differed from those identified in adult-dominated populations (where daptomycin contributed most to antimicrobial expenditures).1 Therefore, targets for antimicrobial stewardship (when similar therapeutic choices exist) can differ by patient population.
Third, some drugs, especially antifungals, disproportionately contributed to cost compared with DOT, as illustrated by the cost-to-DOT ratio. For example, if DOT alone were used to identify ASP targets, antifungals and linezolid might be overlooked.
Fourth, we observed greater than 20-fold differences in antimicrobial cost per patient-day with appendectomy or pneumonia—2 of the most common indications for antimicrobial use in hospitalized children4—even after standardizing for patient demographic characteristics and severity of illness. Importantly, these differences were more pronounced than those using DOT alone—the current standard antimicrobial use metric—because they were likely more driven by specific antimicrobial choice than by the number of drugs or duration of therapy.
Our study has limitations. Antibiotic use was derived from billing data, which might not always reflect drug administration. Additionally, our results might not be generalizable to non-freestanding children’s hospitals.
In conclusion, antimicrobials account for a large proportion of medication spending in children’s hospitals and cost varies substantially across children’s hospitals. ASPs should collect and consider cost data to help optimize antimicrobial prescribing strategies.
ACKNOWLEDGMENTS
Financial support. None reported.
Potential conflicts of interest. All authors report no conflicts of interest relevant to this article.