The prevalence of childhood obesity is 17% in the United States of America, affecting 12.7 million children.Reference Ogden, Carroll, Fryar and Flegal1 The health impacts of obesity, including hypertension and diabetes mellitus, are associated with increases in left ventricular mass.Reference Eguchi, Boden-Albala and Jin2,Reference Kavey3 Increased left ventricular mass is associated with adverse clinical outcomes in adults and children.Reference Kiencke, Handschin and von Dahlen4,Reference Maskatia, Spinner and Nutting5 Its presence is often used as the threshold to start medical therapy in multiple disease processes associated with obesity. Therefore, the ability to accurately diagnose abnormal left ventricular mass is critical in directing the clinical management of obese children and adolescents.
Ventricular mass has a linear relationship to cardiac output. The common practice of indexing echocardiographically derived left ventricular mass to measures of body size is based on body size’s linear relationship with cardiac output and left ventricular mass. Patients with larger body size are expected to have greater left ventricular mass.Reference de Simone, Kizer and Chinali6–Reference Kuch, Gneiting and Doring9 Left ventricular mass is often scaled to body surface area or height2.7 to account for body size differences between patients.Reference de Simone, Daniels and Devereux10 While this works adequately in normal-sized patients, these methods lead to inaccuracies in the diagnosis of left ventricular hypertrophy in the obese population.Reference Foster, Gao and Mackie8 Compared to a normal weight child, an obese individual’s adipose tissue makes up a larger proportion of mass. The fat mass, however, is metabolically inert and does not significantly contribute to cardiac output or left ventricular mass. Therefore, scaling to body surface area has been demonstrated to underestimate left ventricular mass in the overweight and obese population. Alternatively, indexing to height2.7 results in overestimation of left ventricular mass in the same group as it does not account for the inherent increased cardiac output and lean body mass seen in obese patients.Reference de Simone, Daniels and Devereux10,Reference Foster, Mackie and Mitsnefes11
Theoretically, lean body mass is the body size variable most closely related to cardiac output and would therefore be the most accurate scaling metric for left ventricular mass. Indeed, several studies have shown that lean body mass correlates well with left ventricular mass in the obese populations.Reference Dewey, Rosenthal, Murphy, Froelicher and Ashley7,Reference Bella, Devereux and Roman12–Reference Hense, Gneiting and Muscholl17 However, measuring lean body mass in the clinical setting is difficult to accomplish. The reference-standard modality for measuring left ventricular mass is dual-energy X-ray absorptiometry. Although dual-energy X-ray absorptiometry provides accurate quantification of lean body mass, it is an impractical tool in the clinical setting due to limitations in access and resource utilisation. To overcome this barrier, Foster et al developed and validated sex-specific predictive equations for lean body mass in the paediatric population using commonly measured clinical variables.Reference Foster, Platt and Zemel18 These equations were subsequently independently validated in the paediatric population with obesity.Reference Jackson, Henshaw and Carter19 The purpose of this study was to use these equations to determine the ideal scaling variable for left ventricular mass and to compare the diagnostic accuracy of predicted lean body mass, body surface area, and height in detecting abnormal left ventricular mass in obese children.
Materials and methods
This study is a secondary analysis of a previous prospective cross-sectional study evaluating differences in markers of the metabolic syndrome in white and black children with obesity.Reference Chowdhury, Henshaw and Friedman20,Reference Palmieri, Henshaw, Carter and Chowdhury21 The study was approved by the Institutional Review Board of the Medical University of South Carolina.
Patient population
Patients aged 4–21 years with a body mass index >95th percentile were enrolled from the Medical University of South Carolina’s Heart Health clinic which specialises in childhood and adolescent weight management. Inclusion criteria consisted of (A) age 4–21 years, (B) body mass index >95th percentile, (C) black or white race, and (D) absence of hypertension history. Patients were excluded if they were taking insulin, oral steroids, or were pregnant at the time of enrolment.
Procedures
Anthropomorphic measurements were obtained on intake during a single clinic visit by a trained nurse. Two blood pressure measurements taken by a sphygmomanometer while seated were averaged. A whole-body dual-energy X-ray absorptiometry scan was used to quantify measured lean body mass. Measurements were obtained on a Hologic Discover dual-energy X-ray absorptiometry scanner (Hologic Inc., Waltham, Massachusetts, United States of America), and data analysis was performed with Hologic APEX software, version 3.0. Patients laid supine with arms at their sides. A Phillips IE 33 machine (Phillips Healthcare, Andover, Massachusetts, United States of America) was used to perform transthoracic echocardiograms on the same day as dual-energy X-ray absorptiometry scan. All echocardiographic measurements were averaged over three cardiac cycles. The 5/6 area length method was used to measure left ventricular volumes.Reference Lytrivi, Bhatla and Ko22 Left ventricular mass was measured by (epicardial volume − endocardial volume) × 1.05.Reference Lang, Bierig and Devereux23
Clinical measures of body size
Dubois method was utilised to measure body surface area.Reference Du Bois and Du Bois24 Height was raised to the 2.7 power. Previously validated sex-specific equations were used to calculate predicted lean body mass.Reference Foster, Platt and Zemel18,Reference Jackson, Henshaw and Carter19
 $${\rm{Males}}: \ln \left( {{\rm{LBM}}} \right) = - 2.9585 + 0.8208 \times \ln \left( {{\rm{height}}} \right) + 0.5607 \times \ln \left( {{\rm{weight}}} \right) + 0.0000184 \times {\rm{weigh}}{{\rm{t}}^2} - 0.0159 \times {\rm{BMI}}{{\rm{z}}^2} + 0.0135 \times {\rm{age\;}} + 0.0225 \times {\rm{African\;American}}$$
 $${\rm{Females}}:\ln \left( {{\rm{LBM}}} \right) = - 3.9361 + 0.9786 \times \ln \left( {{\rm{height}}} \right) + 0.6431 \times \ln \left( {{\rm{weight}}} \right) - 0.0118 \times {\rm{BMI}}{{\rm{z}}^2} + 0.029 \times {\rm{African\;American}}$$
Statistics
Shapiro–Wilk test was utilised to analyse the distribution of data. Independent t-test, chi-square test, and Mann–Whitney U-test were used to identify differences between racial groups. We used univariable linear regression to assess relationship between left ventricular mass and metrics of body size measurement. Natural log transformations were used to account for homoscedasticity. Independent associations between race, age, sex, body surface area, total body fat, height, predicted lean body mass, and left ventricular mass were evaluated with stepwise multivariable linear regression. Left ventricular mass indexed to measured lean body mass was used as the reference standard when assessing the accuracy of clinical measures in detecting left ventricular hypertrophy. Left ventricular mass was scaled to clinically derived body size variables using the Lambda-Mu-Sigma method to develop centile curves.Reference Cole25 Left ventricular hypertrophy was defined as left ventricular mass > 95th percentile for each body size variable. The centile curve for left ventricular mass versus measured lean body mass was used as the reference standard. We calculated the positive predictive value and negative predictive value for each anthropomorphic variable in identifying left ventricular hypertrophy. Statistical significance was defined as p-value less than 0.05. IBM SPSS Statistics software v 24 was used for statistical analysis.
Results
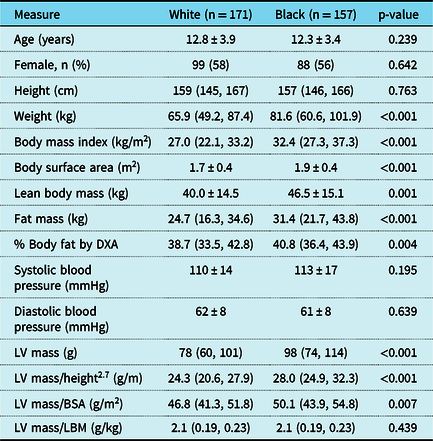
A total of 328 patients were included in this analysis. Average age was 12.6 ± 3.8 years. Mean lean body mass was 43.1 ± 10.8 kg, body surface area 1.8 ± 0.5 m2, height 154 ± 18 cm, and left ventricular mass 88 ± 38 g. Demographic information and differences between white and black patients are shown in Table 1.
Patient demographics

Each value is expressed as mean ± standard deviation or median (interquartile range)
BSA = body surface area; DXA = dual-energy x-ray absorptiometry; ht = height; LBM = lean body mass; LV = left ventricle.
Surrogates for measured lean body mass
To determine the most accurate clinically derived surrogate for measured lean body mass, univariable regression was used to determine the associations between measured lean body mass versus predicted lean body mass, body surface area, and height. The weakest correlation was between measured lean body mass and height (R2 = 0.73, p < 0.01). Measured lean body mass had a stronger relationship with body surface area (R2 = 0.93, p < 0.01). The strongest relationship of the variables was between measured lean body mass and predicted lean body mass (R2 = 0.96, p < 0.01).
Association between left ventricular mass and body size variables
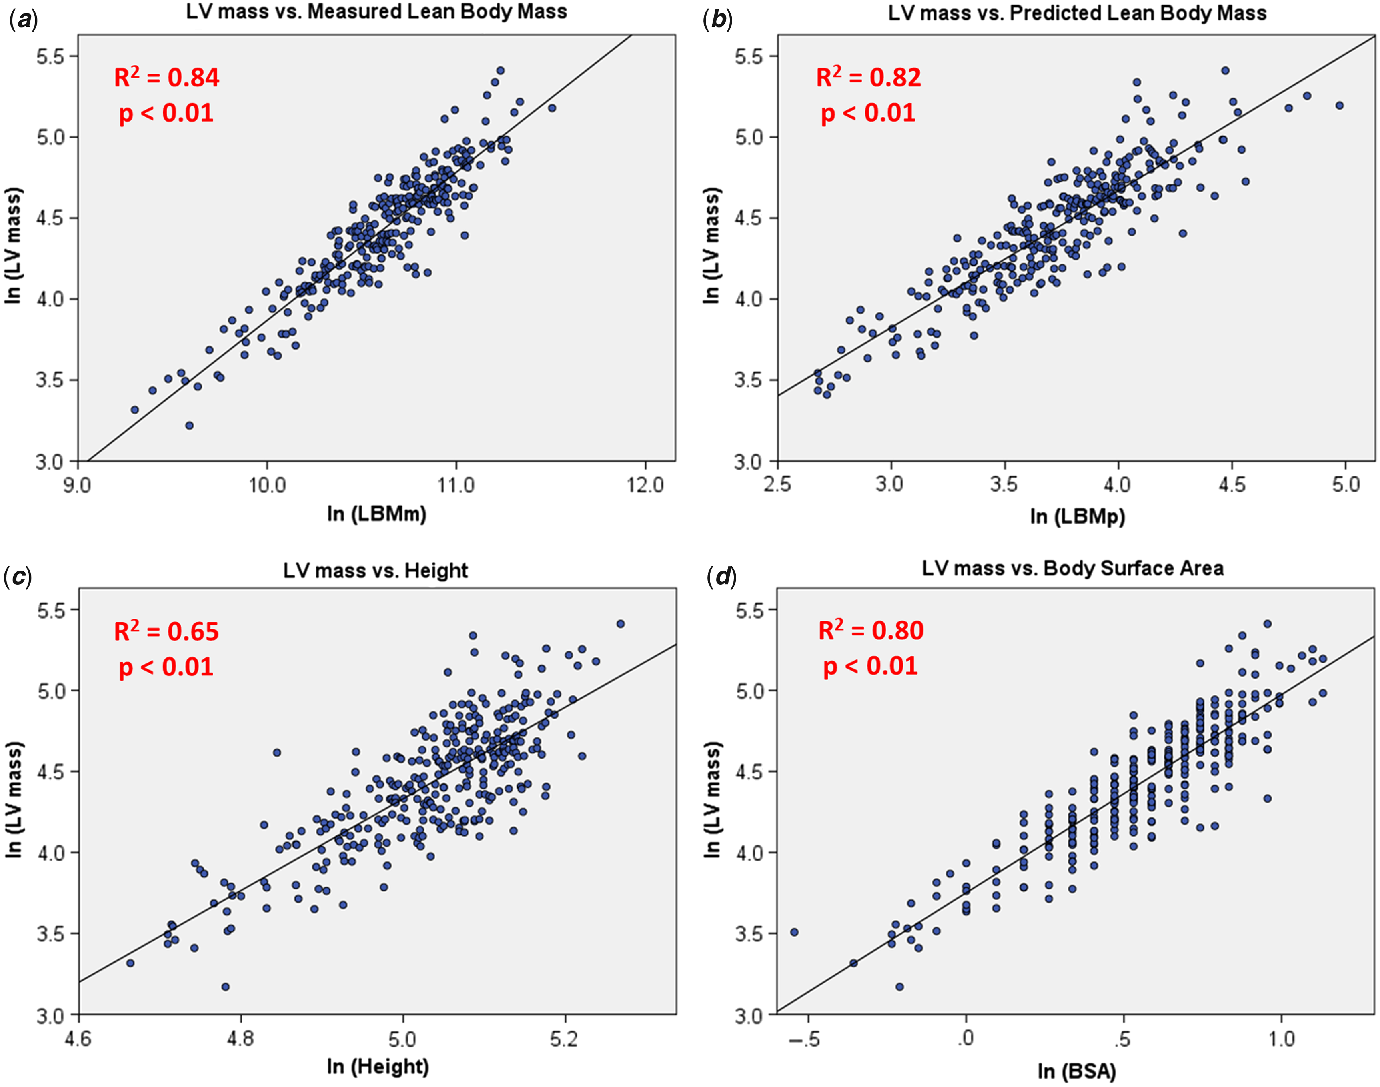
Upon univariable linear regression, left ventricular mass had the strongest relationship with measured lean body mass (R2 = 0.84, p < 0.01). Among the clinically derived scaling metrics, the weakest correlation was between left ventricular mass and height (R2 = 0.65, p < 0.01). Left ventricular mass had a stronger relationship with body surface area (R2 = 0.80, p < 0.01). The strongest relationship of the scaling variables was between left ventricular mass and predicted lean body mass (R2 = 0.82, p < 0.01). Figure 1 displays the scatterplots of these relationships. There was a very weak association between left ventricular mass and fat mass (R2 = 0.04, p = 0.02). Upon multiple variable regression, predicted lean body mass was the only clinically derived measure to have an independent association with left ventricular mass (β = 0.90, p < 0.01); height, body surface area, total body fat, age, sex, and race were not independently associated with left ventricular mass.
(a) Pearson correlation of measured LBM and measured LV mass. Lean body mass on x-axis, LV mass on y-axis. An R2 closer to 1.0 indicates increased correlation. (b) Pearson correlation of predicted LBM and measured LV mass. Lean body mass on the x-axis, LV mass on the y-axis. An R2 closer to 1.0 indicates increased correlation. (c) Pearson correlation of height and measured LV mass. Height on the x-axis, LV mass on the y-axis. An R2 closer to 1.0 indicates increased correlation. (d) Pearson correlation of BSA and LV mass. Body surface area on the x-axis, LV mass on the y-axis. An R2 closer to 1.0 indicates increased correlation. BSA = body surface area; LBMm = measured lean body mass; LBMp = predicted lean body mass; LV mass = left ventricular mass.

Accuracy in detecting left ventricle hypertrophy
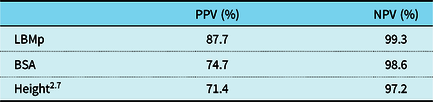
There were 15 patients who had a left ventricular mass >95th percentile when scaled to measured lean body mass – these patients were defined as having true left ventricular hypertrophy. The positive and negative predictive values of left ventricular mass scaled to predicted lean body mass, body surface area, and height2.7 in detecting left ventricular hypertrophy are reported in Table 2. Predicted lean body mass outperformed body surface area and height2.7 in both positive and negative predictive values.
Positive and negative predictive value

LBMp had both the highest PPV and NPV when compared to PPV.
BSA = body surface area; LBMp = lean body mass predicted; NPV = negative predictive value; PPV = positive predictive value.
Discussion
This is the first study to assess the accuracy of predicted lean body mass as a scaling variable for left ventricular mass in detecting left ventricular hypertrophy. Predicted lean body mass had the strongest association with left ventricular mass compared with body surface area and height. Predicted lean body mass was the only clinically derived scaling variable that had an independent association with left ventricular mass. When compared with the reference standard, predicted lean body mass was the superior scaling variable for detecting left ventricular hypertrophy. These results suggest that the use of predicted lean body mass leads to a more accurate assessment of left ventricular mass in the obese paediatric population compared to height or body surface area.
Relationship between body size scaling variables and left ventricular mass
Our results show that measured lean body mass by dual-energy X-ray absorptiometry was most strongly associated with left ventricular mass. This is in line with previous studies investigating the relationship between left ventricular mass and lean body mass.Reference de Simone, Kizer and Chinali6,Reference Foster, Gao and Mackie8,Reference Bella, Devereux and Roman12,Reference Chantler, Clements and Sharp13,Reference Daniels, Kimball and Morrison15,Reference Daniels, Kimball and Morrison26 Our data support the notion that lean body mass is the ideal scaling variable for left ventricular mass. The development of prediction equations to estimate lean body mass based on routinely measured clinically derived variables allowed us to investigate the potential advantages of scaling left ventricular mass to predicted lean body mass versus body surface area and height. Similar to measured lean body mass, predicted lean body mass had a stronger association with left ventricular mass than body surface area or height. In addition, predicted lean body mass had better positive and negative predictive values compared to body surface area and height in detecting left ventricular hypertrophy as measured using centile curves scaling left ventricular mass to measured lean body mass. The superiority of predicted lean body mass to body surface area and height in evaluating left ventricular mass is likely due to a number of factors. First, it is most closely related to measured lean body mass – the measure most closely related to left ventricular mass.Reference Foster, Platt and Zemel18,Reference Jackson, Henshaw and Carter19 Second, scaling left ventricular mass to body surface area and height are known to have significant limitations in accounting for the increased lean body mass, and the resultant increased left ventricular mass, associated with increasing adiposity.Reference Foster, Gao and Mackie8
In this study, left ventricular hypertrophy was defined as left ventricular mass scaled to measured lean body mass >95th percentile. It is unknown if this is the ideal definition of left ventricular hypertrophy in this population. Typically, increased left ventricular mass is defined as left ventricular mass >95th percentile in normal-weight healthy children. The applicability of data derived from normal-weight children to obese children depends on the influence of excess fat mass or other unmeasured variables on left ventricular mass. When plotting an obese child on a reference centile curve, he or she will be compared to a normal weight child with similar lean body mass and less fat mass. If fat mass has negligible effect on left ventricular mass, the z scores of the obese and non-obese patients should be similar. The effect of fat mass on left ventricular mass does indeed appear to be negligible based on our data (accounted for 4% of the variance in left ventricular mass) and others.Reference Daniels, Kimball and Morrison26,Reference Foster, Khoury, Kimball, Mackie and Mitsnefes27 However, to determine if reference centile curves for left ventricular mass scaled to lean body mass are applicable to obese children, they must first be developed. Foster et al derived such centile curves in normal weight children; however, the method used to measure left ventricular mass was not comparable to our study.Reference Foster, Khoury, Kimball, Mackie and Mitsnefes27 It is possible that future studies could utilise a newly derived multicentre database of normal echocardiograms that measured left ventricular mass similar to the current study to answer these questions.Reference Lopez, Colan and Stylianou28
Potential clinical implications
Accurate left ventricular mass assessment is essential in numerous clinical applications. Children with obesity develop numerous systemic diseases, such as hypertension and diabetes. Increased left ventricular mass in these diseases represents end-organ effects and is used as markers to start medical therapies. Inaccurate assessments of left ventricular mass, therefore, result in misguided and potentially detrimental management decisions. This study shows that predicted lean body mass is the ideal scaling variable to left ventricular mass in obese children and more accurately classifies patients with abnormal left ventricular mass when compared to body surface area or height; predicted lean body mass should be strongly considered for clinical use.
The accurate assessment of left ventricular mass will be potentially useful in a number of other disease processes as obesity can affect children with structural heart disease. For example, an obese child with aortic stenosis requires an accurate assessment of left ventricular mass to determine the need for intervention. Even non-obese children may benefit. Indexing left ventricular mass to lean body mass may be useful in determining whether a child has hypertrophic cardiomyopathy versus athlete’s heart. Children receiving a heart transplant are at risk for decreased survival if they received a graft from the opposite sex. One group hypothesised that this may be due to a mismatched left ventricular mass between donor and recipient.Reference Kemna, Albers and Bradford29 Matching donor and recipient to lean body mass rather than just height and weight may be a useful way to ensure an appropriate sized graft that is received. While these potential uses are speculative, they deserve further study.
Lean body mass as a confounder to previous studies
Indexing left ventricular mass to lean body mass will also allow us to better understand the natural history and epidemiology of paediatric obesity’s relationship to adult outcomes. For example, it is well known that the prevalence of heart disease in black adults is significantly higher than that in white adults. Studies have found racial differences in markers of cardiovascular risk, such as carotid intima-media thickness and elevated left ventricular mass, in children.Reference Gardin, Wagenknecht and Anton-Culver30,Reference Whincup, Nightingale and Owen31 Some have suggested that these studies are evidence that end-organ involvement due to increased cardiometabolic risk can be detected in black patients even in childhood. However, in these previous studies, the influence of lean body mass on these markers was not assessed. This may be important as it is known that black patients have higher lean body mass versus white patients when matched for height and weight. Our group found that when lean body mass was accounted for, racial differences in carotid intima-media thickness in obese children disappeared.Reference Chowdhury, Henshaw and Friedman20 The importance of assessing lean body mass when interpreting carotid intima-media thickness was confirmed by others in the adult population.Reference Moreno, Puig and Moreno-Navarrete32 In the current study, we found that the racial differences in left ventricular mass in obese children also disappeared when left ventricular mass was indexed to lean body mass. It appears that lean body mass may be an important confounder to previous studies assessing racial differences in cardiometabolic risk. As such, future studies investigating the racial differences in cardiometabolic risk in children and adults should account for differences in lean body mass between the groups.
Strengths and limitations
The use of predicted lean body mass has several strengths. It is a non-invasive scaling metric derived from readily available clinical data using only height, weight, sex, and ancestry. Predicted lean body mass is a cost-effective method in comparison to the cumbersome and expensive process of obtaining dual-energy X-ray absorptiometry scans. In addition, it is free of the scaling biases seen with body surface area and height.
Limitations of this study include the relatively small sample size. Absence of hypertension history was part of inclusion criteria. Although beneficial in increasing homogeneity in the studied population, this may contribute to the relatively low total number of individuals identified with left ventricular hypertrophy, 15 out of 328 patients. This raises the possibility the improved positive predictive value and negative predictive value could be a statistical error related to a small sample size. In addition, the lean body mass predictive equations were developed in patients 5 years and older, and accuracy in younger children has not been evaluated. Furthermore, the cross-sectional design of the study does not allow us to assess if left ventricular mass scaled to lean body mass can predict future outcomes in these patients more accurately than left ventricular mass scaled to body surface or height.
Conclusion
Lean body mass is a strong predictor of left ventricular mass in obese children. Predicted lean body mass is an accurate anthropometric scaling variable for left ventricular mass in left ventricular hypertrophy detection. This study supports the use of predicted lean body mass for widespread clinical use as the body size correcting variable for left ventricular mass in obese children.
Acknowledgements
None.
Financial Support
This project was supported by the South Carolina Clinical and Translational Research (SCTR) Institute, with an academic home at the Medical University of South Carolina, NIH/NCATS Grant number UL1TR00062.
Conflicts of Interest
None.
Ethical Standards
The authors assert that all procedures contributing to this work comply with the ethical standards of the relevant national guidelines on human experimentation and with the Helsinki Declaration of 1975, as revised in 2008, and has been approved by the Institutional Review Board of the Medical University of South Carolina.