Pasture–fed dairy products, a class of products manufactured using the raw milk of ruminants grazing on fresh grass in pastures, gain nutritional, nutraceutical and sensorial advantages from both the feed properties and the direct exploitation of the grasslands (Bosset et al. Reference Bosset, Butikofer, Gauch and Sieber1994, Reference Bosset, Jeangros, Berger, Bütikofer, Collomb, Gauch, Lavanchy, Scehovic, Troxler and Sieber1999; Chilliard et al. Reference Chilliard, Ferlay and Doreau2001; Hauswirth et al. Reference Hauswirth, Scheeder and Beer2004; Leiber et al. Reference Leiber, Scheeder, Wettstein and Kreuzer2004, Reference Leiber, Kreuzer, Nigg, Wettstein and Scheeder2005; Elgersma et al. Reference Elgersma, Tamminga and Ellen2006). These advantages are due to either the direct transfer of specific chemical compounds from grass to milk or the transformation or the de novo synthesis of substances by the rumen microflora and animal metabolism (Prache, Reference Prache2007). Previous studies pointed out that many compounds are found in milk and dairy products in different concentrations depending on the type of pasture grazed. Fatty acids (Collomb et al. Reference Collomb, Butikofer, Sieber, Jeangros and Bosset2002; Guichard et al. Reference Guichard, Leconte, Picoche, Pagés and Simon2006; Falchero et al. Reference Falchero, Coppa, Fossi, Lombardi, Lonati and Cavallero2008) and volatile compounds (Dumont & Adda, Reference Dumont and Adda1978; Viallon et al. Reference Viallon, Verdier-Metz, Denoyer, Pradel, Coulon and Berdagué1999, Reference Viallon, Martin, Verdier-Metz, Pradel, Garel, Coulon and Berdagué2000; Coulon & Priolo, Reference Coulon and Priolo2002; Martin et al. Reference Martin, Buchin and Hauwuy2005a; Guichard et al. Reference Guichard, Leconte, Picoche, Pagés and Simon2006) are affected in particular.
In a pasture-fed dairy production system, the nutraceutical and sensorial characteristics of milk and dairy products are affected by the chemical composition of the predominant vegetation type exploited by dairy animals. Among the main vegetation types identified in the Italian Western alpine pastures (Bornard & Bassignana, Reference Bornard and Bassignana2001; Cavallero et al. Reference Cavallero, Aceto, Gorlier, Lombardi, Lonati, Martinasso and Tagliatori2007), alpine clover (Trifolium alpinum) and red fescue (Festuca nigrescens) types assume great importance for PDO mountain cheese production. Consumers should be guaranteed through correct, objective and scientific-based information, about both the geographic and the botanical origin of these dairy products.
Identifying plant biomarkers, in particular terpenes, carotenoids and phenolic compounds, is the most commonly used investigation approach for the traceability of pasture-fed dairy products (Besle et al. Reference Besle, Lamaison, Dujol, Pradel, Fraisse, Viala and Martin2005; Martin et al. Reference Martin, Verdier-Metz, Buchin, Hurtaud and Coulon2005b; Prache et al. Reference Prache, Cornu, Berdaguè and Priolo2005; Engel et al. Reference Engel, Ferlay, Cornu, Chilliard, Agabriel, Bielicki and Martin2007). Terpenes and other volatiles are usually identified in pasture vegetation, in milk and in dairy products as individual chemical compounds, using gas-chromatographic (GC) techniques after headspace enrichment and a separation step (Toso et al. Reference Toso, Procida and Stefanon2002; Fernandez et al. Reference Fernandez, Astier, Rock, Coulon and Berdagué2003; Tornambé et al. Reference Tornambé, Cornu, Pradel, Kondjoyan, Carnat, Petit and Martin2006). However, these techniques are not suitable for use as routine traceability tools and for discrimination purposes, due to their laboriousness (Pillonel et al. Reference Pillonel, Ampuero, Tabacchi and Bosset2003; Pardo & Sberveglieri, Reference Pardo and Sberveglieri2005), the high costs of the equipment (Trihaas et al. Reference Trihaas, Vognsen and Nielsen2005), and the fact that they are not exhaustive for headspace chemical characterization (Carpino, Reference Carpino2008). Some ‘rapid’ approaches, such as Front Face Fluorescence Spectroscopy (FFFS, Karoui et al. Reference Karoui, De Baederdemaeker and Dufour2008) and Electronic Nose (E-Nose) analysis, have been developed to overcome these drawbacks. E-Nose, in particular, is a very simple, inexpensive device that can rapidly display a fingerprint of each new sample which can then be compared with a previous pattern. This all-encompassing information does not identify or quantify each headspace component, instead it describes the headspace of the sample through the pattern obtained from the interaction between the volatile compounds and E-Nose sensors.
Reports of milk analysis, using different types of E-Nose, refer to discriminating patterns that depend on different levels of adulteration (Yu et al. Reference Yu, Wang and Xu2007), ageing (Capone et al. Reference Capone, Epifani, Quaranta, Siciliano, Taurino and Vasanelli2001), off-flavours and bacteria (Ampuero & Bosset, Reference Ampuero and Bosset2003). Other works have investigated cheeses according to type (Jou & Harper, Reference Jou and Harper1998), geographical origin (Pillonel et al. Reference Pillonel, Ampuero, Tabacchi and Bosset2003), ripening time (Trihaas et al. Reference Trihaas, Vognsen and Nielsen2005) or correlation between E-Nose responses and sensorial analysis (Drake et al. Reference Drake, Gerard, Kleinhenz and Harper2003).
This work aims at examining E-Nose patterns of Alpine milks produced by cows grazing alpine clover and red fescue pasture types, under the same grazing management and in the same site, in order to test the potential use of this device for routine control analysis of the botanical origin of milk and dairy products.
Materials and Methods
Experimental design, animals and treatments
Two groups of 9 multiparous cows in late lactation stage (216±43 dd), belonging to different rustic breeds well suited to an Alpine environment (3 Italian Red-Pie, 1 Alpine Grey, 1 Tarantaise and 4 crossbreed cows for each group) were involved in the experiment during the Summer of 2007 (11th July – 4th August) on a dairy farm in the Italian South-Western Alpine region (Alpe Valcavera – Cuneo; 2230–2440 m a.s.l.). The two groups were balanced according to their mean daily milk production (16·4±5·0 kg/d per cow).
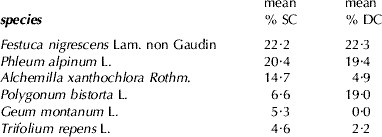
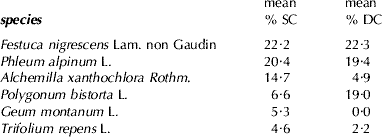
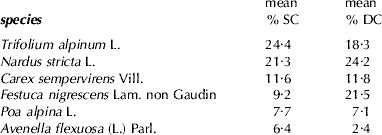
The pasture vegetation was surveyed (Daget & Poissonet, Reference Daget and Poissonet1969, Reference Daget and Poissonet1972) in order to map surfaces covered by two different vegetation types considered interesting for dairy production: the red fescue type (treatment F) and the alpine clover type (treatment T). The selected areas were then fenced to create four paddocks (2 for adaptation and 2 for the experimental trial) for each treatment. The specific composition of the pastures is reported in Table 1.
Mean Specific Compositions (%SC) of pastures (n=6), indicator of specific abundance in the sward, and mean specific Diet Contribution (%DC), indicator of diet selection: a) Festuca nigrescens type (treatment F); b) Trifolium alpinum type (treatment T). Only species with at least 4% of SC are mentioned
(a)
(b)
The paddocks (average area=1·1 hectares) were located at similar altitudes (min 2230 – max 2440 m a.s.l.), in similar lithologic (limestone), climatic and topographic conditions. The cows remained in the paddocks 24 h a day, and received no integration feeding, except mineral supplementation. Forage allowance and daily dry matter (DM) intake were estimated by the sward cutting method (Meijs, Reference Meijs1981; Smit et al. Reference Smit, Taweel, Tas, Tamminga and Elgersma2005), while animal selection at pasture was assessed using the defoliation index (Jouglet & Dorée, Reference Jouglet and Dorée1987).
The experimental design consisted in a 2×2 crossover design (Kenward & Jones, Reference Kenward and Jones2003). The herds underwent both two treatments (period 1: Group 1=treatment F; Group 2=treatment T). Both groups first spent 6 d in the adaptation paddocks, to enable the rumen to adapt completely to the vegetation type, then were moved to the trial paddocks for the same treatment, grazing for another 6 d. The groups were then crossed over (period 2: Group 1=treatment T; Group 2=treatment F), and new paddocks were exploited in the same way for another 6+6 d. The resulting instantaneous stocking density was about 60% of the carrying capacity in each paddock, which was calculated using the pastoral value method (Cavallero et al. Reference Cavallero, Rivoira and Talamucci2002).
Milk sampling and composition
During both periods, the cows were milked twice a day at 07.00 and 18.00 in the paddocks using the same type of milking machine, and the mean daily milk yield was recorded for each group.
Two series of 12 milk samples (2×1 per d in the trial paddocks) were collected from the cauldron where the milk was then processed separately for each group. Each sample consisted of 100 ml milk placed in a plastic bottle and immediately refrigerated for transport to the laboratory, where it was stored at −18°C awaiting analysis. The first series of samples was used for E-Nose analysis, the second for milk chemical composition analysis for fat, protein, lactose, casein and urea, according to AOAC standard methods (AOAC, 2007).
Electronic Nose analysis
The milk samples, which were thawed for 24 h at 4°C, were transferred as 5 ml to a 50 ml vial to analyse the aroma by E-Nose. The vials were made of glass and plugged by a Teflon cap. Neither of the inert materials caused aroma interference. The mass sample was equilibrated, as shown in a previous study on milk matrices (Masoero et al. Reference Masoero, Sala, Contarini and Moioli2007) for 1 h at 15°C. Aroma acquisition was performed using a PEN 2 (WMA Airsense Analysetechnik GmbH, Schwerin, Germany) device. This instrumentation is composed of:
• an Injection Unit made up of a Teflon (non-reactive material) tubing, connected to a pump that carried the aroma into the sensor chamber. Another valve, provided with an active charcoal filter, introduced reference air into the sensor chamber to draw the sensors to baseline conditions (the zerogas);
• a Sample Chamber, also made of Teflon, containing a heating system to mantain the temperature in the chamber at around 110°C. This high temperature catalysed the reactions between the sensors and the chemical compounds of the aroma;
• ten thick Metal Oxide Sensors (MOS), each one of a different sensitivity for a particular gas and selective for one or more classes of compounds.
The air flow is regulated by three valves. One of them sets the flow from the sample (aroma flow). Another sets the exit of the sample (gas sample) and the third draws in the reference air. The sensor response is recorded and controlled on a text file by interface unit PC software (Winmuster v.1.6 software).
During the analysis, the presence of volatile compounds induces a variation in the electrical resistance of the tin-oxide MOS sensors (conductivity G) with respect to the value in standard conditions (G0 – zerogas, the minimum of the response curve during the absorption) causing response curves. This variation is due to the reaction between the oxygen species previously adsorbed on the sensor surface and the gas mix it is exposed to.
The sampling procedure of this trial started with 70 s flushing time to bring the sensors signals to the baseline, followed by 30 s measurement for each sample. The flux was set at 400 ml/min i.e. more than twenty changes in the free vial volume.
Statistical analysis
The classical feature G/G0 was extracted from each sensor response. First, the mean G/G0 values of each sensor were calculated from measurements in the 25–30s range. This range was chosen both because the sensor responses were stable at this time, as shown in previous works (Masoero et al. Reference Masoero, Sala, Contarini and Moioli2007), and because of its suitability to follow statistical analyses requirements. The resulting 10-dimensional (10 sensor) patterns or data vectors were processed by Multivariate Analysis of Variance (MANOVA) and Linear Discriminant Analysis (LDA), in order to test the differences and to classify the milk samples according to the vegetation type grazed by the cows. Then, Modified Partial Least-Squares (MPLS) was performed on the complete dataset (30s×10 sensors) with the same goal.
Multivariate analyses
The MANOVA design was built using treatment and period as the main effects. Treatment expressed the effects due to the botanical composition of the grazed pasture, while period those variations due to the time-line, i.e. both the progression of animal lactation stage and the changes in plant phenology, resulted in a different chemical composition. The applied experimental design, using a 6 d adaptation time from the first to the second trial period, allowed the carryover effect from the first to the second treatment to be considered as null (Diaz-Uriarte, Reference Diaz-Uriarte2002).
LDA is a supervised classification method that maximizes the variance between categories and minimizes the variance within categories. This method renders the number of orthogonal linear discriminant functions equal to the number of categories minus one. There should be at least 3:1 ratio data points:variables (Massart et al. Reference Massart, Vandeginste, Deming, Michotte and Kaufman1988), but preferably more to reduce the risk of false classification caused by overfitting (Goodner et al. Reference Goodner, Dreher and Rouseff2001). Thus, the number of variables processed by LDA in this experiment was reduced by Principal Component Analysis (PCA), which was performed on the original patterns, with the aim of maintaining those factors in the analysis that explained at least 95% of the cumulated variance.
After a priori assignment of each sample to its treatment, the LDA was carried out on the modified data set using the factor scores of the selected principal components as data points. The resulting discrimination function was validated by the ‘leave-one-out’ method (full cross validation).
Chemometric analyses
In this experiment, because of the dimension of the complete autocorrelated spectra matrix, MPLS was used to discriminate the subjects that depended on the pasture types, through the relationships between the dairy matrices and the E-Nose spectra. This chemometric tool is usually preferred when within-groups variability dominates the among-groups variability, when discrimination is the final aim and when a data matrix reduction is needed (Barker & Rayens, Reference Barker and Rayens2003). With this kind of analysis, the problem of a priori choosing only a few points, parts, or peaks of the spectra can be overcome.
The olfactometric measurements of the ten MOS sensors were elaborated as contiguous arrays, in a set of 300 digits.
The data were pre-treated with Standard Normal Variate, Detrend, and the first derivative was calculated with gap 3 and smoothing 3 (1-3-3-1), in order to reduce bias. The coefficient of determination (R2cval) and standard error (SEcv) of the cross validation were used to develop and evaluate the equation (Shenk & Westerhaus, Reference Shenk and Westerhaus1996).
The software package SPSS for Windows (version 13.0; SPSS Inc., Chicago, IL – USA) was used for MANOVA and LDA statistical analyses, while WinIsi II software (Intrasoft International, Port Matilda, PA – USA) was chosen for chemometrics, using the cross validation system to assess the optimal latent number, and allowing one passage for the elimination of any outliers (t>2; H>10).
Results
Herbage intake and milk composition
Daily herbage intake was similar between the treatments (14·1±2·5 kg DM d−1 cow−1), and the species selection made by the animals reflected the specific composition of the pastures, because the equilibrated stocking rate in the paddocks allowed homogeneous exploitation of the swards, except for the low-height species, normally less selected (Dumont, Reference Dumont1996), as showed by their lower contribution to diet (Table 1).
No differences in milk yield were observed between the treatments, while the chemical composition of the milk differed only as far as the lactose content is concerned (P<0·01), which was slightly higher in F (data not shown).
Electronic Nose
Multivariate analyses
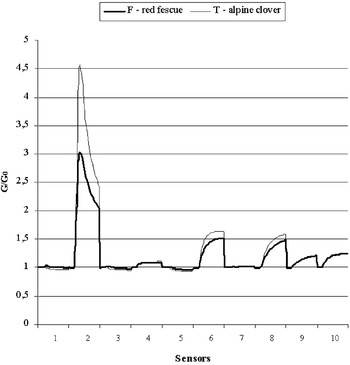
The mean values of G/G0 and the descriptive statistics from each sensor response are reported in Table 2 for both treatments. In Fig. 1 the average G/G0 values reported display a clear superiority in the signal response from the T treatment. The MANOVA analysis of the dataset pointed out significant differences among the milks according to the treatment (P<0·01), but not according to the period (P=0·313).
E-Nose spectra of the ten MOS sensors transformed into contiguous array (bold line=red fescue vegetation type; thin line=alpine clover vegetation type).

Mean G/G0 values and statistical parameters in the 25–30s range for each MOS sensor resulting from the E-Nose analysis of milk samples (n=24; F and T=mean values for treatments; SD=Standard Deviation)

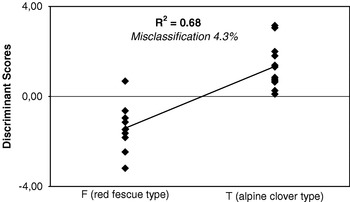
PCA performed on the complete dataset gave 4 principal components (PC), explaining 97·76% of the cumulated variance. LDA made using PC scores of the 4 PCs correctly classified 95·7% of the cases (only 1/24 sample was misclassified), and this decreased to 91·3% (2/24 samples mismatched) in cross-validation. The discriminant scores of each sample are shown in Fig. 2. While the cross-validation percentage of correct classification estimated the between-groups variance, the R2 value (0·68 as indicated in Fig. 2) supported the within-groups variance.
Combined-groups plot from LDA. The LDA scores of each milk sample were reported in ordinates, while the a priori classification according to treatment was in abscissa.

Chemometric analyses
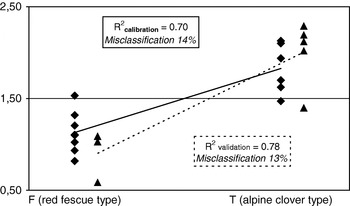
The indices for good model performance for MPLS are the low Standard Errors of Calibration and Cross-Validation (SEC and SECV), and the high R2cal and R2val. Furthermore, the correct number of regression factors for the MPLS models was determined by the lowest root mean square error of cross-validation. The MPLS prediction and validation scores are shown in Fig. 3. The determination coefficient of calibration for the pasture type grazed by dairy cows, obtained from milk samples, was 0·70, with two mismatched samples. The coefficient increased to 0·78 for validation. This validation was performed randomly splitting the data into two subsets: one for calibration, containing 2/3 of the entire dataset, and one with the remaining 1/3 of the total. Just one sample crossed over the threshold, and the overlapping was 14%.
Combined-groups plot from the calibration and validation of the MPLS classification. The abscissa represents the expected values (a priori classification according to treatment), while the ordinate represents the measured values, both in calibration (rhombus) and in validation (triangles) steps.

Discussion
The E-Nose response patterns of milk produced by the two groups of dairy cows grazing on different vegetation types were statistically different when MANOVA, LDA and MPLS were used. Discrimination ability by the statistical methods supported a high level of correct classification rate, higher than 90% in validation for LDA. MPLS showed also a good classification (78%) compared with previous works on milk matrices belonging to a wide range of samples (Masoero et al. Reference Masoero, Sala, Contarini and Moioli2007).
Thus, volatile molecules present in milk headspace reacted in different ways to the Metal Oxide Sensors of E-Nose according to the treatment, i.e. to the pasture type grazed by the dairy cows. It can be hypothesised a different fragrance from the grass carried on in the milk flavour. Further investigations will be necessary to verify the cause of such differences, also characterizing volatile composition of pasture vegetation through classical GC/MS analyses (Lombardi et al. Reference Lombardi, Falchero, Fossi, Coppa and Tava2007), and their implications on milk aroma, by linking E-Nose patterns to GC-olfactometric measures or to sensorial classifications.
There are two major issues that need to be investigated in depth in order to verify the feasibility of a ‘library’ of milk profiles by E-Nose in relation to the grazed pasture type, useful for the certification of the botanical origin of milk and dairy products as already required for the geographical origin (Pillonel et al. Reference Pillonel, Ampuero, Tabacchi and Bosset2003), and they are both related to the complexity of the mixture of species that compose a pasture type. First, alpine pastures are characterised by high biodiversity and variability of biomass production (Larcher, Reference Larcher2003). Even swards belonging to the same pasture type can have differences, particularly in the abundance of companion species, resulting in the classification in a different facies (Cavallero et al. Reference Cavallero, Aceto, Gorlier, Lombardi, Lonati, Martinasso and Tagliatori2007). Thus, the stability of E-Nose patterns of milk produced by animals grazing on pastures belonging to the same type has to be verified, in order to evaluate the effect of the botanical composition on different facies.
Second, it is known that even small changes in the plant phenological stage, and therefore in its chemical composition, could modify the concentration of plant secondary metabolites (Acamovic & Brooker, Reference Acamovic and Brooker2005; Fraisse et al. Reference Fraisse, Carnat, Viala, Pradel, Besle, Coulon, Felgines and Lamaison2007), and influence those complex physiological processes (digestive, ruminal bacterial) involved in milk synthesis and in its volatile profile in different ways. Despite this, in this trial, the E-Nose patterns were not influenced by the exploitation time (no effect of period in the MANOVA). This means that the E-Nose pattern of milk was typical for each pasture type during the 24-day trial. Such a stability has to be verified for longer periods, to check the similarity of milk patterns from the same pasture type during the entire grazing season.
During this experiment, E-Nose confirmed its usefulness as a tool for the rapid screening of milk volatile profiles, because of the simple preparation of samples, short analysis time and low cost of the analysis. The global and synthetic information obtainable from E-Nose, even though treated with different statistical methods, offered an unambiguous classification of the milks, according to their different botanical origin. Such differences could probably be noticed in cheeses produced from the processing of these milks, whose analyses will be object of future work.
Further investigations are needed to overcome the above-mentioned shortcomings of this experimental trial, in order to evaluate in depth the suitability of E-Nose to satisfy the increasing demand for new, rapid and relatively cheap methods to assure consumers about the origin and the certification of PDO mountain dairy products.
The research was partially conducted within the ‘ProAlpe’ research Project, funded by the Italian Ministries of Economy, University, Agriculture and Economic Development. Person in charge of research: Andrea Cavallero, Dept. AGROSELVITER, University of Turin – General Supervisor: Efisio Piano, CRA-ISCF.