Introduction
California has a unique pesticide tracking program whose scope and detail is not matched anywhere else in the country or in the world1. This Pesticide Use Reports (PUR) database is administered by the California Department of Pesticide Regulation (DPR). All California farmers are required to fill out detailed reports about the pesticide products applied on their fields. Farmers send their reports to their agricultural commissioner's office where they are compiled into county-wide databases. At the end of the year, DPR aggregates the databases from all 58 California counties into a single, statewide system. Over 2.5 million records of chemical applications are collected annually. This has resulted in a rich and comprehensive database of pesticide use since the inception of the program in 19901.
This paper reports on the initial findings of an ongoing research project to capture differences in pest management strategies and decision-making among growers using the California PUR database. The project represents a unique use of the PUR—examining patterns of and trends towards low pesticide use among individual growers. The PUR database served as a tool to identify growers using innovative management practices to reduce pesticide use. The project is comprised of collaborative relationships between researchers and commodity and community organizations, connecting computer-generated research results with growers on the ground.
Variation in the amount of pesticide use can be observed among farmers when they grow the same commodity within a county, and these variations of use can be associated with agronomic, socio-economic, and environmental and biological factorsReference Ridgley and Brush2. Differences in orchard age, yield histories and projections, and cost per hectare from one farm to another affect pesticide use. Socio-economic forces include government regulations, commodity prices, consumer expectations, market demands, pesticide industry representatives and Pest Control Advisors (PCAs)Reference Shennan, Cecchettini, Goldman and Zalom3. Industry standards for aesthetics or quality can influence product selection and application. Environmental causes of pesticide use variation consist of annual and regional fluctuations in rainfall and temperatures, pest outbreaks and soil conditions.
However, variations also occur as a result of grower-specific management practicesReference Brodt, Klonsky, Tourte, Duncan, Hendricks, Ommart and Verdegall4. Each pesticide application represents a choice made by the grower regarding product, timing, rate and coverage of application. Decisions to cut pesticide use are informed by such diverse practices as fostering beneficial insects, promoting cover crops, and monitoring for the spread of diseases. Some of the differences in pesticide use observed in the PUR might be attributed to: lower use rates made possible by technological advances which apply products more efficiently, as evidenced by Smartsprayer equipment; adoption of ecological management practices which can maintain field sanitation and reduce pest problems, making pesticide use less necessary; identifying pests and diseases for action thresholds; and intentional avoidance of problem pesticides by planning and experimenting with reduced-risk materials. [Reduced-risk is defined according to the Environmental Protection Agency's (EPA) Conventional Reduced-Risk Pesticide Program which reviews ‘conventional pesticides that meet criteria which indicate that they pose less risk to human health and the environment than existing conventional pesticides. Conventional “Reduced-Risk” pesticides have one or more of the following advantages over existing conventional pesticides: (1) low impact on human health, (2) lower toxicity to non-target organisms (birds, fish, plants), (3) low potential for groundwater contamination, (4) low use rates, (5) low pest resistance potential, and (6) compatibility with Integrated Pest Management (IPM) practices’ (EPA5).]
Growers are often the best innovators of new ideas and techniques. Despite a history of university extension that ‘deals in universals: principles that are true for all times and places’Reference Richards6, research institutions are increasingly recognizing that technologies must allow for and be responsive to grower adaptationReference Warner7. Growers are intimately familiar with their agricultural systems and are able to assess the factors affecting production. They must absorb and respond to complex, dynamic and unpredictable conditionsReference Chambers, Arnold and Thrupp8, Reference Glynn, McDonald and Tette9. The agro-ecological understanding growers learn through time allows them to develop approaches suited to their particular situations. Growers who decrease reliance on chemicals do so through knowledge of local ecological processesReference Bugg, Van Horn, Hamilton, Tassie and Hays10, 11. Their accomplishments are the result of practical experimentationReference Selener, Chenier and Zelaya12.
Materials and Methods
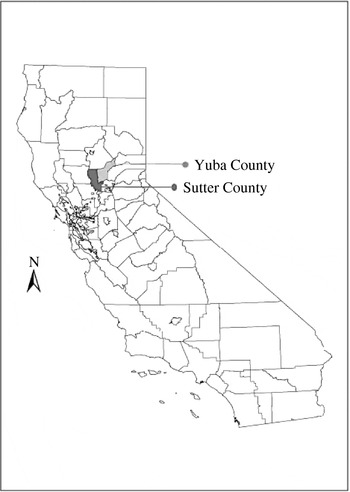
PUR from 1993 to 2000 (CDPR1) were used in this study. Thirty-two data items are recorded in each PUR, including the commodity treated, the number of hectares planted, the number of hectares treated, the active ingredients (AIs), the kilograms of chemicals used, the dates of application, and method of application. Grower and farm level analysis was achieved by tracking the unique identification numbers assigned to growers and their fields. This research project focused on PUR data gathered from prune orchards in Yuba and Sutter counties which border each other north of Sacramento (Fig. 1). These counties were selected for analysis since they are representative of statewide production trends, within the top 80% of total yield for prunes, and serviced by the project's collaborating organizations. Project collaborators include the Community Alliance with Family Farmers (CAFF), The Nature Conservancy (TNC), and the California Dried Plum Board (CDPB).
Study area, location of Sutter and Yuba counties in California.

A Geographic Information System (GIS) program was used to retrieve and organize PUR data. The data were then summarized by county, commodity, and year, and sorted by individual chemicals for the eight-year period between 1993 and 2000 to assess the use trend. Finally, field pesticide applications and grower-specific pest management histories were examined. Fields were chosen as the primary unit of measurement. Pesticides reported on each field were subjected to the qualitative assessment and quantitative measurements described below. Growers were chosen as the primary unit of pest management decision-making.
Qualitative assessments of pesticide use
Two types of qualitative assessments were made for reported pesticide use: by target organism (insecticide, fungicide, miticide and herbicide) and by risk category as established by the Food Quality and Protection Act (FQPA) priority categories I, II and III5. FQPA categories I and II are considered higher-risk while category III chemicals are ‘soft’ pesticides or biopesticides. Insecticides and fungicides were selected for intensive study because they were the most heavily and frequently used chemical types for prunes (by kg of AI) and are being addressed by pesticide reduction and substitution efforts.
Insecticides were separated into dormant and in-season use categories due to differences in exposure risk, water quality concerns, and regulations associated with the rainy versus dry season. The dormant period was defined as December 10 through February 28, while in-season was defined as March 1 through September 30, as suggested by the collaborator from the CDPB. Selected higher-risk insecticides included organophosphates (OPs), and reduced-risk insecticides included oils, Bacillus thuringiensis (Bt) and pyrethroids. Higher-risk fungicides included captan, iprodione, chlorothalonil, cyprodinil and propiconazole, and reduced-risk fungicides included sulfur and copper.
Quantitative assessments for individual grower profiles
Two types of quantitative measurements were made for reported pesticide use: use intensity (kg AI per ha crop planted) and use rate (kg AI per ha crop treated). Simple statistics were used for analysis. Three different layers of variations in pesticide use were examined: county, chemical, and grower. First, county-wide trends provided a backdrop of average pesticide use from which to compare best practices. Next, differing use intensities for selected chemicals were examined against the county average to identify innovative growers who chose lower-risk pesticides and demonstrated low use intensity or low use rates. Finally, use intensity for individual AIs was developed by segregating the kg AI per ha crop planted into five categories: very-low, low, moderate, high, and no use. Each category reflects the proportion of use relative to the county average. Very-low use was defined as between 1 and 25% of the county average of the kg AI per ha crop planted of a particular chemical. Low use was defined as 25–50%; moderate as 50–100%; and high as over 100%. No use fields did not use any of the individual chemicals.
In order to identify innovative patterns and trends, a series of filters was applied to the data aggregated at the grower level. The filters included: low to moderate number of AIs of chemical groups of interest; few or no pesticides from the FQPA priority I list; low use rates and intensity of fungicides and insecticides; low number of applications by chemical; low percentage of hectares treated or spot treatments; and consistently low or decreasing rates of use from 1998 to 2000 to help eliminate young orchards, outliers, and inconsistent practices.
By concentrating on very-low, low, and no use rates, we sought to develop profiles of growers applying especially modest amounts of pesticides. ‘Profiles’ are a comprehensive log of all chemicals and products applied on each field of a given grower. They describe the schedule of applications by listing the AIs and quantities used, the kg AI per ha crop planted, the percent of the field treated, and the number and date of applications. We searched for growers with low use of higher-risk chemicals and/or use of reduced-risk pesticides. Additionally, growers who showed no use of a particular chemical type were identified. The compound criteria prevented an overly narrow scope by recognizing the numerous avenues through which growers can experiment with reduced pesticide use. This permitted a variety of innovative strategies to surface.
Grower meetings and yield survey
Those growers that persisted after the filtering process were detailed into management profiles for presentation to commodity boards, community organizations and farmers at grower meetings. Collaborative research relationships are an important part of the project methods. The project collaborators participated in the research process at three stages: defining the research parameters, interpreting the results and suggesting practical applications for the outcomes.
Grower participation is especially important. First, in submitting the PUR forms they actively created the database upon which the research is built. Secondly, after initial investigation by the researchers reveals low-use growers, profiles of the applications are taken to grower meetings for evaluation. In the final phase of the research, selected low-use growers are contacted by collaborating organizations and asked to share their management practices through farmer-to-farmer exchanges.
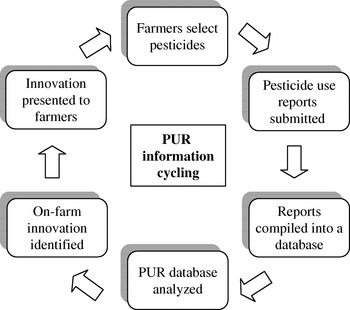
Figure 2 presents the cycling of PUR information and the delivery process that takes place. Growers select and apply pesticides, and then submit their use reports to county agricultural commissioners. DPR compiles the reports into a database. Researchers analyze the database, and are assisted in the identification of on-farm innovation by collaborators and farmers. In subsequent research phases, low-use systems are presented to growers interested in reducing pesticide use, bringing the database back to farmers.
Information cycling of PUR with on-farm analysis.

Planning and feedback meetings were held among the project collaborators on a quarterly basis between 2001 and 2002. Additionally, an article was published in CAFF's ‘Farmer-to-Farmer’ magazine to disseminate the preliminary research results and to solicit feedback from interested growersReference Oakley13. The ongoing research results were presented first to the CDPB collaborator's project management team members and then to prune growers for their comment and review. The growers requested and participated in a yield survey of those profiles deemed of interest, and volunteered information to validate the use of these profiles. Yield data and orchard age from six growers with contrasting profiles were obtained for 1999 and 2000, and matched with the pesticide use records.
Results
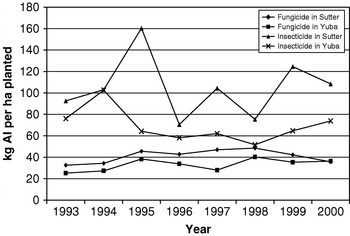
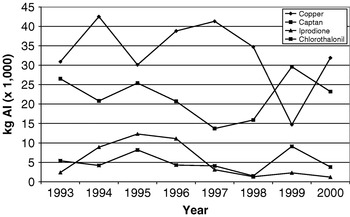
County trends from 1993 to 2000 for Yuba and Sutter indicated that the two counties had similar overall pesticide use as expressed by kg AI per ha crop planted (Fig. 3). Fungicide use increased from 25–35 kg ha−1 to close to 40 kg ha−1 for both counties, while insecticide use fluctuated over the time period with higher use intensities in Sutter County than in Yuba County (Fig. 3). Large variations were observed in insecticide use for the two counties. Analysis of data aggregated by fields and growers demonstrated evidence of pesticide use reduction as well as substitution trends towards reduced-risk products (Fig. 4). In Sutter County, copper use increased as captan use decreased (Fig. 4). The use of iprodione increased in early 1995 and then decreased after 1996. The use of captan showed a decreasing trend during the mid-1990s followed by a sharp increase in 1999, a wet year.
Insecticide and fungicide trends in Yuba and Sutter counties 1993–2000.

Sutter County fungicide trends 1993–2000.

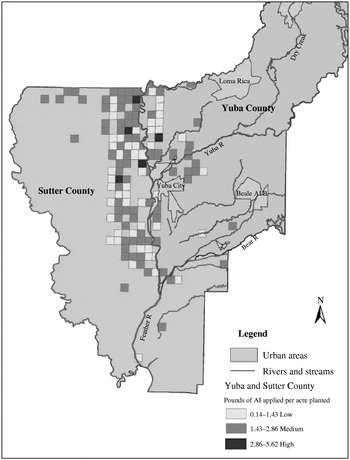
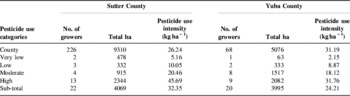
Both counties exhibited variability in pesticide use at the field and grower management levels. There are a significant number of low-use growers in each county, even after accounting for variations in geographical location within the county and acreage under cultivation (Fig. 5). The map in Figure 5 displays the distribution of the aggregated field use intensity for each of the 68 growers in Yuba County and 226 growers in Sutter County in 2000. Low, moderate, and high use growers are randomly dispersed throughout the two counties. It also demonstrates the trend towards low to medium use categories. Table 1 presents the aggregated pesticide use intensity of large growers (over 80 ha) in both counties in 2000 and their distribution within the use categories. In Sutter County, 23% of large growers were very-low or low use, 18% were moderate, and 59% were high. In Yuba County, 15% were very-low or low use, 40% were moderate, and 45% were high. The larger trend towards moderate use in Yuba County is explained in part by the fact that a higher overall percentage of growers were large as compared with Sutter; however, both counties make clear that low and moderate use intensities persist even when examining large-scale operations and are not simply a phenomenon of smaller farms.
Geographic distribution of aggregated field use rates in 2000.

Pesticide use intensity of large growers (>200 acres) in Sutter and Yuba in 2000.

In Yuba County during 2000, 4.5% of fields used no insecticides, 38% of fields used no fungicides, and 74% of fields used no herbicides. In the 2000 data for Sutter County, 9% used no insecticides, 25% used no fungicides, and 77% of fields used no herbicides. These fields represented a diversity of pesticide use patterns. Their use categories ranged from very-low to high for the AIs they did apply. Newly planted orchards and growers with small acreages were not examined, but growers who demonstrated a pattern of no use over time were analyzed in detail over 3 years. These results were significant in that they were unanticipated by the CDPB collaborators, demonstrating lower than expected use of fungicides and herbicides. Fungicides are applied preventatively, but the considerable number of no fungicide fields (38%) suggests that outreach and education efforts promoting disease monitoring have had a positive impact on pest management decision-making.
In Sutter County, 362 out of 472 fields and 98 out of 133 fields in Yuba County in 2000 showed no herbicide use. The no herbicide use fields were spread over a wide spectrum of growers, so while low fungicide and insecticide use was the primary focus of analysis, low or no herbicide use became an additional measure. The no herbicide use results suggest mowing and discing for weed control, use of cover crops and grass for beneficial insect habitat, and/or tolerance of some weed growth. Low herbicide use often reflected spot treatments, possibly in-row spraying and between row mowing, a method which has been identified among innovative growersReference Hendricks14 and encouraged by commodity and community organizations as reduced-risk.
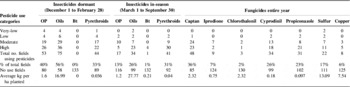
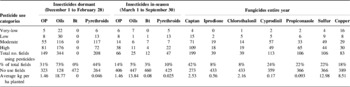
Tables 2 and 3 display the number of fields that fell into the low to high use categories for insecticides and fungicides in Yuba and Sutter County prunes in 2000. They also list the number of fields not using any of the individual chemicals (‘No Use’). Most fields used pesticides at more than 50% of county average use rates, so they were grouped into moderate and high use intensity. However, five fields out of a total of 68 were found to use OPs and pyrethroids at low rates during the dormant season, and four fields were found to use low rates of sulfur during the in-season. It is interesting to note the high percent of no use fields for each chemical. Although higher-risk insecticides and fungicides, such as OPs and Captan, were more frequently used than reduced-risk AIs (with the exception of oil), pyrethroids, and sulfur were used by a significant number of fields. Variations in intensity between Yuba and Sutter, such as copper, dormant oil, in-season oil, and pyrethroids, are reflected in the differences in low-use profiles for each county.
Number of fields using selected insecticides and fungicides in Yuba County prunes in 2000 (n=l33).

Number of fields using selected insecticides and fungicides in Sutter County prunes in 2000 (n=472).

The individual field use rates for each of the AIs listed in Tables 2 and 3 were then grouped by grower ID, making it possible to determine which growers used the fewest AIs at the lowest rates (these tables are not shown due to the large volume of data involved). This analysis helped highlight variations between and among growers, growers with similar use patterns across each of their fields, and differing strategies between a grower's fields. New orchards, organic fields, and non-productive or abandoned orchards were eliminated. Records were traced over a 3-year period to show consistency in the use patterns, to remove outliers, and to account for annual weather fluctuations and the associated impact on pest pressure and pesticide use.
From this process, 16% of the prune growers in Yuba County and 8% of the growers in Sutter County could be identified as low pesticide users. The following are examples of reduced chemical use summarized from the profiles:
• Transition to reduced-risk insecticides and fungicides from diazinon, sulfur, and propiconazole in 1998 to Bt, oil, and copper in 1999, to Bt alone in 2000.
• Reduction in AIs such as diazinon, sulfur, and propiconazole used in 1998 and 1999, to oil and esfenvalerate only in 2000.
• Consistent trend of low oil/esfenvalerate use over the 3-year period.
Since the AIs alone cannot express the management decisions behind them, the data were then taken to project collaborators for interpretation.
Insect and disease pressure fluctuate annually, and may partly explain the different use of AIs from one year to the next. However, the transition from higher-risk AIs to reduced-risk AIs suggests intentional substitution, as has been proposed by previous studiesReference Epstein, Bassein and Zalom15, Reference Zhang, Wilhoit and Gieger16. For example, the pattern in the first profile example above suggests a replacement of an OP with Bt during bloom time to control peach twig borer. Diazinon is used to target San Jose scale, peach twig borer, leaf curl plum aphid, and mealy plum aphid, and is sprayed during the dormant season. This coincides with California's rainy season, and diazinon is a key focus of storm run-off and water pollution prevention efforts. The increased use of esfenvalerate in the second example may represent a choice towards reduced environmental impact as it is an AI with compound functions.
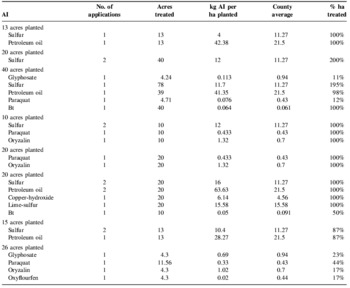
Due to the influence of multiple factors, pest management is highly variable among growers and regions. However, there were patterns of management practices among growers. Table 4 provides a sample profile of a grower in Sutter County whose management practices emphasize reduced-risk fungicides and show a trend towards reduced use of sulfur. Table 4 represents only the 2000 data, as the 1999 and 1998 are too lengthy to also be included. This grower has 65.6 ha under cultivation and spread 29 applications over eight fields in 2000. The grower used ten AIs, with an average of three AIs per field. Fungicide use was limited to sulfur and copper hydroxide, both of which are reduced-risk chemicals. Similarly, Bt and petroleum oil were the only insecticides used. Five out of the nine herbicide applications were spot treatments. The sulfur could be applied to target powdery mildew and the copper hydroxide to target peach leaf curl. Bt and oil were both only applied once on two fields, suggesting monitoring for pest thresholds rather than preventative applications. The Bt was applied in late March at a time coinciding with peach twig borer larvae emergence.
Sample low-use profile, Sutter County 2000.

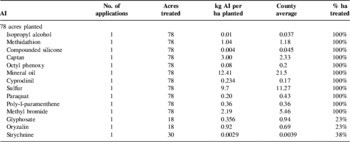
In contrast, a sample profile of average pesticide use can be seen in a Sutter County grower who used higher-risk chemicals, more AIs per field, and higher rates per chemical (the complete profile is not shown due to the large volume of data involved; however Table 5 presents a sample profile of one of the five fields). This grower had 111.6 ha under cultivation and spread 74 applications over five fields in 2000. This grower used 19 AIs, with an average of 13 AIs per field. This included two chemicals targeted for reduction: captan and methyl bromide. Insecticides, fungicides and herbicides were used on each field, generally at average to high rates with a high percent of hectares treated. The methidathion was likely applied to control San Jose scale, the captan brown rot or green fruit rot, and the methyl bromide to control nematodes.
Sample high use profile, Yuba County 2000.

Information exchange
After the analysis, the results were shared with project collaborators and farmers for interpretation and verification. Profiles like the one in Table 4 were used to deliver specific pesticide use histories of low use growers and hypothetical pest management practices. The profiles provided a comprehensive snapshot of low use records. When presented at grower meetings they proved to be an effective means of distributing information to farmers. The relevance of the profiles selected was discussed by analyzing the number of hectares under cultivation, differences in management practices between fields, AI combinations and target pests, and variations in use between years to verify that these practices were consistent with successful low pesticide use.
During a presentation of the initial results in Yuba County, growers suggested that socio-economic (pesticide costs) and environmental reasons (proximity to rivers and streams) as well as management practices might explain some of the variation in pesticide use. Growers acknowledged familiarity with the decisions behind the profiles presented, and several discussed their own experiments with reduced-use, including an esfenvalerate/oil combination. Coincidentally, one of the profiles presented at the meeting was that of a grower in attendance who is recognized for his success with alternative management systems.
It was acknowledged by farmers, regulators and scientists that it is difficult to determine if the profiled growers are viable models without corroborating economic and agronomic factors. One grower proposed that by tracing the pesticide use history and showing consistently low or decreasing rates of use, some proof of economically sensible management had already been established.
Yield data from six growers (based on their availability at the date of the field interview) from Sutter County shows that low pesticide use was not an impediment to high yield. Of the six growers surveyed, two had below average yields in 2000, two were at or above average, and two were significantly above average. One of the below average-yield growers had only 11.2 ha under production, and over half of the fruit was either under-sized or had pest damage. The other below average-yield grower experienced severe brown rot in the mid-1990s which damaged the trees. Both of the average-yield growers had young orchards and one of them experienced frost damage in 1999. Each of the high-yielding growers consistently had yields at or above 6700 kg ha−1, when the average prune yield was 5400 kg ha−1 in Sutter County in 2000. One of these growers had seven fields, used no FQPA I or II chemicals, and yielded an average of 6900 kg ha−1. The other low-use grower had 13 fields and averaged 7400 kg ha−1. To provide a point of comparison, a grower identified as a moderate to high pesticide user with 20 fields used high rates of diazinon and yielded 7200 kg ha−1.
With the assistance of the CDPB collaborator, several of the low-use growers were contacted and field visits made. For example, the low-use grower described above with 13 fields and an average of 7400 kg ha−1 does not use herbicides in his floor management plant. Instead, he uses oats and vetch, and a reseeding of radishes and mustard, as a winter cover crop. Prunes do not require clean orchard floors for harvest, and most of the cover crop is allowed to reseed before being mowed. Discing between and within the rows is used to help control perennial and summer vegetation, but the grower uses a ‘green’ orchard floor approach. He partially attributes his low use of insecticides to the beneficial insect habitat provided by his cover crop. Because he dries and packs his own fruit, he does not risk having his fruit rejected by the processor. He can therefore tolerate a certain level of damage without feeling pressured to treat his orchards. This, in turn, provides a positive feedback loop by promoting high levels of beneficial insects which give him excellent fruit quality. During the yield survey, this grower demonstrated higher than average yields, which he attributed to younger trees, appropriate varieties, and good pruning and irrigation practices. Similar innovative methods that rely on comprehensive grower management have been observed in winegrapes using the PUR analysis and were also confirmed with on-farm field visits and interviewsReference Campos and Zhang17. Field visits give researchers the opportunity to learn about the decision-making process behind reduced pesticide use first-hand from growers, providing empirical data to explain use choices.
Discussion and Conclusion
Unlike a designed field experiment, this research project is unique in that the entire population of prune growers in the two counties selected was used for the data set. Aggregation of the data at the level of individual growers allowed for identification of distinct management styles. Three major conclusions can be drawn from the research results. The first significant result is that low-use systems can be successfully identified with the PUR database. Secondly, profiles of innovative pest management strategies can be synthesized from the vast PUR data. Finally, profiles are an effective means for transferring the research information to growers in partnership with project collaborators.
In addition to their value for tracking general use trends, the PUR document variations among individual growers1. Each PUR reflects part of a grower's overall farming approach. Analyzing individual farmers’ pesticide management strategies allows the differences between growers to emerge. The variations in pesticide use documented by the PUR suggest that some growers have developed best management practices which emphasize the use of reduced-risk pesticides and draw on integrated approaches for pest and disease controlReference Brodt, Klonsky, Tourte, Duncan, Hendricks, Ommart and Verdegall4, Reference Rogers18. Identifying successful innovation with the PUR can lead to pragmatic interpretation of the database for use by farmers. Growers interested in reducing pesticide use can draw on the application histories recorded in the PUR to adapt best management practices on their own farmsReference Brodt, Klonsky, Tourte, Duncan, Hendricks, Ommart and Verdegall4. In his study of California participatory partnerships, Warner concluded that knowledge exchange between growers is an effective means of information and technology transfer to reduce pesticide useReference Warner7. The next phase of this project will emphasize the final stages described in Figure 1. Specifically, future research should analyze the success of various information exchange methods of presenting the PUR profiles, as measured by adoption rates of on-farm innovation models.
There were sufficiently large numbers of low-use patterns and growers in each county to allow the analysis to emphasize low quantity and low toxicity pesticide use. Low-use systems can be explained by a number of different factors, including cultural practices and choice of safe chemicals. For example, low or no use of herbicide may indicate cultivation of a cover crop, discing, or mowing for weed control. Growers who understand the ecology of prey–predator relationships may need fewer insecticides. The PUR database documents the timing of applications, which can help establish if the product is being used preventatively or to treat an existing problem, and if pest monitoring practices are being employed to avoid unnecessary applications11. This can be important when thinking about the impacts of pesticide use on water and air quality.
Commodity groups are essential liaisons between university researchers and farmers. They are especially helpful in contacting identified growers to inquire about their practices and their willingness to share them. Although PUR data are public information, there is often an expectation of privacy among farmers filing the reports. Thus, when profiles are presented at grower meetings, confidentiality is maintained by keeping the information anonymous. Collaborators can then follow up with the identified low use growers to develop a mechanism for farmer-to-farmer field days or other information sharing venues.
A challenge revealed by the research process has been the mixed reactions to the low-use profiles. This has been true in situations in which the profiles gave evidence of low-use systems not commonly understood or recognized within the outreach and education community. Commodity group collaborators were sometimes surprised at the result, particularly when the data revealed lower than recommended application rates. Instead of finding pesticide use clustered around recommended application rates as expected, the analysis revealed that the recommended rates reflect the upper limits of use. There was a tendency by some growers to attribute the low pesticide use to poor judgment. On the other hand, many growers expressed familiarity with the management systems behind the profiles, and expressed confidence in them.
Another limitation is that not all farmers identified through the analysis system are in fact good models: priorities other than reduced-use can determine pesticide management decisions. For example, part-time farmers do not adequately reflect the challenges of making a living from farming and may have low pesticide use as a consequence of limited management. Additionally, poor yields or low fruit quality may be associated with reduced pesticide use. Researchers must interview growers to determine if differences in use between years or trends across time are a reflection of differences in pest pressure or a conscious move towards low use.
Evaluating crop yields and quality is essential to validating pesticide use reduction. According to a CDPR Pest Management Alliance (PMA) report on almonds, reduced use of pesticides did not increase crop damageReference Heintz19. Our preliminary yield data indicate that while a few innovative growers did have sub-optimal yields, most had average or above-average results. Additional research should determine if pesticide use can be further reduced by disseminating information about best management practices for low pesticide use through farmer networks to a wider group of growers, and if yields are affected.
Mining the PUR was a successful means of identifying growers with innovative, low pesticide use management strategies, including decreasing numbers of AIs, spot treatments of higher-risk chemicals, and transition to reduced-risk products. The combined efforts of university researchers, community and commodity organizations, and growers resulted in a framework for collaboration. Summarizing the extensive PUR data into individual profiles made the PUR database an accessible tool for disseminating information about best management practices.
Acknowledgements
We acknowledge the US EPA Region 9 for the financial support of the research. We thank the community organization and commodity board representatives, Dawit Zeleke, Mark Cady, Joe Browde, Gary Obenauf, and the participating growers for their collaboration.