Introduction
In the last few decades, milk yield has been the dominating selection criterion and has still the highest average emphasis in most current breeding objectives (Miglior et al., Reference Miglior, Muir and Van Doormaal2005). The genetic correlation between milk yield and feed intake is reported to be in a range from 0.46 to 0.65 (Veerkamp, Reference Veerkamp1998). This suggests that correlated response in feed intake cannot compensate the increased energy requirements, especially at the beginning of the lactation. As the resulting enlargement of the negative energy balance post partum is assumed to be the reason for the increase of health problems and the delayed beginning of luteal activity (Veerkamp, Reference Veerkamp1998; Buckley et al., Reference Buckley, Dillon, Rath and Veerkamp2000; Collard et al., Reference Collard, Boettcher, Dekkers, Petitclerc and Schaeffer2000; de Vries and Veerkamp, Reference de Vries and Veerkamp2000; Lucy, Reference Lucy2001; Royal et al., Reference Royal, Pryce, Woolliams and Flint2002), feed intake or energy balance should be considered in breeding programmes (Veerkamp et al., Reference Veerkamp, Oldenbroek, Van Der Gaast and Van Der Werf2000; Coffey et al., Reference Coffey, Emmans and Brotherstone2001, Reference Coffey, Simm and Brotherstone2002 and Reference Coffey, Simm, Hill and Brotherstone2003). Measuring of feed intake of bull dams is only practicable in a nucleus breeding scheme (Simm et al., Reference Simm, Persaud, Neilson, Parkinson and McGuirk1991), because of the high costs to sample individual feed intake data on commercial farms.
Therefore, a scales system weighing the individual roughage intake has been installed at the dairy research farm Karkendamm (University of Kiel), where the individual performance test of bull dams of a German breeding company is located.
As the general basis for the implementation of feed intake or energy balance traits in breeding programmes, the objective of this investigation is the estimation of genetic parameters of the Karkendamm population with the intent to find out which trait should be used as a selection criterion. As traits related to the energy balance might have a different genetic background at different stages of lactation, the genetic variation of these traits should be investigated as a function of the lactation stage (Koenen and Veerkamp, Reference Koenen and Veerkamp1998; Veerkamp and Thompson, Reference Veerkamp and Thompson1999). Therefore, the use of random regression methods is recommended to analyse the relationships between these traits within the course of lactation.
At a later date when significantly more data will be available, estimation of the relationships between milk yield, feed intake, energy balance and disease liability should be realised.
Material and methods
Data
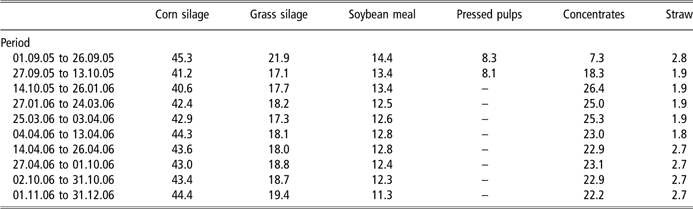
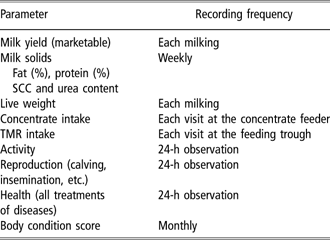
The data originate from 289 Holstein heifers descending from 92 sires. In consideration of the bull dam performance test of a German breeding company on the research farm Karkendamm, only records of first lactating cows between the 11th and the 180th day of lactation have been analysed. The cows were fed a total mixed ration ad libitum twice daily consisting mainly of corn silage, grass silage, concentrates, soybean meal and minerals (Table 1). Additionally, the cows had the possibility of taking in fixed amounts of concentrates at the concentrate feeders. Dry matter content of the ration was determined twice weekly and nutritive values were analysed by monthly samples of the components. The total mixed ration contained 7.2 MJ NEL (net energy lactation)/kg DM on average. The individual feed intake has been measured automatically since 1 September 2005 in addition to the routinely recorded data (Table 2).
Diet composition (% DM)

Recorded data at the dairy research farm Karkendamm

SCC = somatic cell count; TMR = total mixed ration.
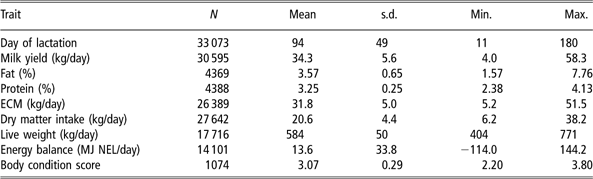
Daily energy balance (MJ NEL/day) was calculated as the difference between energy intake and estimated energy requirements for milk production and maintenance costs as a function of live weight. A summary of the analysed data is given in Table 3. The lower numbers of observations of live weights and energy balances result from the delayed installation of the animal automatic weighing system in the passageway behind the milking parlour.
Means, standard deviations (s.d.) and ranges of values (Min., Max.)

ECM = energy corrected milk (4% milk fat and 3.4% milk protein).
Modelling data
The daily observations were analysed with both fixed and random regression models considering the fixed effects test day and calving age and correcting for stage of lactation according to Ali and Schaeffer (Reference Ali and Schaeffer1987). Calving age ranged from 22 to 36 months. In contrast to months 26, 27 and 28 of calving age, there were low frequencies of observations outside this interval. Therefore, the calving age was divided into five classes (22 to 25, 26, 27, 28 and 29 to 36) for the statistical analysis. The significance of fixed effects was tested using the F-test using the procedure MIXED in the SAS-package (SAS, 2005). Potential outliers were identified and variance homogeneity was checked by plotting the standardised residuals against the predicted values. Variance components were estimated bi- and univariately by the restricted maximum likelihood (REML) using the software package VCE-5 (Kovacˆ et al., 2002) with the fixed and random regression models.
Fixed regression model:

with yijklm = observation of energy-corrected milk yield, dry matter intake, live weight, energy balance or body condition score, TDi = fixed effect of test day (i=1 to 487 for energy-corrected milk yield and dry matter intake, i = 1 to 296 for live weight and energy balance, i = 1 to 16 for body condition score), CAj = fixed effect of the calving age class (j = 1 to 5), bn = fixed regression coefficients on the lactation day d with

pk = random permanent environmental effect of animal k, a l = random additive genetic effect of the cow (l=1 to 265 for the energy-corrected milk yield, l=1 to 258 for the dry matter intake, l = 1 to 184 for the live weight, l = 1 to 172 for the energy balance and l=1 to 259 for the body condition score) and eijkl = random error.
Random regression model:

This model is similar to the fixed regression model [1]. It differs from the first model in the permanent environmental and additive genetic random effects; these are modelled by regressions with five coefficients according to Ali and Schaeffer (Reference Ali and Schaeffer1987). Analysing the body condition score, this random regression model does not converge because the number of observations per cow is low with 3.72 on average. Hence, the regression coefficients have been reduced to monomials of second degree with

Results
The residuals of all traits showed a normal distribution and the plots of the standardised residuals against the predicted values confirmed the variance homogeneity as a precondition of using linear models.
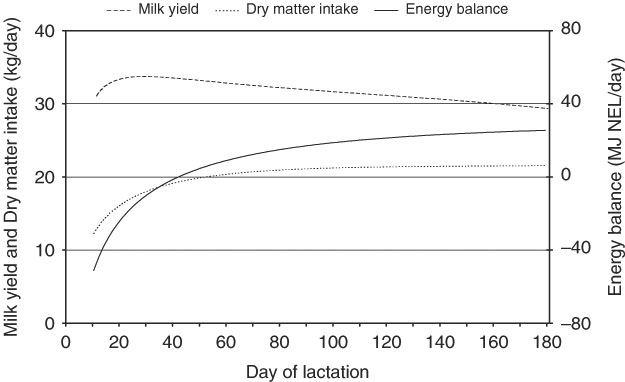
The computed lactation curves (Figures 1 and 2) demonstrate the expected delay in the increase of feed intake at the beginning of lactation. While the milk yield already reaches the peak about the third week after calving, the dry matter intake still increases till the 70th day of lactation, then it remains on a level of about 20 kg dry matter intake per day. Energy requirements are not met by energy intake, resulting in a negative energy balance until the 42nd day of lactation.
Dry matter intake, milk yield and energy balance over the course of lactation (random regression model [2]).

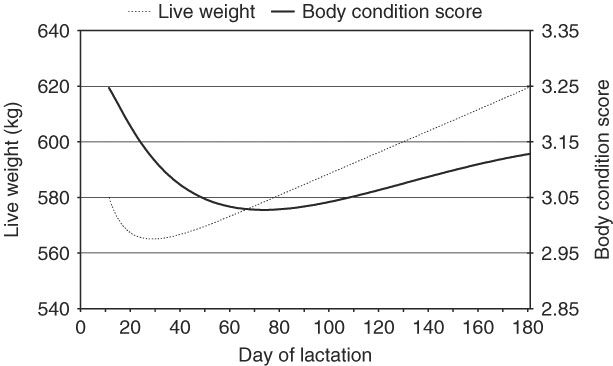
Live weight and body condition score over the course of lactation (random regression model [2]).
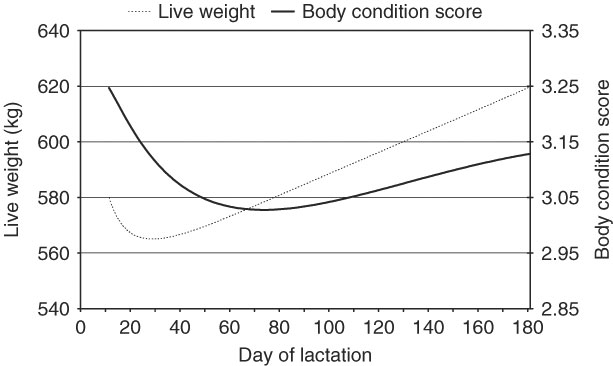
Although the heifers are in a negative energy balance, they are beginning to gain weight after the 28th day of lactation while the minimum of body condition score occurs about the 75th day of lactation.
The heritabilities and genetic correlations between the traits estimated with the fixed regression model [1] are presented in Table 4. The large s.e. of the genetic parameters are caused by the low number of animals. Heritabilities range from h 2 = 0.07 for the energy balance to h 2 = 0.53 for the body condition score. The additive genetic correlations vary between r g = −0.48 and r g = 0.65. The strongest additive genetic correlation exists between the dry matter intake and the milk yield. It has to be noted that in half of the cases, the results presented are not significantly different from zero.
Heritabilities (diagonal) and genetic correlations (above diagonal) between the daily traits energy corrected milk yield (ECM), dry matter intake (DMI), live weight (LW), energy balance (EB) and body condition score (BCS) (fixed regression model [1])

s.e. in parentheses.
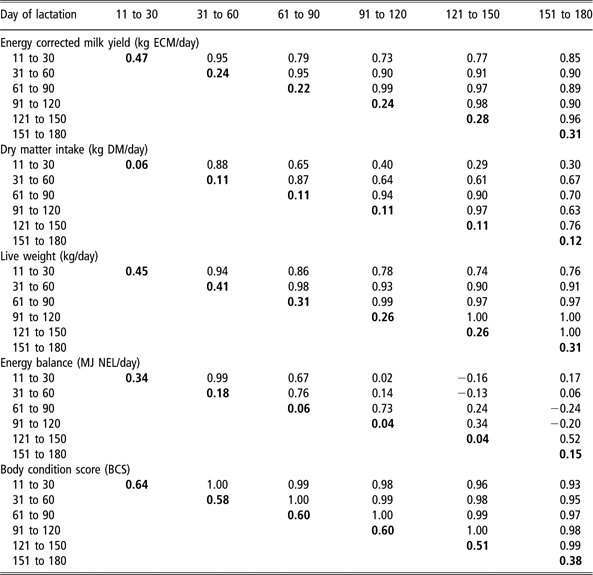
The results for the estimation of the variance components with the random regression model [2] are shown in Tables 5 and 6 for different stages of lactation. It should be noted that no s.e. are available. The correlations of the traits milk yield, live weight and condition score decline slightly from near-unity between adjacent observations to r g = 0.85 (milk yield), r g = 0.76 (live weight) and r g = 0.93 (body condition score) between observations at the beginning of lactation and the 180th day in milk.
Heritabilities (diagonal, bold) and additive genetic correlations traits (above diagonal) between different stages of lactation for the analysed traits

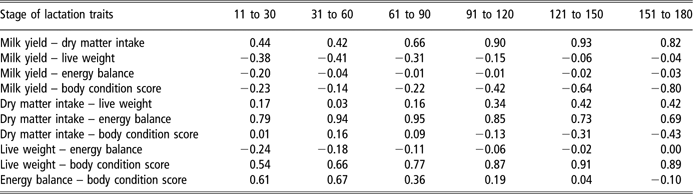
Genetic correlations between the analysed traits within stage of lactation

The genetic correlations of daily dry matter intake and daily energy balance follow a slightly different pattern from that of the other considered traits. The decrease of genetic correlations is more distinctive with increase in time intervals between the observations. Correlations between early and mid lactation are low with r g = 0.30 and 0.17 for dry matter intake and energy balance, respectively.
The additive genetic correlations between the considered traits at different stages of lactation are shown in Table 6. There are moderate positive correlations between milk yield and dry matter intake at the beginning of lactation, whereas the correlations between milk yield and other analysed traits are low and negative. The genetic relationships between dry matter intake and live weight or body condition score, respectively, are low after calving and they increase towards the end of lactation while the dry matter intake is highly correlated with the energy balance until the 180th day of lactation. As the body condition score is highly correlated with the live weight over this period, there is only a strong relationship between the body condition score and the energy balance at the beginning of lactation, which shows a distinctive decrease after the 60th day of lactation.
Discussion
Under the precondition that a negative energy balance, especially at the beginning of lactation, leads to more fragile cows, the aim of this study was the estimation of genetic parameters of milk yield, feed intake, live weight, energy balance and body condition score with random regression methods to find out whether the energy balance itself should be included into breeding programmes or whether there is another trait describing the energy balance in an appropriate way, which is not as costly to record as the energy balance.
The effects of the existent performance test of bull dams at the dairy research farm Karkendamm are reflected in the performance data and the structure of the herd. The percentage of first lactating heifers is high with 79%. Hence, higher lactating cows are not included in the analysis.
The trajectories of the mean lactation curves, given in Figures 1 and 2, are very similar to those reported in the literature (Veerkamp and Thompson, Reference Veerkamp and Thompson1999; de Vries and Veerkamp, Reference de Vries and Veerkamp2000; Coffey et al., Reference Coffey, Emmans and Brotherstone2001; Banos et al., Reference Banos, Coffey and Brotherstone2005; Beerda et al., Reference Beerda, Ouweltjes, Šebek, Winding and Veerkamp2007). Surprisingly, the heifers start gaining weight on the 30th day of lactation although they are still in a negative energy balance till the 42nd day in milk. Several reasons can be given as explanations for this time lag.
Firstly, the increasing feed intake at the beginning of lactation causes a higher gut fill, masking the changes in the live weight. Hence, the loss of live weight could not be used as an indicator of negative energy balance (Kertz et al., Reference Kertz, Reutzel and Thomson1991; Yan et al., Reference Yan, Agnew, Murphy, Ferris and Gordon2003).
Secondly, in situations of lipomobilisation, the intracellular fat is partially substituted by water (Ferrell and Jenkins, Reference Ferrell and Jenkins1984; Robinson, Reference Robinson1986; Chestnutt, Reference Chestnutt1987) and fat is predominantly used for the mobilisation of body energy (Gibb et al., Reference Gibb, Ivings, Dhanoa and Sutton1992). Thirdly, several authors noticed that cows in negative energy balance can realise a protein retention (Tamminga et al., Reference Tamminga, Luteijn and Meijer1997; Sutter and Beever, Reference Sutter and Beever2000) combined with a water retention at a ratio of 1 : 3.4 (Tamminga et al., Reference Tamminga, Luteijn and Meijer1997). Against the background that the first lactating heifers are not yet full-grown, there seems to be an anabolic effect due to the mentioned reasons. However, it must be considered that there is a certain bias in the estimation of daily energy balances.
The continuing growth of the heifers could be the reason for the delayed nadir of the body condition compared with the curve of the live weight. The decreasing body condition associated with increasing body weights (BWs) in this study is consistent with the results reported by Coffey et al. (Reference Coffey, Emmans and Brotherstone2001, Reference Coffey, Simm and Brotherstone2002 and Reference Coffey, Simm, Hill and Brotherstone2003) and McCarthy et al. (Reference McCarthy, Berry, Dillon, Rath and Horan2007). Evidently the growth of the heifers has a stretching effect that leads to a lower body condition score.
The estimation of genetic parameters was conducted with random as well as fixed regression methods to facilitate the comparability with traditional investigations using fixed regression methods. In doing so, it is assumed that the evaluated trait is uniformly expressed during the period of observation. Since this is not the case for all traits, random regression methods should be preferred to fixed regression methods when daily observations are available (Veerkamp and Thompson, Reference Veerkamp and Thompson1999; Ammon and Spilke, Reference Ammon and Spilke2004).
The heritabilities resulting from the fixed regression model are not totally consistent in magnitude with those reported in the literature (Veerkamp, Reference Veerkamp1998; Veerkamp and Thompson, Reference Veerkamp and Thompson1999; Veerkamp et al., Reference Veerkamp, Oldenbroek, Van Der Gaast and Van Der Werf2000; Coffey et al., Reference Coffey, Simm and Brotherstone2002; Karacaören et al., Reference Karacaören, Jaffrézic and Kadarmideen2006; Dechow and Norman, Reference Dechow and Norman2007). For example, the heritabilities of feed intake, milk yield, live weight and energy balance are lower than commonly assumed. This might be the consequence of the ongoing breeding programme located at the research farm Karkendamm. A comparison of the performance data of the present investigation with the material analysed by Veerkamp and Thompson (Reference Veerkamp and Thompson1999), Veerkamp et al. (Reference Veerkamp, Oldenbroek, Van Der Gaast and Van Der Werf2000), Karacaören et al. (Reference Karacaören, Jaffrézic and Kadarmideen2006) and Dechow and Norman (Reference Dechow and Norman2007) shows the high genetic merit of the herd at Karkendamm. Hence, this could explain the lower heritabilities as a result of lower genetic variation.
Six stages of lactation have been defined with a mean duration of 30 days to analyse the course of the heritabilities with progressing lactation with the random regression model. It is hard to expect a close correspondence between the results in this study with other reported genetic parameters, because especially traits like dry matter intake, BW or energy balance are predominantly estimated from experimental farm data sets with small sample sizes (van Elzakker and van Arendonk, Reference van Elzakker and van Arendonk1993; Veerkamp, Reference Veerkamp1998; Coffey et al., Reference Coffey, Emmans and Brotherstone2001; Karacaören et al., Reference Karacaören, Jaffrézic and Kadarmideen2006). Additionally, the varieties in the number of observed animals, performance levels, lactation stages, feeding systems and statistical methodologies cause differences in the obtained estimates of genetic parameters and complicate the comparison with other studies.
The trajectory of the heritability of the dry matter intake over the lactation estimated in the present study (Table 5) is similar to the one found by Berry et al. (Reference Berry, Horan, O’Donovan, Buckley, Kennedy, McEvoy and Dillon2007) on grazing cows. An increase of the heritability to a maximum around the 110th day in milk as mentioned by Koenen and Veerkamp (Reference Koenen and Veerkamp1998) and Karacaören et al. (Reference Karacaören, Jaffrézic and Kadarmideen2006) has not been identified as well as the decline of the heritability of the feed intake as published by Coffey et al. (Reference Coffey, Emmans and Brotherstone2001) and van Elzakker and van Arendonk (Reference van Elzakker and van Arendonk1993) could not be confirmed.
For the energy balance, we noticed a decreasing heritability with an increasing stage of lactation. This trajectory differs from those found by Svendsen et al. (Reference Svendsen, Skipenes and Mao1994) and Berry et al. (Reference Berry, Horan, O’Donovan, Buckley, Kennedy, McEvoy and Dillon2007), who observed increasing heritabilities. It has to be noted that a comparison with the cited studies is difficult. Svendsen et al. (Reference Svendsen, Skipenes and Mao1994) used another definition of the energy balance. In the study of Berry et al. (Reference Berry, Horan, O’Donovan, Buckley, Kennedy, McEvoy and Dillon2007), who estimated the food intake of grazing cows in Ireland, a totally different system of livestock farming (feeding regime, housing) was analysed.
The genetic correlations between different lactation stages within trait (Table 5) tend to decline with increasing time intervals between the observations, especially for the traits dry matter intake and energy balance, where low genetic correlations of r a = 0.30 and 0.17, respectively, have been estimated between the beginning and the middle of lactation. However, the corresponding correlations for live weight, milk yield and especially for body condition score are still very high. These genetic relationships confirm the investigations of Koenen and Veerkamp (Reference Koenen and Veerkamp1998), Veerkamp and Thompson (Reference Veerkamp and Thompson1999) and Coffey et al. (Reference Coffey, Emmans and Brotherstone2001), except for the high correlations within the body condition score. Coffey et al. (Reference Coffey, Emmans and Brotherstone2001) noticed a clear decline between body condition scores of different lactation stages with an increasing time interval between the observations. This non-conformity may be caused by the low number of observations of the body condition.
The weak genetic correlations between the beginning and the middle of lactation of the feed intake and the energy balance imply that different genes influence these traits in the progress of lactation. The investigations of Coffey et al. (Reference Coffey, Emmans and Brotherstone2001) show an increase of the genetic correlations between the feed intake at the beginning of lactation and observations after the 190th day in milk. Coffey et al. (Reference Coffey, Emmans and Brotherstone2001) assume that this could be the effect of nutrient partitioning at the beginning and at the end of lactation. Maybe the same genes are responsible for the allocation of the highest priority in the nutrient partitioning to the born or unborn calf.
The genetic correlations resulting from the fixed regression model [1] have high s.e. because of the small dataset. They indicate a higher relationship between the energy balance and the feed intake than between the energy balance and the milk yield as mentioned by Villa-Godoy et al. (Reference Villa-Godoy, Hughes, Emery, Chapin and Fogwell1988), Zurek et al. (Reference Zurek, Foxcroft and Kennelly1995) and Veerkamp et al. (Reference Veerkamp, Oldenbroek, Van Der Gaast and Van Der Werf2000).
The development of the genetic correlations between the traits in progress of lactation was analysed with the random regression model [2]. There are little similarities regarding the investigations of Veerkamp and Thompson (Reference Veerkamp and Thompson1999) and Karacaören et al. (Reference Karacaören, Jaffrézic and Kadarmideen2006), and it is actually difficult to recognise a common trend in the published genetic correlations between different traits in the progress of lactation.
The genetic correlations between dry matter intake and milk yield at the beginning of lactation confirm the increase of the negative energy balance in the case of exclusive breeding of milk yield. The high heritability of the energy balance at the beginning of lactation emphasises the integration of the energy balance in the selection decisions; however, the high costs to collect the energy balance data must be taken into consideration. Hence, it could be interesting to use other traits that are easier to record and highly correlated with the energy balance for the indirect selection against increasing energy deficits at the beginning of lactation. In this important lactation stage, the energy balance is highly correlated with the dry matter intake and the body condition score, respectively. Selecting on body condition score would be easier to realise and nationally recorded data could be used; however, as a consequence of the high correlations between body condition score and live weight and the well-known relationship between live weight and body height, this could lead to an undesirable growth of the cows. The use of the dry matter intake as an indirect selection trait for lower energy deficits after calving is detrimental because of the low heritability at this lactation stage. Thus, an indirect selection against high-energy deficits cannot be recommended and the energy balance itself should be used as a selection criterion at the beginning of lactation.
Therefore, breeding programmes with a performance test of the bull dams on station are necessary, because the measurement of the individual feed intake on commercial farms is unfeasible (Persaud et al., Reference Persaud, Simm and Hill1991; Simm et al., Reference Simm, Persaud, Neilson, Parkinson and McGuirk1991) and there is no agreement in the literature about the possibility to predict the individual feed intake based on behavioural traits (Stamer et al., Reference Stamer, Reinsch and Junge2000; Kaufmann et al., Reference Kaufmann, Azizi and Hasselmann2007).
Owing to the fact that no genetic correlations have been published between health traits and energy balance traits as defined by Collard et al. (Reference Collard, Boettcher, Dekkers, Petitclerc and Schaeffer2000), an analysis of this matter is intended with a prospective dataset of an ongoing project.
Meanwhile, possibly other traits should be considered as alternative approaches for a selection on the metabolic stability of ruminants. In this context, Franzolin and Dehority (Reference Franzolin and Dehority1996) found some animals with high ruminal pH although these were fed extreme concentrate-high diets. However, the direct and continuous measurement of the ruminal pH is not yet practicable in a greater extent under conditions of production. Hence, other traits related to ruminal pH, for example the passage rate, the ruminating activity or the salivary production, should be taken into account.
Conclusions
The energy balance seems to be under control of different genes, which are activated at different stages of lactation. Hence, energy balance should be analysed by random regression techniques. The resulting heritability of h 2 = 0.34 at the beginning of lactation enables the direct selection for higher energy balances. However, the practical implementation in breeding programmes cannot be recommended because of the high s.e. as a result of the limited dataset and the missing knowledge about genetic relationships between energy balance traits and health traits. Therefore, this study will be evaluated at a later date on an increased dataset paying attention to these genetic relationships.
Acknowledgements
This study was co-funded by the foundation Innovationsstiftung Schleswig-Holstein, Kiel and RSH Rinderzucht Schleswig-Holstein eG, Neumünster.