

INTRODUCTION
Neurogenesis persists in two regions of the adult brain, the subventricular zone (SVZ) along the lateral ventricle and the subgranular zone of the hippocampal dentate gyrus. In the SVZ, neural progenitor cells produce transit amplifying cells that generate neuroblasts. Neuroblasts migrate throughout the SVZ and along the rostral migratory stream (RMS) to the olfactory bulb where they replace interneurons (Luskin, Reference Luskin1993; Lois and Alvarez-Buylla, Reference Lois and Alvarez-Buylla1994). During their migration, neuroblasts are ensheathed by a subtype of astrocytes that share antigenic and functional properties with mature astrocytes (Peretto et al., Reference Peretto, Merighi, Fasolo and Bonfanti1997; Liu et al., Reference Liu, Bolteus, Balkin, Henschel and Bordey2006; Wang and Bordey, Reference Wang and Bordey2008). These astrocyte-like cells are a source of glutamate in the SVZ that can activate a mosaic of glutamate receptors on neuroblasts and control neuroblast proliferation, migration and survival (Brazel et al., Reference Brazel, Nunez, Yang and Levison2005; Di Giorgi-Gerevini et al., Reference Di Giorgi-Gerevini, Melchiorri, Battaglia, Ricci-Vitiani, Ciceroni and Busceti2005; Platel et al., Reference Platel, Lacar and Bordey2007b, Reference Platel, Dave and Bordey2008a, b, Reference Platel, Dave, Gordon, Lacar, Rubio and Bordey2010a). Glutamate release from SVZ/RMS astrocytes is Ca2+ dependent as previously shown from mature astrocytes in the parenchyma (for a review see Wang and Bordey, Reference Wang and Bordey2008). However, the physiological or pathological stimuli controlling glutamate release from SVZ astrocytes remain unknown.
A potent agent inducing glutamate release from mature astrocytes is prostaglandin E2 (PGE2; Zanotti and Charles, Reference Zanotti and Charles1997; Bezzi et al., Reference Bezzi, Carmignoto, Pasti, Vesce, Rossi and Rizzini1998; Sanzgiri et al., Reference Sanzgiri, Araque and Haydon1999). Prostaglandins, including PGE2, are potent mediators of inflammation and are produced from arachidonic acid through the action of cyclooxygenases (COX, also known as PGH synthase). PGE2 is synthesized from PGH2 by PGE synthase. Two isoforms of cyclooxygenase, COX-1 and COX-2, have been identified. Another enzyme COX-1b (also called COX-3) has no cyclooxygenase activity in mice (Kis et al., Reference Kis, Snipes, Gaspar, Lenzser, Tulbert and Busija2006). COX-1 is constitutively synthesized and is thought to carry out primarily ‘housekeeping’ functions whereas COX-2 message and protein are normally low to undetectable but are induced by pro-inflammatory or mitogenic agents. Nevertheless, microglial cells scattered throughout the SVZ have been shown to express COX-2 under normal conditions using immunohistochemistry (Goncalves et al., Reference Goncalves, Williams, Yip, Yanez-Munoz, Williams and Doherty2010). In addition, blockers of COX-2 enzymes have been shown to alter neurogenesis in the SVZ under physiological conditions (Goncalves et al., Reference Goncalves, Williams, Yip, Yanez-Munoz, Williams and Doherty2010). Similarly, injuries such as ischemia lead to increases in COX-2 and PGE synthase, increases in PGE2 levels and concomitant changes in neurogenesis (Ohtsuki et al., Reference Ohtsuki, Kitagawa, Yamagata, Mandai, Mabuchi and Matsushita1996; Nakayama et al., Reference Nakayama, Uchimura, Zhu, Nagayama, Rose and Stetler1998; Jin et al., Reference Jin, Minami, Lan, Mao, Batteur and Simon2001; Zhang et al., Reference Zhang, Zhang, Zhang and Chopp2001; Sasaki et al., Reference Sasaki, Kitagawa, Sugiura, Omura-Matsuoka, Tanaka and Yagita2003; Iwai et al., Reference Iwai, Sato, Kamada, Omori, Nagano and Shoji2003; Plane et al., Reference Plane, Liu, Wang, Silverstein and Parent2004). However, it remains unknown whether PGE2 has any functional impact on SVZ astrocytes leading to changes in ambient glutamate levels.
OBJECTIVE
The present study explores whether PGE2 induces glutamate release from astrocyte-like cells of the SVZ resulting in glutamate receptor activation on neuroblasts. NMDARs in neuroblasts were used as sensors to detect changes in ambient glutamate levels. A combination of calcium imaging, patch-clamp recordings and enzyme-linked immunosorbent assay (ELISA) were used to test the above hypotheses.
METHODS
Preparation of acute slices, acute SVZ explants and choroid plexus
Juvenile (P15-P25) CD-1 mice were anesthetized with pentobarbital (50 mg kg−1) and decapitated. Brains were removed and placed in 95% O2/5% CO2 ice-cold two-third artificial cerebrospinal fluid (ACSF) containing (in mM): 125 NaCl, 2.5 KCl, 2 CaCl2, 1 MgCl2, 1.25 NaH2PO4, 26 NaHCO3, 10 glucose and one-third sucrose-based ACSF containing (in mM): 7.5 KCl, 6 MgCl2, 1 CaCl2, 1.25 NaH2PO4, 16 NaHCO3, 10 glucose and 270 sucrose. These procedures were performed in accordance with the Institutional Animal Care and Use Committee, which is guided by US Government Principles for the Utilization and Care of Vertebrate Animals used in Testing, Research and Training. Acute coronal or sagittal brain slices (200 µm) were cut using a vibratome and placed in oxygenated ACSF at room temperature. To obtain acute explants, the SVZ was microdissected from 400 µm-thick coronal slices using a fine blade under a dissecting scope (internal diameter, 1.1 mm; Sutter Instruments, Novato, CA). The choroid plexus adjacent to the lateral ventricles was also dissected out in a similar manner. Once placed on the stage of a microscope, acute slices were continually perfused with oxygenated recording ACSF delivered by a bath application system. The recording ACSF contained (in mM): 126 NaCl, 2.5 KCl, 2 CaCl2, 1.25 NaH2PO4, 24 NaHCO3 and 10 glucose. For patch-clamp recordings, the following drugs were added (in μM): 10 glycine, 20 bicuculline (GABAA receptor antagonist) and 10 strychnine (glycine receptor antagonist), pH 7.4 when equilibrated with 95% O2/5% CO2. Both bicuculline and strychine were included because neuroblasts express functional GABAA receptors (Stewart et al., Reference Stewart, Hoge, Zigova and Luskin2002; Nguyen et al., Reference Nguyen, Malgrange, Breuskin, Bettendorff, Moonen and Belachew2003; Wang et al., Reference Wang, Krueger and Bordey2003b; Gascon et al., Reference Gascon, Dayer, Sauvain, Potter, Jenny and De Roo2006) as well as glycine receptors (unpublished observations, Platel JC).
Calcium imaging
Acute slices were loaded (45 min at 37°C) with the Ca2+-sensitive dye fluo-4 AM (4–5 µM in DMSO with 20% Pluronic acid F-127), then washed for 30 min. Most Ca2+ imaging experiments were performed on an Olympus Fluoview 300 confocal microscope equipped with a 60× objective. Experiments with bath applied PGE2 were performed on an epifluorescence microscope (BX50WI) equipped with a SensiCam super VGA Camera (PCO, Germany), a Xenon short arc lamp with a light guide (Lambda LS, Sutter), and a 40× objective (NA 0.8, WD 3.3 mm). The light exposure time was limited to 100 ms, and a neutral density filter reduced the light intensity to 25% its original intensity to minimize photobleaching. Fluo-4 images were acquired at 3-s intervals up to 75 min. Images were acquired with Slidebook OSX 4.0.1.15 (Intelligent Imaging Innovations, Inc.). The frequency of cytosolic Ca2+ increases was calculated using Calsignal (home written-software by JCP; Platel et al., Reference Platel, Dupuis, Boisseau, Villaz, Albrieux and Brocard2007a). F 0 (i.e. baseline) is the mean fluorescence intensity measured throughout all of the regions of interest, and F is the mean fluorescence intensity in a single cell. A change in fluorescence was considered to be a Ca2+ increase if it was superior to 20% F/F 0 increase. All visible cells were selected for data analysis. Data are expressed as change in fluorescence over change in baseline (ΔF/F).
Single-cell electroporation and immunohistochemistry
Single-cell electroporation was performed with an Axoporator 800A (Axon Instruments, USA) using the following: 100 Hz, 1 ms pulse for 1 s at 7 V. Single-cell electroporation was performed at the end of the Ca2+ imaging session targeting cells that responded to PGE2 with Ca2+ increases. Slices were then lightly fixed for 1 h prior to immunostaining for the astrocytic marker GLAST. Slices were washed in phosphate buffer saline (PBS), blocked for 1 h, and incubated in blocking solution (PBS + 0.3% Triton X100 + 0.3% Tween 20 + 2% BSA) containing guinea pig anti-GLAST (1:500, Chemicon, USA) overnight at room temperature. After several washes, slices were incubated with an Alexa Fluor 568 or 633 secondary antibody (1:1000, Invitrogen, USA) for 1 h at room temperature. Images were acquired on an Olympus FluoView 300 confocal microscope with a 60× oil objective.
Patch-clamp recordings
Neuroblasts were recorded in sagittal sections using the gramicidin perforated patch-clamp technique at near-physiological temperature (32–35°C) as previously described (Wang et al., Reference Wang, Krueger and Bordey2003b; Platel et al., Reference Platel, Dave, Gordon, Lacar, Rubio and Bordey2010a). The internal solution contained (in mM): 125 CsCl, 10 Hepes, 6 MgCl2, 2 EGTA, 0.1 BaCl2; pH 7.3 and 295–300 mOsmol. Single-channel data were analyzed for frequency using the single channel and threshold detection functions in Clampfit 9 (Axon Instruments). The threshold amplitude was set between −1.8 and −2 pA. Although neuroblasts express functional AMPA/kainate receptors, we did not use antagonists for these receptors because the channel amplitudes of AMPA/kainate receptors (<1 pA) are much smaller that of NMDA receptors (3 pA) (Platel et al., Reference Platel, Lacar and Bordey2007b, Reference Platel, Heintz, Young, Gordon and Bordey2008b).
PGE2 enzyme immunoassay
Dissected SVZ explants and choroid plexus samples were incubated at 37°C in an oxygen-rich environment in ACSF while placed on a fine mesh within small incubation chambers. The choroid plexus was dissected and cut into samples of the size of the SVZ explants. Tissue samples were incubated for 2 h after which the supernatant solution was collected and frozen. Tissue samples were examined using a light microscope with a 60× objective to check for the presence of the SVZ in the dissected explants. Measurements of PGE2 levels in the collected supernatant were carried out by using a commercial enzyme immunoassay kit from Cayman. The kit was used according to the manufacturer's protocol. The concentration of PGE2 in the samples was determined by comparing the optical density of PGE2 in triplicate samples with a standard PGE2 curve (7–1000 pg/ml, R 2 = 0.994).
Drug application and statistics
Data are expressed as mean ± standard error of the mean (SEM). Statistical analysis used a two-tailed t-test except where noted. Drugs were applied by either pressure (Picospritzer II, General Valves) or by bath application.
RESULTS
NMDARs are high-fidelity sensors of ambient glutamate levels
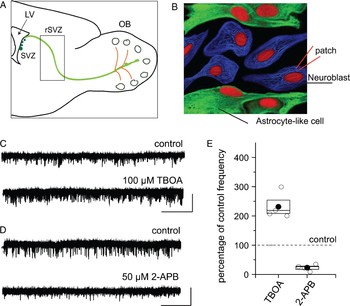
We recently reported that rostral SVZ (rSVZ) and RMS neuroblasts express functional NMDARs, the activity of which can be monitored using gramicidin-perforated patch-clamp recordings (Platel et al., Reference Platel, Dave, Gordon, Lacar, Rubio and Bordey2010a) (see diagram in Fig. 1A for location). Without perforated patch-clamp recordings, NMDA-induced current run down in less than 5 min of recordings. We thus obtained perforated patch-clamp recordings of rSVZ cells, which were identified as neuroblasts based on their biophysical properties (Wang et al., Reference Wang, Krueger and Bordey2003a, Reference Wang, Krueger and Bordeyb). Neuroblasts displayed spontaneous channel activity (Fig. 1C,D), which was significantly reduced (~90%) by the competitive NMDAR antagonist, D-2-amino-5-phosphonovaleric acid (d-APV, n = 7, data not shown), identifying them as NMDAR-mediated currents. We next used several manipulations to changes the ambient glutamate levels. Functional glutamate transporters, GLAST and GLT-1 (EAAT2 and EAAT1 in humans), are present in astrocyte-like cells (Liu et al., Reference Liu, Bolteus, Balkin, Henschel and Bordey2006). Bath application of d,l-threo-beta-benzyloxyaspartate (TBOA, 100 µM), a non-transportable blocker of glutamate transporters (Shimamoto et al., Reference Shimamoto, Lebrun, Yasuda-Kamatani, Sakaitani, Shigeri and Yumoto1998), increased the frequency of NMDAR-channel activity in rSVZ neuroblasts to 232% of control (n = 4, P < 0.05, Fig. 1C,E). These data suggest that NMDAR-channel activity is not saturated by ambient glutamate. Next, we tested the effect of the IP3 receptor antagonist 2-aminoethoxydiphenyl borate (2-APB, 50 µM) (Peppiatt et al., Reference Peppiatt, Collins, Mackenzie, Conway, Holmes and Bootman2003). 2-APB has been shown to decrease baseline Ca2+ activity in SVZ cells (Young et al., Reference Young, Platel, Nielsen, Jensen and Bordey2010). Bath application of 2-APB markedly reduced NMDAR-channel frequency to 23% of control (n = 4, P < 0.001, Fig. 1D,E), but did not affect NMDA-induced responses (n = 4, 94% of control with 2-APB, data not shown). These data suggest that IP3-related intracellular Ca2+ increases control glutamate release in SVZ cells.
NMDARs expressed in neuroblasts are reliable sensors of ambient glutamate levels. (A) Diagram showing the locations (boxed regions) of the cells recorded in the rSVZ. (B) Simplified diagram illustrating that recordings were obtained from neuroblasts ensheathed by astrocyte-like cells. (C,D) Perforated patch-clamp records of neuroblasts in the rSVZ under control conditions and following application of the broad-spectrum glutamate transporter blocker, TBOA (C) or the IP3 receptor blocker, 2-APB (D). Neuroblasts were held at −60 mV. Scale bar: 5 pA per 5 s. (E) Box plots illustrating the effects of TBOA and 2-APB treatments on NMDAR-channel frequency. Outer box: SEM, middle line (when visible): median, filled circles: mean, open circles: individual data point.

PGE2 induces NMDAR activation in neuroblasts
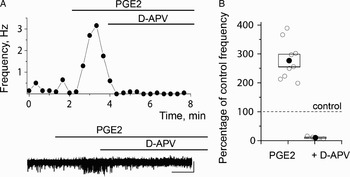
PGE2 leads to Ca2+-dependent release of glutamate from mature astrocytes (Zanotti and Charles, Reference Zanotti and Charles1997; Bezzi et al., Reference Bezzi, Carmignoto, Pasti, Vesce, Rossi and Rizzini1998; Sanzgiri et al., Reference Sanzgiri, Araque and Haydon1999). We thus used perforated patch-clamp recordings of NMDARs on neuroblasts to examine the effect of PGE2 on ambient glutamate levels in the SVZ milieu. Bath application of PGE2 (10 µM) increased channel frequency to 281% of control (n = 9, P < 0.05, Fig. 2A,B). d-APV reduced channel frequency to 9% of control in the presence of PGE2 (Fig. 2A,B), showing that PGE2-induced channel activity are mediated by NMDARs. PGE2 application had no effect on NMDA-induced currents (n = 5, data not shown). Collectively, these data show that PGE2 induces an increase in ambient glutamate levels resulting in NMDAR activation in neuroblasts. However, it remains unknown which of the SVZ cell types release PGE2. We thus examined whether PGE2-induced Ca2+ increases in SVZ cells and in particular SVZ astrocytes that share many biophysical and functional properties with mature astrocytes and release glutamate upon intracellular Ca2+ increases (Liu et al., Reference Liu, Bolteus, Balkin, Henschel and Bordey2006; Wang and Bordey, Reference Wang and Bordey2008; Platel et al., Reference Platel, Dave, Gordon, Lacar, Rubio and Bordey2010a).
PGE2 increases NMDAR activity in neuroblasts. (A) NMDAR-channel frequency as a function of time on top. Corresponding perforated patch-clamp records under control conditions and in the presence of PGE2 followed by d-APV addition at the bottom. Scale bars: 5 pA per 1 min. (B) Box plots illustrating the effects of PGE2 and PGE2 plus d-APV treatments on NMDAR-channel frequency.

PGE2 increases Ca2+ in rSVZ astrocytes
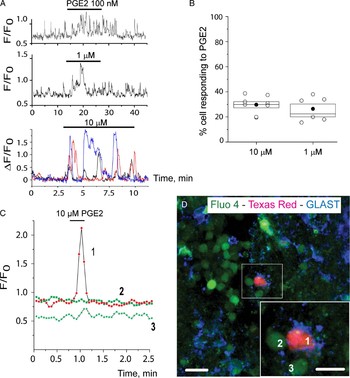
As we previously reported, SVZ cells display spontaneous Ca2+ transients (Platel et al., Reference Platel, Lacar and Bordey2007b; Young et al., Reference Young, Platel, Nielsen, Jensen and Bordey2010). Spontaneous Ca2+ events could be observed from every slice studied and from the majority of SVZ cells (~90%). The patterns of Ca2+ transients were fairly consistent for a given cell but were variable among cells at all ages studied (P20-30). Bath application of PGE2 (100 nM–1 µM, 10–15 min) induced a three- to five-fold increase in the frequency of intracellular Ca2+ transients in 21.7 ± 3.7% of the Fluo four-loaded cells (mean of 64.5 cells analyzed per slice, n = 8 slices, Fig. 3A,B). A 1 µM PGE2-induced Ca2+ transients were ~2-fold larger in amplitude than the spontaneous Ca2+ transients (see representative examples in Fig. 3A). At 10 µM, PGE2 induced sharp, repetitive increases in Ca2+ levels that were two- to four-fold larger than the spontaneous Ca2+ transients in 29.7 ± 2.5% of the cells (mean of 61.6 cells analyzed per slice, n = 8 slices, Fig. 3A,B). Such increase in intracellular Ca2+ by PGE2 is expected for Gq-coupled receptors (see the next paragraph).
PGE2 increases Ca2+ in rSVZ astrocytes. (A) Representative Ca2+ activity traces during and after PGE2 at the concentration indicated. The bar indicates the application period. The bath application was slow to prevent movement artifact and it took 1–2 min for PGE2 to reach the slice. (B) Box plots illustrating the percentage (%) of cells responding to PGE2 with a Ca2+ increase. (C) Representative Ca2+ activity graphs of the cells numbered in (E). The cell numbered 1 responded to PGE2 with a transient Ca2+ increase and was GLAST-immunopositive while cells numbered 2 and 3 did not respond to PGE2 and were GLAST-immunonegative. (D) Confocal section showing rSVZ cells loaded with Fluo-4 AM (green), a cell electroporated with Texas Red-dextran (red) and immunostaining for GLAST (blue), a marker of astrocytes.

PGE2 activates four subtypes of G-protein coupled receptors called EP1–EP4. EP1 and EP2 lead to IP3 mobilization and intracellular Ca2+ increases, and are expressed in both neurons and glia (Sugimoto and Narumiya, Reference Sugimoto and Narumiya2007). A blocker of PGE2 receptor subtypes EP1 and EP2, AH6809 (10 µM) prevented PGE2-induced Ca2+ increases (n = 4 slices, data not shown).
To determine the identity of the cells responding to PGE2, Ca2+ increases induced by PGE2 (10 µM, 30 s, pressure application) were monitored using a confocal scanning microscope and one of the cells that responded to PGE2 was subsequently electroporated with a Texas Red-dextran dye. For such experiment, PGE2 was pressure applied at 10 µM allowing us to easily identify the responding cells showing sharp and large Ca2+ increases. In addition, pressure applications shortened the length of the experiments allowing us to reduce the extent of cell movement and identify the responding cells after slice fixation and staining. After a 1-h fixation in paraformaldehyde, slices were stained for the astrocyte marker GLAST. All the Texas Red labeled cells that responded to PGE2 immunostained positive for GLAST (n = 4 cells, three slices) and cells that did not respond to PGE2 were GLAST-immunonegative (n = 15 cells, four slices, Fig. 3C,D). These experiments also revealed that some of the SVZ astrocytes identified by GLAST-immunostaining displayed spontaneous Ca2+ increases as previously reported (Young et al., Reference Young, Platel, Nielsen, Jensen and Bordey2010). Collectively, these data suggest that PGE2 increases Ca2+ in astrocyte-like cells of the SVZ.
The choroid plexus and to a lesser extent the SVZ release PGE2
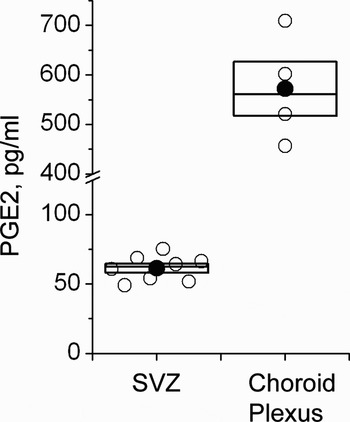
Microglial cells in the SVZ as well as the choroid plexus of the lateral ventricle have been shown to express COX-2 (Sugimoto and Narumiya, Reference Sugimoto and Narumiya2007; Goncalves et al., Reference Goncalves, Williams, Yip, Yanez-Munoz, Williams and Doherty2010). The choroid plexus produces the cerebrospinal fluid and release factors into the lateral ventricle that can directly affect SVZ cells. We thus examined whether the SVZ and the choroid plexus were a possible source of PGE2 for SVZ cells using PGE2 enzyme immunoassay. Acute SVZ explants and choroid plexus samples were incubated in ACSF for 90 min. Analysis of the supernatant solution from incubations of tissue samples demonstrated detectable levels of PGE2 in all cases. SVZ tissue samples averaged a PGE2 concentration of 54.5 ± 9.1 pg ml−1 (n = 8 explants, Fig. 4A). PGE2 levels from choroid plexus supernatant samples averaged 571.8 ± 109.2 pg ml−1 (n = 4 samples, Fig. 4A), roughly ten times the levels from SVZ tissue samples. These data suggest the existence of two sources of PGE2 for activation of EP receptors in SVZ astrocytes.
The choroid plexus and to a lesser extent the SVZ release PGE2. Box plots illustrating the concentration (pg/ml) of PGE2 released in the supernatants from SVZ and choroid plexus samples during a 90-min incubation period.

CONCLUSIONS
Using NMDARs as reliable sensors of ambient glutamate levels, we found that PGE2 increases the levels of ambient glutamate in the SVZ. In parallel experiments, we found that PGE2 increases intracellular Ca2+ levels in SVZ astrocytes. A physiological source of PGE2 is the SVZ and more likely the choroid plexus, which releases ten-fold more PGE2 than the SVZ.
DISCUSSION
Recent studies highlight the importance of glutamatergic signaling in the SVZ (for reviews see Platel et al., Reference Platel, Lacar and Bordey2007b, Reference Platel, Dave and Bordey2008a, Reference Platel, Stamboulian, Nguyen and Bordey2010b). Indeed, neuroblasts express a mosaic of glutamate receptors, including metabotropic glutamate receptors, kainate/AMPA receptors and NMDA receptors, which control the proliferation, migration and the survival of neuroblasts in the SVZ and RMS, respectively (Brazel et al., Reference Brazel, Nunez, Yang and Levison2005; Di Giorgi-Gerevini et al., Reference Di Giorgi-Gerevini, Melchiorri, Battaglia, Ricci-Vitiani, Ciceroni and Busceti2005; Platel et al., Reference Platel, Lacar and Bordey2007b, Reference Platel, Heintz, Young, Gordon and Bordey2008b, Reference Platel, Dave, Gordon, Lacar, Rubio and Bordey2010a). Additional components of the glutamatergic signaling have been reported such as the high-affinity glutamate transporters GLAST and GLT-1 and readily releasable glutamate in SVZ astrocytes (Liu et al., Reference Liu, Bolteus, Balkin, Henschel and Bordey2006; Platel et al., Reference Platel, Dave, Gordon, Lacar, Rubio and Bordey2010a). Here, we show that inhibition of glutamate transporters led to ~150% increase in ambient glutamate levels, suggesting that glutamate transporters are highly efficient at taking up released glutamate in the SVZ milieu. In addition, we identified an endogenous signal PGE2, which regulates glutamatergic signaling by controlling the release of glutamate and thus the degree of NMDAR activity in neuroblasts.
We recently reported that glutamate released from astrocyte-like cells in the SVZ was Ca2+-dependent (Platel et al., Reference Platel, Dave, Gordon, Lacar, Rubio and Bordey2010a). Here, application of PGE2 as low as 100 nM induced Ca2+ increases in ~20% of SVZ cells. SVZ astrocytes correspond to ~20% of the SVZ cell population (Doetsch et al., Reference Doetsch, Garcia-Verdugo and Alvarez-Buylla1997). Using a combination of Ca2+ imaging, single-cell electroporation and immunostaining post-imaging, we found that SVZ cells responding to PGE2 stained positive for GLAST and were thus identified as astrocyte-like cells. These findings agree with published data for mature astrocytes, which also respond to PGE2 with Ca2+ increases. In parallel experiments, PGE2 applications led to increases in ambient glutamate levels. Collectively, these data suggest that PGE2 is one of the potential mechanisms controlling ambient glutamate levels and the activity of NMDARs in neuroblasts by regulating Ca2+ activity in astrocyte-like cells of the SVZ.
Prostaglandins, including PGE2, are often viewed as mediators of inflammation. However, COX-2 expression has been reported in microglial cells scattered throughout the SVZ (Goncalves et al., Reference Goncalves, Williams, Yip, Yanez-Munoz, Williams and Doherty2010). In addition, the mRNA for PGE synthase 3 (cytosolic form) is detectable on sagittal sections containing the SVZ from the Allen Brain Atlas database. These data suggest that SVZ microglial cells may constitutively synthesize and release PGE2. In addition, these two enzymes, COX-2 and PGE synthase, are also expressed in the choroid plexus of the lateral ventricle (Smith et al., Reference Smith, Garavito and DeWitt1996; Goncalves et al., Reference Goncalves, Williams, Yip, Yanez-Munoz, Williams and Doherty2010). The choroid plexus is alongside the ependymal layer, which contains astrocytic processes (Mirzadeh et al., Reference Mirzadeh, Merkle, Soriano-Navarro, Garcia-Verdugo and Alvarez-Buylla2008). Consistent with these published data on COX-2 and PGE synthase expression, we found that the choroid plexus and the SVZ released PGE2. Intriguingly, the choroid plexus released ten-fold more PGE2 than the SVZ. The choroid plexus released 600 pg ml−1 of PGE2, which is equivalent to 1.7 nM. Cloned rat EP1 receptors have a EC50 of 37 nM for PGE2 (Boie et al., Reference Boie, Stocco, Sawyer, Slipetz, Ungrin and Neuschafer-Rube1997). These findings suggest that the choroid plexus is a major source of PGE2 under normal conditions that may be sufficient to activate EP2 receptors on SVZ astrocytes.
In conclusion, our data suggest that locally released PGE2 regulates glutamatergic signaling by controlling glutamate release from SVZ astrocytes and thus the activity of glutamate receptors in neuroblasts. This PGE2 synthesis is expected to be upregulated under pathological conditions (e.g. ischemia) and may thus contribute to the associated increase in neurogenesis.
ACKNOWLEDGEMENTS
This work was supported by a grant from the NIH (DC 007681, A.B.). We thank Dr. Anne Williamson for using her imaging system.
Statement of interest
None