


1. Introduction
The study is based on the approach developed in Reference Salamatin, Lipenkov and BlinovSalamatin and others (1994, Reference Salamatin, Vostretsov, Petit, Lipenkov and Barkov.1998a, Reference Salamatin, Lipenkov, Barkov, Jouzel, Petit and Raynaudb) and Reference Salamatin and HondohSalamatin (2000). the dominant Milankovitch components of the past surface temperature variations (geophysical metronome) at Vostok station, Antarctica, were deduced from the borehole temperature measurements. the correlation of the global climatic events (peaks and troughs) on the smoothed isotopic record to the local metronome directly yielded the geophysical-metronome time-scale (GMTS). Finally, the observed temperature–depth profile at Vostok was used to calibrate the isotopic paleothermometer. This technique is relatively new and should be practically validated in the future. Nevertheless, the method has worked satisfactorily at Vostok, and its further modification is applied here to the ice-core data from Dome Fuji (Dome F), Antarctica.Most of the problematic questions were dealt with in the above-cited papers and are not discussed here.
The absence of a sufficiently accurate and complete thermometry of the Dome F borehole confines us to a provisional study based on substitutions from Vostok for the missing information. It is assumed that the global climatic events in central Antarctica are synchronous (Reference SteigSteig and others, 1998) and the long-term isotope–temperature transfer functions are identical at Vostok and Dome F. Thus, three steps of the Dome F δ18Orecord interpretation continue the preliminary analysis of the ice core by Reference WatanabeWatanabe and others (1999), being aimed at: (1) ice-core age dating, (2) paleoclimatic reconstructions, and (3) simulation of the present-day temperature–depth distribution at Dome F. to do this, in section 2 we identify the stable-isotope peaks and troughs at Dome F with those on the metronome signal of the past surface temperature variations atVostok and extend the Vostok GMTS to the Dome F ice core. Next, in section 3 the surface-temperature–isotope relationship inferred for Vostok is used to obtain the paleotemperature fluctuations on the ice-sheet surface at Dome F. the surface temperature in central Antarctica is essentially different from the temperature at the top of the inversion layer (in clouds), and a new point of our study is that in section 4 the inversion-temperature– isotope transfer function is additionally constrained through the ice-flow model specially developed for this purpose (see Appendix). the ice-core depth age predicted from the ice-flow simulations primarily depends on the ice mass-balance history, which, in turn, is assumed after Reference Robin and deRobin (1977) to be a strong function of the inversion temperature. Therefore, the model that best fits the time-scale from the metronome also constrains the isotopic temperature. Simultaneously the ice-sheet thickness changes are calculated. Finally, in section 5 the paleoclimatic history is used to simulate the vertical present-day temperature profile at Dome F and to constrain the bottom heat flux.
2. Ice-Core Age Dating
The ice-core isotopic δ18O record from the 2500m deep borehole at Dome F (Dome-F Ice Core Research Group,
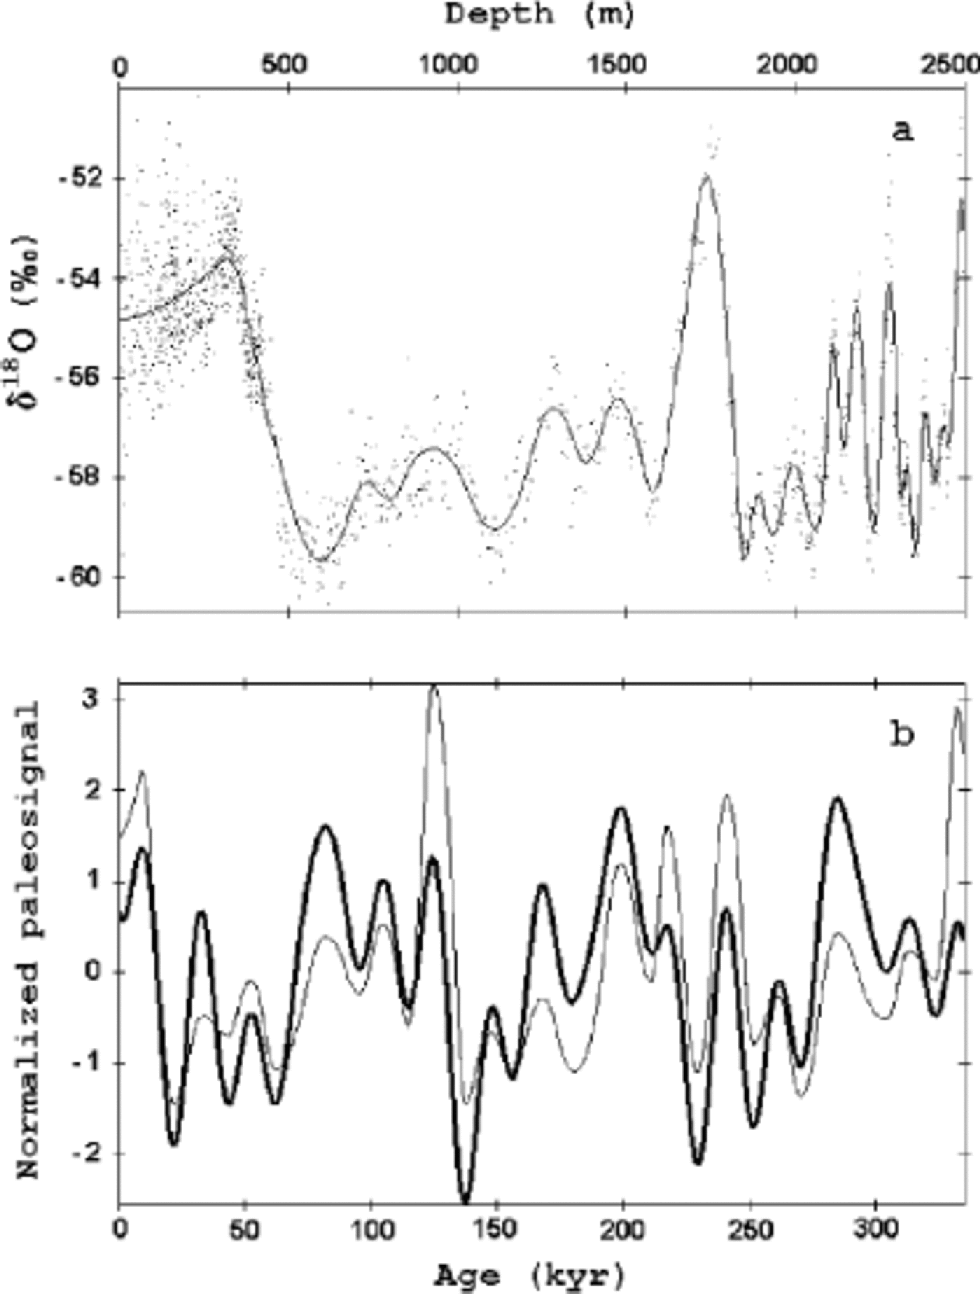
1998; Reference WatanabeWatanabe and others, 1999) and its parabolic-spline approximation are plotted in Figure 1a vs depth h. Following Reference Salamatin, Lipenkov and BlinovSalamatin and others (1994), it is assumed that Milankovitch astronomic cycles prevail in the Pleistocene climate changes, and the dominant ``metronomic’’ part of the surface temperature history Ts(t) can be expressed as a sum of harmonics with the periods τ1 =100, τ2 =41, τ3 =23, and τ4 =19 kyr:
The dating of the Dome F isotope record by its correlation with the geophysical metronome (Milankovitch components of the past surface temperature oscillations) inferred from the deep-borehole temperature profile at Vostok station. (a) the δ18O ratios measured in the 2500 m Dome F ice core (dots) and the parabolic-spline approximation (solid line) of the isotopic profile vs depth. (b) the smoothed Dome F isotope record (thin line) correlated to the Vostok metronomic signal (bold line) plotted vs time in a normalized form.

where t is the time counted from the past (t =0 is the present moment), ωi =2π/τi i(=1, . . . ;4) are the fixed frequencies, and 〈Ts〉 is the averaged surface temperature. the stacked borehole temperature profile to 3623 m depth at Vostok was used (Reference Salamatin, Vostretsov, Petit, Lipenkov and Barkov.Salamatin and others, 1998a; Reference Salamatin and HondohSalamatin, 2000) to infer the amplitudes Ai, Bi of the geophysical metronome (Equation (1)) by fitting the computed and measured temperature–depth distributions. Numerous computational tests (Reference Salamatin, Lipenkov, Barkov, Jouzel, Petit and RaynaudSalamatin and others, 1998b; Reference Salamatin and HondohSalamatin, 2000) showed that the major climatic events in the inferable paleotemperature variations on the ice-sheet surface are reliably reproducible and their ages can be used as time markers to determine the chronostratigraphy of ice-core records. the overall error of the ice-age determination (+3.5–4.5 kyr on average) was estimated as a statistical sum of the mean-square spline approximation uncertainty (~1kyr), the inherited variance in ages of single peaks and troughs in metronomic signal (~1.5–2 kyr) and the general errors of the tuning procedure (~2.5–3.5 kyr). It was also shown in Reference Salamatin, Lipenkov, Barkov, Jouzel, Petit and RaynaudSalamatin and others (1998b) that within the limits of the estimated accuracy, the dating procedure is not sensitive to a choice of climatic events (extremum or inflection points). Therefore, peaks and troughs are preferred, being better resolved in computations.
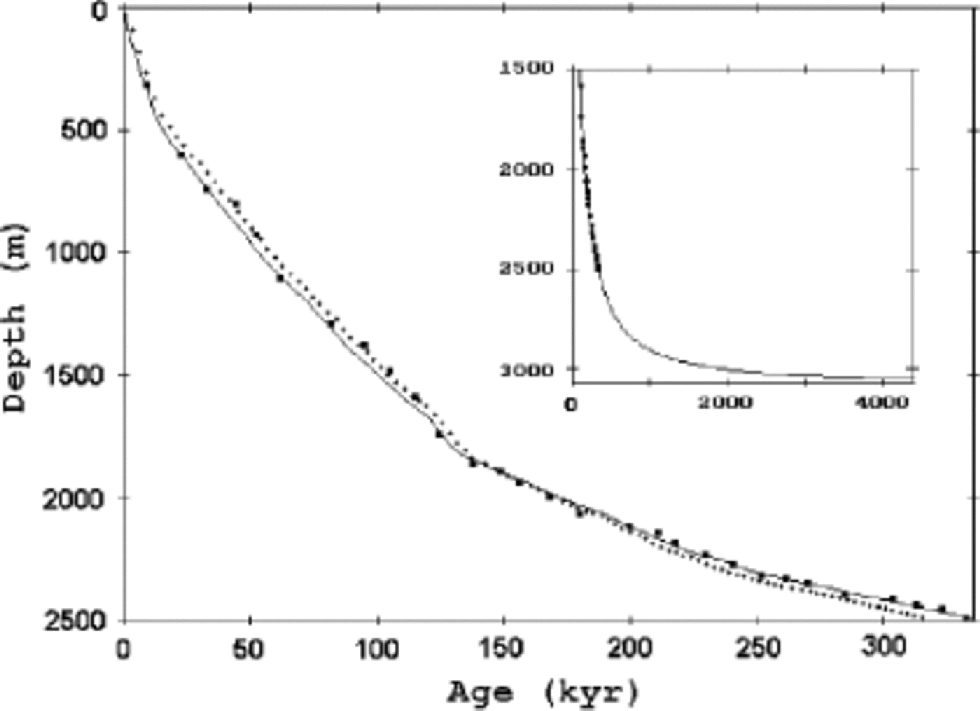
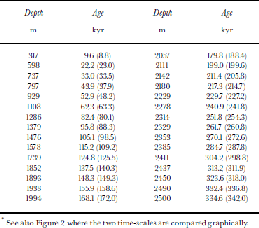
Maximums and minimums in the Dome F isotope-record spline are identified with those on the Vostok geophysical metronome (Reference Salamatin and HondohSalamatin, 2000). This directly leads to Table 1, containing the correlated depths and ages of the peaks and troughs also depicted by solid squares in Figure 2. the ice age at the borehole bottom (590m above the bedrock) is around 335+4.5 kyr. Linear interpolation between neighboring climatic events produces a continuous GMTS. the correlated isotopic and metronomic signals normalized by their standard deviations and counted from their mean values are presented in Figure 1b and look rather similar: the correlation coefficient  However, we should emphasize here after Reference Salamatin, Lipenkov, Barkov, Jouzel, Petit and RaynaudSalamatin and others (1998b) a crucial difference between the recent part of the inferred metronome remembered in the borehole temperature profile and its older part extrapolated into the far past and constrained only by the assumption about the Milankovitch periodicity prevailing in climate changes. Hence, little faith can be placed in the quantitative reality of the oscillation amplitudes revealed in the metronome signal before 25–60 kyr BP.
The Dome F ice-core chronologies: the GMTS (solid squares) deduced by the identification of peaks and troughs in the smoothed isotope record with those in the metronome (see also Table1), the continuous age–depth relation (thin solid line) based on the ice-sheet flow modeling and fitted to the Dome F GMTS to constrain the accumulation-rate variations in Equation (3), and the recently revised Dome F working time-scale (dotted line). the insert presents the extension of the ice-flow model predictions correlated with GMTS to 3050 m depth.
Dome F ice-core chronology: GMTS and ice-flow model predictions (in parentheses)*
Obviously, the dating procedure described also presumes the correlation of the two smoothed isotopic records from Vostok and Dome F vs depth. This could be used to establish the Dome F time-scale on any current Vostok core dating, whatever it is. the glaciological time-scale GT4 (Reference PetitPetit and others, 1999) could be an alternative choice. It compares to the Vostok GMTS with a standard deviation (SD) of about 8 kyr (Reference Salamatin and HondohSalamatin,2000) which is close to the best fit obtained in ice-dynamics simulations by Reference Barkov, Vostretsov, Lipenkov and Salamatin.Barkov and others (2002). Due to uncertainty of the input data needed for ice-flow modeling inVostok vicinities, GT4 errors are estimated as +10–15 kyr, and GT4’s use for Dome F core dating would hardly be better than direct ice-dynamics predictions discussed below in section 4.
Comparison of the Dome F and Vostok Last Glacial Maximum (LGM) depth levels (598 and 448 m; see Table 1 and Reference Salamatin and HondohSalamatin, 2000, respectively) results in an estimate of the present-day mass-balance rate of 3.2 cm a–1 in ice equivalent at Dome F against 2.4 cm a–1 at Vostok (Reference Barkov and LipenkovBarkov and Lipenkov, 1996), which is close to the values reported by Dome-F Ice Core Research Group (1998).
3. Paleo-Reconstruction Problem
The conventional empirical relationship between isotopic (deuterium δD or oxygen δ18O) ratios and temperature fluctuations at the top of the inversion layer δTi (both counted from the present-day level) can be written in the following general form (Reference Robin and deRobin,1977):

where δ18Osw is the correction of the isotopic signal for past changes in the oxygen-isotope composition of ocean water (Reference SowersSowers and others, 1993), and CT is the deuterium/inversion-temperature slope estimated for East Antarctica from contemporary geographical distributions of isotopes and temperatures by Reference JouzelJouzel and others (1987) as CT = 9‰ C–1.
In accordance with Reference Robin and deRobin (1977), precipitation (ice mass balance in central Antarctica) b can be correlated to the water-vapor equilibrium pressure in clouds and, consequently, to the condensation (inversion) temperature. the corresponding computational procedure was elaborated and described by Reference RitzRitz (1989,Reference Ritz1992):

Here b* is the present-day accumulation rate, and the exponential factor τb is given as  at contemporary inversion temperature
 in ˚C.
Thus, the coefficient CT in Equations (2) and (3) is a principal parameter that determines paleoclimatic reconstructions based on ice-core isotope records from the Antarctic ice sheet. Past temperatures and accumulation rates are, in turn, the climatic input of ice-sheet flow models which predict ice thickness Δ, ice-age and temperature distributions in the glacier. However, spatial and temporal estimates of the slope CT are different, and the latter appear consistently (up to 50%) lower and dependent on the time-scale under consideration (Reference JouzelJouzel and others, 1997). Deep-borehole temperature profiles provide information on past climate changes that is important for calibrating the isotopic paleothermometer (Reference Robin and deRobin, 1976; Reference Cuffey, Clow, Alley, Stuiver, Waddington and SaltusCuffey and others, 1995; Reference Johnsen, Dahl-Jensen, Dansgaard and Gundestrup.Johnsen and others, 1995; Reference Salamatin, Lipenkov, Barkov, Jouzel, Petit and RaynaudSalamatin and others, 1998b). the main difficulty arising here is that the non-stationary temperature–depth distributions in ice sheets result from the past surface temperature variations δTs that cannot be directly identified with δTi in general. As against Greenland, the inversion strength (the seasonal difference between the inversion and surface temperatures, Ti – Ts ) is very high in central Antarctica, and an additional relationship between δTi and δTs is needed to link the isotope record with the borehole temperature measurements. A proportionality δTs = δTi/Ci was deduced from present-day atmospheric observations in Antarctica. the scaling factor Ci was estimated to be 0.44 by Reference Phillpot and ZillmanPhillpot and Zillman (1970) and 0.67 by Reference Jouzel and MerlivatJouzel and Merlivat (1984). This question was also addressed by Reference Salamatin, Lipenkov, Barkov, Jouzel, Petit and RaynaudSalamatin and others (1998b) in their analysis of the temperature–depth profile at Vostok station. It was shown that the temporal variations of the ice-sheet surface temperature δTs contain a supplementary climatic signal δp(t) that does not exist in the scaled δTi (δD or δ18O records). the following generalized relation for δTs was suggested:
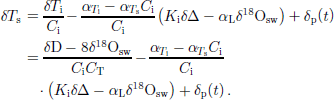
Here αTi and αTs are the inversion- and surface-temperature elevation gradients at the site under consideration  αL relates sea-level variations to the isotopic composition of sea water
 is the isostasy coefficient approximately determined for ice– rock hydrostatic equilibrium as
 where ρ0 and ρr are the densities of ice and rocks, respectively; and
 is the ice-sheet thickness deviation from its present-day value Δ* and can be simulated (Reference Salamatin and RitzSalamatin and Ritz, 1996) using Equation (3).
The second term in Equation (4) is responsible for the enhancement of the surface temperature variations induced by changes in the ice-sheet surface elevation. It was estimated as being relatively small and insignificant. Paleothermometer calibration tests (Reference Salamatin, Lipenkov, Barkov, Jouzel, Petit and RaynaudSalamatin and others, 1998b) revealed that the δp signal, although small, primarily underwent precession oscillations additionally amplified in the surface temperature fluctuations by the inversion strength. Finally, the inferable (recent) variations of δp periodically extrapolated into the past were assumed proportional to the precession harmonics of the metronome (Equation (1)):

Accordingly, the product CiCT in Equation (4) should be considered a long-term isotope/surface-temperature slope. It should be noted that the periodicity of Equation (5), although supported by certain arguments (Reference Salamatin, Lipenkov, Barkov, Jouzel, Petit and RaynaudSalamatin and others, 1998b), has not been directly validated on experimental data and may be considered a problematic assumption. Even in the latter case, a weak δp signal with amplitudes of about 1.5˚C or less (Reference Salamatin, Lipenkov, Barkov, Jouzel, Petit and RaynaudSalamatin and others, 1998b; Reference Salamatin and HondohSalamatin, 2000) would not significantly distort the paleotemperature reconstruction in the far past but permits noticeably better representation of the recent 20–25kyr climate history remembered by the borehole temperature (Reference Salamatin, Lipenkov, Barkov, Jouzel, Petit and RaynaudSalamatin and others, 1998b).
Hence, the inverse problem of the paleothermometer calibration can be formulated as a problem of minimization of the SD between the measured and modeled temperature profiles with respect to CT and αp in Equations (2–5) at a given value of Ci. All previous paleo-reconstructions for Vostok (Reference Salamatin, Vostretsov, Petit, Lipenkov and Barkov.Salamatin and others, 1998a, Reference Salamatin, Lipenkov, Barkov, Jouzel, Petit and Raynaudb; Reference Salamatin and HondohSalamatin, 2000) basically used Ci = 0.67 (Reference Jouzel and MerlivatJouzel and Merlivat, 1984) and revealed the temporal isotope/inversion-temperature slope CT to be 30–50% lower than its modern geographical estimate (Reference JouzelJouzel and others, 1987). Actually, the calibration procedure based on the borehole thermometry determines the product CiCT in Equation (4) and is not sensitive to CT in Equation (3). As a result, the uncertainty of Ci is directly transferred to CT and, consequently, to the paleotemperatures and accumulation rates predicted by Equations (2) and (3). Therefore, we need additional independent constraint to adjust the factor Ci and deduce a more accurate estimate for CT .
4. Ice-Flow Model Constraint: Discussion
Ice-sheet dynamics and, in particular, the ice age–depth distribution are primarily controlled by the ice mass balance b on the glacier surface. Obviously, the right choice of CT in Equations (2) and (3) (or Ci for a given product CiCT) must result in the ice-flow model chronology close to the GMTS. This gives us another strong constraint on the isotope–temperature transfer functions (Equations (2) and (4)) as well as a criterion of thermomechanical consistency between the ice-sheet dynamics modeling and the calibration procedure based on the borehole thermometry. A simplified parametric ice-flow model described in the Appendix has been developed to calculate the ice-core age from Equation (3). It also includes the model (Reference Salamatin and RitzSalamatin and Ritz, 1996) to simulate the ice-sheet thickness variations and may be useful in different applications.
This approach has been employed by Reference Barkov, Vostretsov, Lipenkov and Salamatin.Barkov and others (2002) to process the deep temperature–depth profile and other data from Vostok in order to reduce the uncertainty of previous reconstructions (Reference Salamatin, Vostretsov, Petit, Lipenkov and Barkov.Salamatin and others, 1998a,Reference Salamatin, Lipenkov, Barkov, Jouzel, Petit and Raynaudb;
Reference Salamatin and HondohSalamatin, 2000). the long-term isotope/surface-temperature slope and the precession amplification factor in Equation (4) are found CiCT ≈ 3.7‰ ˚C–1 and αp ≈ 0.17, and, as could be expected, do not differ much from the estimates inferred in the above-cited papers. However, an acceptable agreement (within the estimated age errors) between the GMTS and the ice-age dating based on ice-sheet flow modeling has been achieved atVostok only for 0.44 < Ci < 0.55. This range of Ci is noticeably smaller than the spatial slope (Reference Jouzel and MerlivatJouzel and Merlivat, 1984) and closer to the year-round balloon observations at Vostok site (Reference Phillpot and ZillmanPhillpot and Zillman, 1970). But still the uncertainty in CT remains rather high.
We directly apply the values of CiCT and αp established forVostok to interpret the Dome F isotope profile in terms of past temperature changes. Correspondingly, more definite estimates for Ci can now be found by fitting the ice-flow model age (solid line in Fig. 2) to the GMTS at Dome F. the minimum SD of 3.6 kyr between the two time-scales compared inTable 1is obtained at Ci ≈ 0.55 for the modified Glen’s exponent β ≈ 2.6 (see Appendix). Results of the calibration procedure are summarized in Table 2. the corresponding best-fit value of CT is 6.7‰ ˚C–1, which is about 30% lower than the present-day spatial slope (Reference JouzelJouzel and others, 1987). This provides the consistency of paleoclimatic reconstructions forVostok and Dome Fas well as the agreement between the GMTSs at the sites and the ice-flow model predictions.
Precession harmonics of geophysical metronome and parameters of isotope–temperature transfer functions
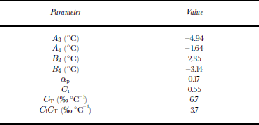
The significance of the above results should not be overestimated. This section treats Equation (3) as a temporal relationship between the temperature and accumulation rate, whereas originally it was based on the modern geographic correlation. That Equation (3) remained a good approximation for the accumulation-rate changes through time, although implicitly supported by Reference RitzRitz (1992), still is not obvious. Nevertheless, the consistency between the Dome F time-scales derived from the two methods yielding parameters Ci and CT similar to those determined for Vostok does suggest that there exists a uniform temporal relationship between temperature and accumulation rate in central Antarctica. This also supports a conclusion that at least the mean values of the accumulation rate over the long term and in the Holocene are probably well constrained.
The recently revised Dome F core dating (official working time-scale), also based on ice-sheet dynamics simulation, is shown in Figure 2 by the dotted curve. the GMTS falls between the modeled time-scales and equally compares to them until 2000m depth. Below this level, the difference between the GMTS and the new official ice-age estimates gradually grows and reaches 10–15 kyr at the borehole bottom.
Past ice-sheet surface temperature variations at Dome Fuji (Equations (4) and (5)), counted from the present-day level –57.3˚C (Dome-F Ice Core Research Group, 1998), are shown in Figure 3 together with the Vostok geophysical metronome (Equation (1)) extrapolated to the future. the Holocene optimum of –52.4˚C is determined at 10 kyr BP, and the LGM with the surface ice temperature of –70.2˚C is dated at 22 kyr BP.The 17.8˚C increase in ice-sheet surface temperature during the glacial–interglacial transition at Dome F is close to that found at Vostok (Reference Salamatin, Lipenkov, Barkov, Jouzel, Petit and RaynaudSalamatin and others, 1998b; Reference Barkov, Vostretsov, Lipenkov and Salamatin.Barkov and others, 2002).
Ice-sheet surface temperature fluctuations at Dome Fin the past (bold line) reconstructed from the δ18O record on the basis of the transfer function (Equation (4)) constrained by the Vostok temperature profile and the Dome F GMTS. the isotopic paleothermometer data are compared to the Vostok geophysical metronome (thin solid line) extended to the future (thin dashed line). Both temperature time series are given with respect to the present-day surface temperature level.

Accumulation rate b given by Equation (3) and ice-sheet thickness fluctuations δΔ, expressed in ice equivalent and simulated with the model (Reference Salamatin and RitzSalamatin and Ritz, 1996) for Dome F conditions, are presented in Figure 4. the contemporary ice-sheet thickness is assumed to be 3090 m (3055m ice equivalent) in accordance with Dome-F Deep Coring Group (1998). Accumulation rate in glacial periods is about two times less than its present-day estimate of 3.2 cm a–1. the 6 kyr lag between the accumulation-rate changes and the ice-thickness response can clearly be seen in Figure 4a and b if one compares the corresponding Holocene maximums. the full predicted swing of the ice-sheet thickness variations at Dome F does not exceed 150 m.
Reconstructed paleoenvironmental characteristics at Dome F. (a) Past accumulation rates (Equation (3)) consistent with the Dome F GMTS. (b) Ice-sheet thickness variations simulated after Reference Salamatin and RitzSalamatin and Ritz (1996).

The simultaneous use of the two different approaches to ice-core age dating makes the procedure of paleo-reconstruction based on the ice-core isotopic analysis more reliable, and, we believe, leads to more accurate chronology of paleorecords. the mean ages of the two time-scales in Table 1 are thought to have average errors of +2–3 kyr or less. Another advantage of matching GMTS with ice-flow model ages is the possibility of extending the age–depth correlation to deeper ice-sheet strata underlying the borehole bottom. This is especially true for the Dome F project, because the drilling operations were stopped 590m above the bedrock. the insert in Figure 2 presents the time-scale extrapolated to 3050m depth. In accordance with the ice-flow model predictions, the ice age at Dome F may reach 2000 kyr around 3000 m.
5. Temperature Distribution
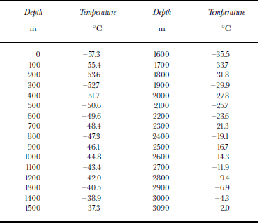
The paleoclimate history obtained in the previous section can now be used to simulate temperature distribution in the ice thickness in the vicinity of Dome F on the basis of the heat- and mass-transfer model developed for Vostok station (Reference Salamatin, Lipenkov and BlinovSalamatin and others, 1994; Reference Salamatin, Lipenkov, Barkov, Jouzel, Petit and Raynaud1998b; Reference Salamatin and HondohSalamatin, 2000). Along with common model parameters that are typical for central Antarctica and can be found in the above-cited works, the geothermal flux q0 must be set at the glacier bottom at Dome F. Its feasible (modal) value of about 0.053 Wm–2 (Reference Siegert and Dowdeswell.Siegert and Dowdeswell, 1996) leads to a temperature prediction of –8.0˚C at the ice–rock interface. However, the modeled temperature profile significantly underestimates the reconnaissance temperature measurements performed in the borehole between drilling runs. Three reference sets of measurements around depths 770, 1330 and 2220+10 m give the borehole-liquid temperatures within the intervals (–48.4, –46.5˚C), (–41.0, –37.9˚C) and (–23.2, –21.2˚C), which can be compared to the simulated values of –48.9, –41.7 and –27.2˚C, respectively. A good agreement between the modeled and available measured borehole temperatures is obtained at the geothermal flux q0 ≈ 0.059 Wm–2 and ice-fusion temperature (–2.0˚C) at the ice–rock interface with the minimum (zero) ice-melt rates. the corresponding temperature profile is presented in Table 3. Certainly, the temperature measurements performed during the drilling operations are not reliable and tend to overestimate the ice-sheet temperatures; nevertheless, we consider the latter simulations to be more realistic. Given that the details of the ice-sheet surface temperature variations are not important at great depth, the bottom heating is probably reasonably well constrained.
Present-day temperature–depth profile at Dome F
6. Conclusion
Two principal problems arise in the ice-core data interpretation: (1) ice-core age dating and (2) converting the measured isotope records into changes of the past temperatures and other paleoenvironmental parameters. Ice-sheet flow modeling alone is too uncertain to predict reliable ice ages, and the isotope/temperature slopes deduced from modern geographical observations do not accurately represent the temporal isotope–temperature relations. Borehole temperature memory in central Antarctica provides unique data about past climate changes and allows tuning to the dominant Milankovitch cycles (geophysical metronome) of the surface-ice temperature oscillations in the past. the correlation of the main climatic events (peaks and troughs) revealed in the local metronomic signal to those in an isotope record leads to the GMTS. the borehole temperature measurements and GMTS reliably constrain (through the thermomechanical model of the ice sheet) the transfer functions that relate the paleotemperatures and past accumulation rates to the isotope record.
Based on this general approach, the chronostratigraphy of the Dome F ice core has been obtained from the 2500m deep borehole and fitted to the ice-flow model predictions (Table1). GMTS and the modeled time-scale are in good agreement within 3.6 kyr SD. the ice age at the borehole bottom (590m above the bedrock) is around 335+4.5 kyr and may reach 2000 kyr at a 3000 m depth level. Paleothermometer calibration for central East Antarctica (Vostok and Dome F) reveals (Table 2) the temporal isotope/temperature slope about 30% lower than the present-day geographical estimates. the LGM–Holocene temperature transition of 17.8˚C found for Dome F is close to that at Vostok. Ice mass-balance rate in glacial periods is about two times less than its present-day estimate of 3.2 cm a–1. the full predicted swing of the ice-sheet thickness variations at Dome F does not exceed 150m. A good agreement between the modeled and available measured borehole temperatures is obtained at the geothermal flux 0.059 Wm–2 and ice-fusion temperature (–2.0˚C) at the ice–rock interface with minimum (zero) ice-melt rates.
Acknowledgements
The authors are grateful to all members of the Dome-F Deep Coring and Ice Core Research Groups for providing necessary data and fruitful and stimulating discussions. Our special thanks are addressed to Y. Fujii and K. Sato. who kindly prepared the borehole temperature measurements for constraining the temperature profile simulations and the revised working-time-scale data, respectively. We also express our gratitude to two anonymous reviewers for their valuable comments, readily taken into account during revision of the paper.
Appendix
A Simplified Ice-Flow Model for Ice-Age Prediction
Let us consider an ice-flow tube confined between two close neighboring flowlines in a central part of a large ice sheet. It is assumed that the pattern of the spatial distribution of ice mass balance b on the glacier surface does not change significantly with time t and the directions of ice motion are mainly determined by the bedrock relief. As a consequence, ice flowlines remain invariable. Hence, we can introduce the longitudinal coordinate s as a distance measured from the ice divide (the ice dome center) along a flowline in the reference flow tube; its configuration is characterized by its width H(s) and current ice equivalent thickness Δ(s,t). to ) account for compressibility of the near-surface snow–firn strata, it is also relevant (Reference SalamatinSalamatin,1991) to define the vertical coordinate ζ as the relative distance from the glacier bottom expressed in terms of the equivalent thickness of pure ice and normalized by Δ. Then the ice-particle trajectories are the solutions of the ordinary differential equations

where u is the longitudinal velocity and  is the apparent vertical ice mass-transfer rate derived explicitly in Reference SalamatinSalamatin (1991, Reference Salamatin and Hondoh2000):

In these formulae, the small terms containing the bottom ice-melt rate are neglected. Parameter σ, by definition, is the proportion of the total ice-flow rate through the flow tube due to plastic deformation of the glacier body, 0 ≤ σ ≤1. Index β is the Glen flow-law exponent modified in accordance with Reference LliboutryLliboutry (1979) to account for the vertical temperature gradient in the basal shear layer. the latter quantity should be considered as a tuning parameter that can also be adjusted to allow for possible development of shear zones of ``soft ice’’.
Typically, except for the nearest vicinities of ice divides, β is large, i.e. β ~10–20. Hence, in Equations (A2), the terms proportional to σ become important only at the glacier bottom as  Consequently, in the major part of the ice-flow domain for relatively small long-term variations of the ice-sheet thickness from Equations (A1) and (A2), we have

We do not expect the product bH to be a very complicated function of s in the central part of a large ice sheet and assume bH ~ sν as a reasonable approximation with one parameter ν > –1 describing primarily the ice-flow pattern which is a convergent flow for ν < 0 and a divergent one for ν > 0. Correspondingly, the above equation can easily be integrated to obtain a simple presentation of an ice-particle trajectory passing through a given location (s0; ζ0) in the glacier:

Although rather rough, Equation (A3) yields an appropriate substitution to eliminate s from the second of Equations (A1) in order to directly relate the vertical coordinate ζ of the ice particle with its age. the longitudinal coordinate essentially enters the latter equation through the ratio b/Δ. Thus, as a relevant power approximation for s ≤ s0, we write

where b0 and Δ0 are, respectively, the ice accumulation rate and the ice equivalent glacier thickness at the site under consideration s = s0. Parameters ε and μ should be adjusted to describe the geographical variation of b/Δ.
Finally, instead of Equations (A1) we have

The ice age t0 of the  level at s = s0 (the time-scale of ice deposits) is now given by the relation
 where
 is the solution of Equation (A4) at the initial condition

As explained, parameter σ in Equation (A4) becomes important only in the bottom part of the ice sheet when  and the ice particle approaches the point s0. Hence, σ can be assumed constant, with its value mainly determined by the local basal conditions.
One might argue that such a simple model for ice-age prediction is too rough and has five uncertain parameters σ, β , ν, ε and μ. However, this is a natural reality. Much more complicated two- or three-dimensional models do not considerably reduce the uncertainty of our knowledge about ice-deformation mechanisms and glacier sliding over the bedrock. Neither the past climate changes nor the present-day geographical situation are reliably known. Thus, the simplicity of the above approach with the explicitly introduced parameters that have clear physical meaning is the principal advantage of the developed model (Equation (A4)) and makes it a useful instrument for paleo-reconstructions and ice-core data interpretation in glaciology.
In our case, the snow–firn porosity profile c vs depth h can be presented (Reference Salamatin and HondohSalamatin, 2000) as

where cs and γ are the surface-snow porosity and the snow– firn densification index, respectively.
Accordingly, the normalized vertical coordinate  in Equation (A4) is explicitly expressed via depth:

In application to the Dome F ice core (Reference HondohHondoh and others, 1999), cs =0.67 and γ = 0.017m–1. As for the rest of the model parameters, the station is situated at the dome center (Dome-F Deep Coring Group, 1998) so that s0 = 0 (ε→0) and only σ and β are essential. No-sliding conditions correspond to σ =1. the special flow pattern near ice divides predicts relatively low values of the flow exponent 1 < β <5.



