Introduction
Meat quality traits are influenced by several ante mortem and post mortem factors, thereby making the prediction of ultimate meat quality more difficult. Changes in some meat quality traits can affect many other meat quality attributes (Huff-Lonergan et al., Reference Huff-Lonergan, Baas, Malek, Dekken, Prusa and Rothschild2002). Therefore, it is important to understand the relationship between these traits and many of the commonly used objective instrument-based measures of quality in a commercial setting (Huff-Lonergan et al., Reference Huff-Lonergan, Baas, Malek, Dekken, Prusa and Rothschild2002; Walshe et al., Reference Walshe, Sheehan, Delahunty, Morrissey and Kerry2006). When these variables are studied separately, the relationship among them is not clear. In this sense and after placing all the variables together, some statistic tools can be applied. The correlation analysis can initially identify the variables that are related regarding meat quality. The multivariate analysis can also be a useful means. Among the multivariate methods, principal component analysis (PCA) is one of the most used technique, because initial variables are grouped into a few factors, where the maximum information derived from the original data is included (Aishima and Nakai, Reference Aishima and Nakai1991).
The discriminant analysis is another multivariate statistic tool used to classify a sample into one of the several mutually exclusive groups on the basis of its measured response variables (Aishima and Nakai, Reference Aishima and Nakai1991). Finally, the multiple regression analysis is used to investigate the relationship between a dependent variable (y) and more than one independent variable (xi) (Aishima and Nakai, Reference Aishima and Nakai1991).
Few works (Vatansever et al., Reference Vatansever, Kurt, Enser, Nute, Scollan, Wood and Richardson2000; Cuvelier et al., Reference Cuvelier, Clinquart, Hocquette, Cabaraux, Dufrasne, Istasse and Hornick2006; Walshe et al., Reference Walshe, Sheehan, Delahunty, Morrissey and Kerry2006) have made a comprehensive effort in relating meat quality traits, but none of them has studied the relationship among meat colour, microbiology, fatty acid composition, volatile compounds and sensory analysis all together. Hence, the purpose of this work was to study the different quality traits in raw beef from four local Spanish cattle breeds stored under modified atmosphere in order to obtain a better understanding of how changes in specific traits may influence the shelf-life of raw beef under modified atmosphere packaging (MAP). A second objective was to identify which traits contributed more to the differences among breeds and days of storage.
Material and methods
Animals
Twenty-four young bulls from four local Spanish cattle breeds (six animals per breed) were studied: Asturiana de los Valles, Morucha, Parda Alpina and Pirenaica. These beef cattle are used for meat production, except for Parda Alpina, which is considered a dairy and meat breed. The Parda Alpina breed comes from Switzerland and was introduced in Spain at the end of the 19th century (Ministerio de Agricultura Pesca y Alimentación (MAPA), 1986). Morucha cattle are reared in extensive livestock systems from the West and South of Spain, whereas Pirenaica and Asturiana de los Valles are reared in semiextensive livestock systems in northern Spain. After weaning, animals were allotted in groups to be fattened (six animals per breed per group) at the Agricultural Research Service (Zaragoza, Spain). Young bulls were handled under identical farming conditions, in order to eliminate the effect of livestock system. The fattening period started when young bulls were 6 to 8 months old and weighed 220 to 260-kg live weight. During this period, animals were finished on commercial concentrate (metabolisable energy, 3.11-Mcal/kg dry matter; crude protein, 152-g/kg dry matter; and fat, 30-g/kg dry matter), containing barley and soya-bean cake, and barley straw, both ad libitum.
Animals were slaughtered at the abattoir in Zaragoza (Mercazaragoza) (Boletin Oficial del Estado (BOE), 1993) at approximately 470-kg live weight (group average) and at 10 to 12 months of age.
After 24 h post mortem, the longissimus dorsi muscle was removed from the left carcass side, and the shortloin (13th rib to sirloin end) was fabricated into 2 to 3 cm steaks. Samples were placed in plastic foam trays, packed in polyamide/polyethylene pouches (120 μm and 1 cm3/m2 per 24-h O2 permeability, 3 cm3/m2 per 24-h CO2 permeability and 0.5 cm3/m2 per 24-h N2; Vaessen Schoemaker Ind., Barcelona, Spain) and then flushed with 60% O2, 30% CO2 and 10% N2 (Extendapack 52) with an EGARVAC machine (Terrassa, Spain). This is a commercial mixture of gases used for red meats and supplied by Praxair (Pamplona, Spain).
After packaging, all samples were kept at 2 ± 1°C in the dark and in 90% to 95% relative humidity until days 0, 5, 10 and 15. After each of the storage periods, part of the samples were vacuum packaged (99% of vacuum) with the same machine and in the same type of pouches, and then stored at −20°C until lipid composition and volatile compounds analysis. The remaining variables (CIE L*a*b*, pigments, microbial counts, drip loss, pH, sensory evaluation of odour and colour) were measured on fresh meat just after each storage period.
Studied variables
This paper includes variables already published (Insausti, 2001; Insausti et al., Reference Insausti, Beriain, Purroy, Alberti, Lizaso and Hernandez1999, Reference Insausti, Beriain, Purroy, Alberti, Gorraiz and Alzueta2001, Reference Insausti, Beriain, Gorraiz and Purroy2002 and Reference Insausti, Beriain, Alzueta, Carr and Purroy2004) in previous monographic works.
(a) Colour physical variables. Lightness (L*), redness (a*) and yellowness (b*) (CIE, 1976) were measured using a Minolta CM2002 spectrophotometer with a D65 illuminant and a 10° standard observer. Samples were analysed immediately after opening the pouches. Measurements were made directly on the meat surface, and they were averaged over five non-overlapped zones of each steak, changing the instrument’s position each time.
(b) Meat pigments. Myoglobin (Mb), oxymyoglobin (MbO2) and metmyoglobin (MMb) relative percentages were obtained by reflectance data of the meat surface (Stewart et al., Reference Stewart, Zipser and Wats1965). The reflectance spectra obtained just after cutting the piece of meat was considered to be 100% Mb. After blooming this cut for 1 h in plastic foam trays overwrapped with a gas-permeable film, the reflectance spectra was considered to be 100% MbO2. Finally, one piece of each sample was converted to 100% MMb by introducing the meat into a 0.5% solution of potassium ferricyanide.
(c) Sensory degradation of odour and colour. It was assessed by quantitative descriptive analysis (Stone et al., Reference Stone, Sides, Oliver, Woolsey and Singleton1974). Meat samples were evaluated by five panellists who were meat research employees with past experience in evaluating fresh meat odour and colour. Six batches per session were evaluated at the laboratory; all of them belonged to the same breed and storage period, and they were presented in the plastic foam trays packaged under MAP. Batches were assessed for colour before opening the pouches and for odour just after opening them. Panellists evaluated odour and colour using a 150 mm unstructured line scale, anchored at each end with the following terms: on the left side ‘non-detectable off-odour,’ ‘bright, fresh red meat’; and on the right side ‘extreme off-odour’, ‘brown, greenish, discoloured meat,’ respectively. The results were quantified by measuring the distance in millimetres of the panellists’ marks from the left side.
(d) Microbial counts. Enterobacteriaceae, total aerobial counts or aerobial plate counts (APC), and lactic acid bacteria (LAB) were obtained as described by Insausti et al. (Reference Insausti, Beriain, Purroy, Alberti, Gorraiz and Alzueta2001). The meat samples were removed from the pouches using sterile scalpels and forceps to aseptically separate the bag from the meat. Two cores of 10 ± 0.1 g were aseptically removed from each sample and blended with a 90 ml of 1% tryptone solution (w/v) for 60 s in a stomacher (Lab Blender 400; Seward Medical, London, UK). Additional dilutions were made in 1% tryptone (w/v). Then 1 ml of the undiluted homogenate and of each dilution were spread on duplicate plates. Flora numbers were determined from plates bearing 30 to 300 colonies. Counts were obtained as follows: APC on plate count agar (Difco®, Detroit, MI, USA), incubated at 32°C for 48 h; Enterobacteriaceae on violet red bile glucose agar (Difco®, Detroit, MI, USA) overlaid with the same medium and incubated at 37°C for 24 h, LAB on lactobacilli MRS Broth (Difco®, Detroit, MI, USA) + Bacto Agar (Difco®) and glacial acetic acid (Panreac) incubated at 32°C for 48 h in a Heraeus electronic chamber with 5% CO2.
(e) Thiobarbituric acid (TBA) value. TBA reported by Insausti et al. (Reference Insausti, Beriain, Purroy, Alberti, Gorraiz and Alzueta2001) was obtained as described by Tarladgis et al. (Reference Tarladgis, Watts, Younathan and Dungan1960). Absorbencies at 532 nm measured with a Shimadzu spectrophotometer (model UV-2101 PC) were converted to mg malonaldehyde per kg meat and reported as TBA values.
(f) pH. pH (International Organisation for Standardisation (ISO), 1974) was measured with an Orion Research potentiometer (Orion Research Inc., Barcelona, Spain) for solid samples.
(g) Drip loss. It was expressed as a percentage of the initial weight of meat (Insausti et al., Reference Insausti, Beriain, Purroy, Alberti, Gorraiz and Alzueta2001), and it was measured taking as reference the weight of the meat at day 0 and weighing the meat after each storage period.
(h) Intramuscular fat. Intramuscular fat percentages reported by Alberti et al. (Reference Alberti, Lahoz, Sañudo and Olleta1999) were obtained using the Sohxlet method (ISO, 1973).
(i) Lipid composition. Intramuscular fat was extracted by the Bligh and Dyer method (Reference Bligh and Dyer1959). Thin-layer chromatography on silica gel plates 60 (20 × 20 cm; MERCK, Whitehouse Station, NJ, USA) was used to separate lipid extracts into lipid classes, using the method reported by Alzueta (2000): phospholipids (PL), monoglycerides (MG), 1,2-diglycerides (1,2-DG), 1,3-diglycerides (1,3-DG), cholesterol (C), free fatty acids (FFA), triglycerides (TG) and cholesterol esters (CE). Application of the extracted fat samples diluted in chloroform was carried out with the quantitative applicator Linomat IV (CAMAG). Plates were developed in a solvent containing n-hexane/diethyl ether/formic acid (80 : 20 : 4, v/v/v). Triacylglycerol fractions migrated towards the top of the plates and PL remained at the origin. For densitometric analysis, plates were sprayed with a mixture of anisaldehyde/ethanol/concentrate sulphuric acid/acetic acid (0.5 : 9 : 0.5 : 0.1, v/v/v) and heated at 200°C for 5 min to visualise the lipid spots. The lipid classes were identified by comparing Rf values with those from standard mixtures. To study total fatty acids, the total lipid extract was mixed with the internal standard (C21:0, methyl ester) and methylated with a mixture of borum trifluoride/benzene/methanol (25 : 20 : 55, v/v/v), as described by Morrison and Smith (Reference Morrison and Smith1964). Analysis was accomplished on a gas chromatograph HP 5890 (Hewlett-Packard, Madrid, Spain) series II equipped with a flame ionisation detector and an automatic injector (HP 7673; Hewlett-Packard). FAME (fatty acid methyl esters) were separated on a polyethylenglycol capillary column (HP 19091N-136 crosslinked; Hewlett-Packard) of 60 m × 0.25 mm × 0.25 μm. Analysis was carried out by using helium as the carrier gas, with a flow of 1 ml/min, and 1-μl sample was injected using the split-less injection mode. The oven temperature was programmed from 150°C to 210°C at 10°C/min, from 210°C to 240°C at 5°C/min, held at 240°C for 25 min. Injector temperature was 255°C and the detector was at 240°C. Identification of fatty acids was accomplished by comparing the relative retention times of the FAME peaks from samples with those from the standards (methyl ester standards for fatty acids, Sigma-Aldrich Química, SA, Spain). The amount of each fatty acid (ng/μl) was transformed into the gravimetric format (mg/100 g of meat).
(j) Volatile compounds. They were extracted and identified as described by Insausti et al. (Reference Insausti, Beriain, Gorraiz and Purroy2002). Meat samples were thawed at 4°C overnight, then ground and approximately 15 g of raw ground beef were immediately placed in the headspace vial. The vial was attached to a purge-and-trap sample concentrator (4460A, OI Analytical, TX, USA). The external heater was set at 30°C and the sample was purged with a 40 ml/min helium flow for 1 min dry purge plus 15 min purge. Headspace volatiles were collected on a Tenax gas chromatography (GC) trap (60/80 mesh) at 30°C and thermally desorbed at 180°C for 4 min with a 40 ml/min helium flow. Prior to each extraction, the Tenax GC trap was conditioned at 180°C for 53 min with a helium carrier flow of 40 ml/min and the headspace vials were kept in an oven for 15 min at 500°C. Quantification and identification of volatile compounds were performed on an HP-6890 gas chromatograph (Hewlett-Packard) coupled to a HP-5973 quadrupole mass spectrometer (Hewlett-Packard). Analysis was carried out with a HP-5 capillary column (5% phenylmethylsiloxane; 50 m × 320 μm × 1.05 μm film thickness; Hewlett-Packard) by using helium as the carrier gas, with the column temperature maintained initially at 35°C for 15 min and then programmed to 220°C at a rate of 8°C/min, and held for 15 min. The injector was set at 250°C. Desorbed compounds were injected using a split injection, with a column flow rate of 1 ml/min, a column head pressure of 6 ψ and a split ratio of 5 : 1. This determination was accomplished in duplicate for each sample. Quantification of each detected compound was expressed as area values. Significant mass spectrometer operational parameters were as follows: ionisation voltage, 70 eV; ion source temperature, 230°C; electron multiplier voltage, 2000 V; scan speed, 3.32 scan per s and scan range, 30 to 250 uma, and the quadrupole at 108°C. The obtained spectra were compared with those from the Wiley 275 library. Retention indices were calculated with the aid of a modified method for temperature-programmed gas chromatography developed by Van den Dool and Kratz (Reference Van den Dool and Kratz1963). In order to carry out the multivariate statistic study, only those volatile compounds identified in all the samples were included in the present study: 2,3,3-trimethylpentane, 2,2,5-trimethylhexane, 3-octene, 3-methyl-2-heptene, 2-octene, 2-propanone, 2,3-butanedione, dimethyl sulphide (DMS) and ethanol.
Statistical analysis
Statistical analysis was conducted using the Statistical Packages for the Social Sciences (2003). The correlation analysis was used to obtain information about the relationship among the studied variables.
The factorial analysis, using PCA on the correlation matrix and the Varimax rotation (Morrisson, Reference Morrisson1990) methods, was applied in order to see how all these variables contributed to the formation of new factors that might explain beef quality degradation.
The discriminant analysis was carried out to find out which of the studied variables contributed more to the separation among breeds and days of storage.
Finally, the multiple regression analysis by the stepwise method was applied to determine the relationship between the studied variables and the sensory degradation of odour and colour.
Results and discussion
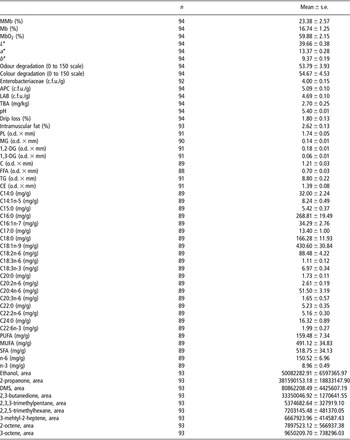
The means for the major traits evaluated in this work are presented in Table 1. Standard error of the traits are also reported. In general, these values agree with results from other research works carried out in beef samples from Pirenaica and Friesian breeds (Lizaso, 1998; Alzueta, 2000; Alberti et al., Reference Alberti, Ripoll, Goyache, Lahoz, Olleta, Panea and Sañudo2005; Goñi et al., Reference Goñi, Beriain, Indurain and Insausti2007). Regarding volatile compounds, area values in this study were higher than the values reported by Gorraiz et al. (Reference Gorraiz, Beriain, Chasco and Insausti2002). The differences may be attributed to quantifying volatile compounds by gas chromatography v. mass spectrometry.
Means and standard error of traits measured in beef stored under modified atmosphere

APC = aerobial plate counts; a* = redness; b* = yellowness; C = cholesterol; CE = cholesterol esters; c.f.u. = colony-formating units; DMS = dimethyl sulphide; 1,2-DG = 1,2-diglycerides; 1,3-DG = 1,3-diglycerides; FFA = free fatty acids; LAB = lactic acid bacteria; L* = lightness; Mb = myoglobin; MbO2 = oxymyoglobin; MMb = metmyoglobin; MG = monoglycerides; MUFA = monounsaturated fatty acids; PL = phospholipids; PUFA = polyunsaturated fatty acids; SFA = saturated fatty acids; TG = triglycerides.
Correlation analysis
(a) Correlations among colour physical variables and other beef quality traits. Since the measurement of colour can be an easy and fast method, it is important to know the relationship between these measurements and other beef quality traits in order to predict the degradation of beef quality.
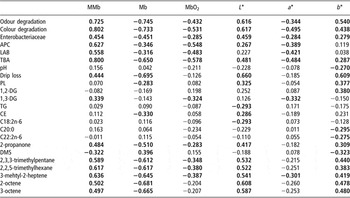
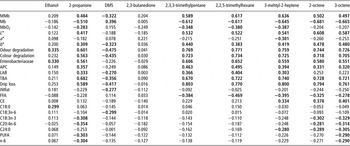
Table 2 shows that MMb, L* and b* were positively related to the sensory degradation of colour and odour, to the increase in microbial counts, fat oxidation measured as TBA values, drip loss and to the increase in the volatile compounds 2-propanone, 2,3,3-trimethylpentane, 2,2,5-trimethylhexane, 3-methyl-2-heptene, 2-octene and 3-octene. Consequently, the increase in MMb, L* and b* reflects the degradation of beef quality. In addition, MMb was positively related to 1, 3-DG and negatively related to DMS. L* was positively related to PL and CE and negatively related to TG and C18:2n-6. b* was negatively related to C20:0 and C22:2n-6.
Table 2Correlations among colour physical variables and other beef quality traitsFootnote †

Bold values indicate significant correlations at P < 0.01.
† Abbreviations: see Table 1.
On the contrary, a* and the percentages of Mb and MbO2 measured by reflectance were negatively related to the sensory degradation of odour and colour, and to the increase in microbial counts and TBA. This result was expected due to the negative correlation between L* and a* (Moss et al., 1994). In addition, Mb percentages were negatively related to drip loss, PL, CE, 2-propanone, 2, 3, 3-trimethylpentane, 2, 2, 5-trimethylhexane, 3-methyl-2-heptene, 2-octene and 3-octene. MbO2 was negatively related to 1, 3-DG, 2-propanone, 2, 3, 3-trimethylpentane, 2,2,5-trimethylhexane and 3-methyl-2-heptene, and a* was negatively related to 1,3-DG and 3-methyl-2-heptene.
Consequently, L*, a*, b* and the percentages of pigments at the meat surface measured by reflectance might be a useful means to evaluate the shelf-life of beef stored under modified atmosphere.
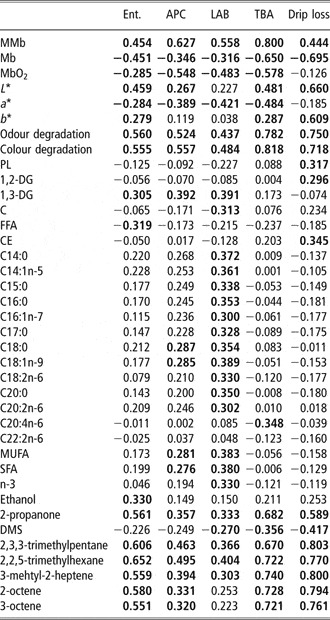
(b) Correlations among microbial counts, TBA and drip loss with other beef quality traits. As already mentioned, microbial counts, TBA and drip loss were positively related to MMb, L*, b* and the sensory degradation of odour and colour, while the correlation was negative with Mb, MbO2 and a* (Table 3).
Table 3Correlations among microbial counts, TBA and drip loss with other beef quality traitsFootnote †
Bold values indicate significant correlations at P < 0.01.
†Abbreviations: see Table 1.
Enterobacteriaceae counts were positively related to 1,3-DG and to the volatile compounds ethanol, 2-propanone, 2,3,3-trimethylpentane, 2,2,5-trimethylhexane, 3-methyl-2-heptene, 2-octene and 3-octene, and they were negatively related to FFA. This fact is in agreement with the recognition of the role of proteolytic Entrerobacteriaceae in the spoilage of refrigerated meats packaged under vacuum or modified atmosphere (Dainty et al., Reference Dainty, Edwards, Hibbard and Ramantanis1986) and in the development of putrid ammoniacal odour (Nortjé and Shaw, Reference Nortjé and Shaw1989). Moreover, the decrease in FFA is likely due to their transformation in other compounds such as carbonyls (MacLeod and Seyyedain-Ardebili, Reference MacLeod and Seyyedain-Ardebili1981). APC were positively related to these variables, but they were also positively correlated to the fatty acids C18:0 and C18:1n-9 and to monounsaturated fatty acids (MUFA) and saturated fatty acid (SFA). LAB were correlated to volatile compounds, but they were also positively correlated to a greater number of fatty acids, such as C14:0, C14:1n-5, C15:0, C16:0, C16:1n-7, C17:0, C18:0, C18:1n-9, C18:2n-6, C20:0, C20:2n-6, MUFA, SFA and n-3. TBA was only related to the decrease in C20:4n-6. Therefore, the development of APC and LAB is related in general to the increase in MUFA and SFA, and the increase in TBA is related to the degradation of C20:4n-6. Insausti et al. (Reference Insausti, Beriain, Alzueta, Carr and Purroy2004) also related the formation of TBA to the degradation of C18:3n-3, but with a low R 2 value (0.13). These results are in agreement with Gokalp et al. (Reference Gokalp, Ockerman, Plimpton and Harper1983) and Vatansever et al. (Reference Vatansever, Kurt, Enser, Nute, Scollan, Wood and Richardson2000) who reported that unsaturated fatty acids, specially n-3 polyunsaturated fatty acids (PUFA), are susceptible to oxidation, leading to the production of peroxides and eventually to rancidity giving higher TBA values. Furthermore, TBA and drip loss were negatively related to DMS and were positively related to the rest of volatile compounds, together with drip loss. The latter, drip loss, was positively related to PL, 1,2-DG and CE. These results make sense since PL values are higher in leaner meat (Eichhorn et al., Reference Eichhorn, Bailey and Blomquist1985) and lower intramuscular fat is related to higher drip loss (Huff-Lonergan et al., Reference Huff-Lonergan, Baas, Malek, Dekken, Prusa and Rothschild2002; Cuvelier et al., Reference Cuvelier, Clinquart, Hocquette, Cabaraux, Dufrasne, Istasse and Hornick2006). In the present study, no differences were observed for the drip losses. This could be explained by the rate of post mortem decrease of pH, which was similar in the four breeds.
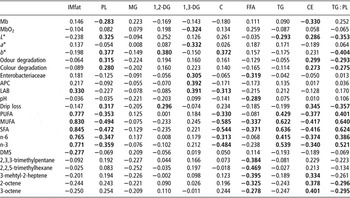
(c) Correlations among intramuscular fat percentages, lipid composition and other beef quality traits. PL, C and CE were negatively related and TG, intramuscular fat and TG/PL ratio were positively related to PUFA, MUFA, SFA, n-6 and n-3 (Table 4). This was logical, because the amount of SFA and MUFA (mg/100 g meat) is directly related to the amount of fat (Cuvelier et al., Reference Cuvelier, Clinquart, Hocquette, Cabaraux, Dufrasne, Istasse and Hornick2006; Hoffman et al., Reference Hoffman, Kroucamp and Manley2007). These observations are mainly due to the preferential incorporation of PUFA into the PL associated with cell membranes, whereas SFA and MUFA are deposited mainly in the TG fraction, which increases with intramuscular fat content (De Smet et al., Reference De Smet, Raes and Demeyer2004).
Table 4Correlations among intramuscular fat, lipid classes and other beef quality traitsFootnote †
Bold values indicate significant correlations at P < 0.01.
† Abbreviations: see Table 1.
Some other remarkable relationships such as the negative correlation between FFA and Enterobacteriaceae counts, pH, MUFA, SFA and the volatile compounds 2,3,3-trimethylpentane, 2,2,5-trimethylhexane, 3-methyl-2-heptene, 2-octene and 3-octene can be seen in Table 4. Finally, CE values were positively related to 3-methyl-2-heptene, 2-octene and 3-octene.
(d) Correlations among volatile compounds and other beef quality traits. The studied volatile compounds (Table 5), except from ethanol, DMS and 2,3-butanedione, were positively related to MMb, L*, b*, the sensory degradation of odour and colour, microbial counts, TBA and drip loss. Ethanol was only related to the degradation of odour and Enterobacteriaceae counts. DMS was negatively related to the above mentioned traits and 2,3-butanedione showed no correlation with the variables reported in Table 5. In conclusion, the increase in 2-propanone, 2,3,3-trimethylpentane, 2,2,5-trimethylhexane, 3-methyl-2-heptene, 2-octene and 3-octene and the decrease in DMS are directly related to the loss of raw beef quality stored under modified atmosphere. Drumm and Spanier (Reference Drumm and Spanier1991)also found that the degradation of sulphur-containing amino acids and volatile compounds was associated with a loss of meatiness flavour.
Table 5Correlations among volatile compounds and other beef quality traitsFootnote †
Bold values indicate significant correlations at P < 0.01.
† Abbreviations: see Table 1.


The significant correlation between TBA and the above-mentioned volatiles and the fact that these compounds were tentatively identified in all these samples (Insausti et al., Reference Insausti, Beriain, Gorraiz and Purroy2002) would let us infer that these volatile compounds might be used as raw beef quality degradation markers. Among those evaluated, 2-propanone was predominant in the profile of raw beef (Insausti et al., Reference Insausti, Beriain, Gorraiz and Purroy2002) and also in cooked beef (MacLeod and Ames, Reference MacLeod and Ames1986; Gorraiz, 1999). In addition, the decrease in DMS was proposed as a marker of the degradation of raw beef quality by Insausti et al. (Reference Insausti, Beriain, Gorraiz and Purroy2002). So far, the decrease in DMS was related to warmed-over flavours in cooked meat (Kerler and Grosch, Reference Kerler and Grosch1996).
Regarding the relationship between volatile compounds and fatty acids, ethanol was positively related to C18:0; 2-propanone was negatively related to C18:3n-3, C20:4n-6, PUFA and n-6; DMS was negatively related to C18:3n-6; 3-methyl-2-heptene was negatively related to C24:0; 2-octene and 3-octene were negatively related to C18:3n-3, C20:4n-6 and C24:0; and 3-octene was negatively related to PUFA and n-6. These results agree with those from Elmore et al. (Reference Elmore, Warren, Mottram, Scollan, Enser, Richardson and Wood2004) who reported that many fatty acid-derived volatiles are related to the relative amount of linoleic (C18:2n-6) and α-linolenic (C18:3n-3) acids, and possibly their long-chain metabolites, in the muscle. As a consequence, as the content of n-3 PUFA increases by more than 3%, the sensory attributes such as ‘grassy’ or ‘fishy’ score were higher, and the colour shelf-life of beef might be reduced (Scollan et al., Reference Scollan, Hocquette, Nuernberg, Dannenberger, Richardson and Moloney2006).
Principal component analysis
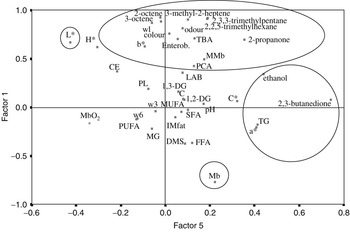
The factorial analysis, using the principal component extraction and the Varimax rotation methods, was applied to all of the studied variables except for fatty acids, such as PUFA, MUFA, SFA, n-6 and n-3. Eight factors that accounted for 81.1% of the total variability were obtained. Factor 1 (32.2%) (Figure 1) related positively to the volatile compounds (except for 2,3-butanedione, DMS and ethanol), the sensory degradation of odour and colour, microbial counts, L*, b* and metmyoglobin, drip loss and TBA; all these variables were negatively related to myoglobin. Factors 2 (17.8%), 4 (7.0%) and 7 (3.1%) were formed by variables related to fat (lipid classes and fatty acids). Factor 3 (9.5%) related sensory colour, LAB and APC, oxymyoglobin, a*, metmyoglobin, 1,3-DG and TBA. Factor 5 (5.0%) related 2,3-butanedione, ethanol, a* and TG against L* (Figure 1). Factor 6 (3.9%) was formed by LAB, APC and pH, and factor 8 (2.6%) by DMS and CE. Hence, principal component 1 was a beef quality degradation factor, and factor 5 related the higher ethanol content to higher intramuscular fat, as also reported by Insausti et al. (Reference Insausti, Beriain, Gorraiz and Purroy2002 and Reference Insausti, Goñi, Petri, Gorraiz and Beriain2005). However, when plotting breeds on the bi-dimensional space formed by factors 1 and 5, no clear separation of breeds was observed on factor 5, even though Morucha and Parda Alpina had higher intramuscular fat than Asturiana de los Valles and Pirenaica (Alberti et al., Reference Alberti, Lahoz, Sañudo and Olleta1999). This result is logical since factor 5 accounted for only 5.0% of the total variability.
Plot of volatile compounds, odour and colour degradation, lipid composition, microbial counts, thiobarbituric acid, pH, drip loss, pigments and colour physical variables on the bi-dimensional space formed by factors 1 and 5.

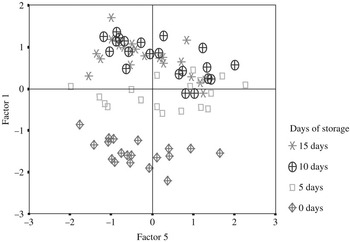
On the contrary, when plotting days of storage on the same bi-dimensional space, a clear separation was observed for factor 1 (Figure 2). Consequently, the following variables increased with increasing storage time and can be used as indicators of the loss of fresh beef quality: 2,3,3-trimethylpentane, 2,2,5-trimethylhexane, 3-octene, 3-methyl-2-heptene, 2-octene, 2-propanone; the degradation scores of colour and odour assessed at the sensory evaluation; Enterobacteriaceae and APC counts; metmyoglobin, L*, b*, and drip loss and TBA. Neither variables related to fat, except for TBA, nor pH was represented in this beef quality degradation factor; consequently, they were not limiting factors of the shelf-life of raw beef stored under MAP. In fact, no or small significant changes in variables related to fat and pH were previously reported with increasing days of storage in beef samples from the same animals (Insausti, 2001; Insausti et al., Reference Insausti, Beriain, Purroy, Alberti, Lizaso and Hernandez1999 and Reference Insausti, Beriain, Purroy, Alberti, Gorraiz and Alzueta2001).
Plot of ‘days of storage’ on the bi-dimensional space formed by factors 1 and 5 obtained by principal component anaylsis of volatile compounds, odour and colour degradation, lipid composition, microbial counts, thiobarbituric acid, pH, drip loss, pigments and colour physical variables.

Discriminant analysis
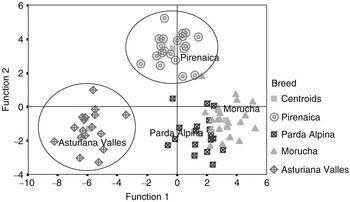
As the factorial analysis only separated days of storage, the discriminant analysis was accomplished to find out which of the studied variables contributed to a greater extent to the separation among breeds.
When defining groups by ‘breed,’ two essays were carried out. In the first one, all the studied variables were included in the study, except for the ratios (TG/PL, PUFA/SFA, MUFA/SFA, n-6/n-3). Three discriminant functions were obtained with 100% of the cases correctly classified.
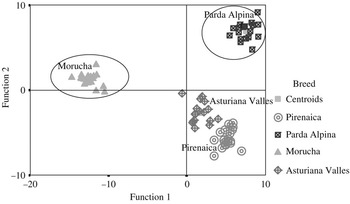
Function 1 (Figure 3) separated Morucha in front of Asturiana de los Valles, Parda Alpina and Pirenaica on the basis of its higher metmyoglobin contents and lower DMS content.
Separation of ‘breed’ groups obtained applying the discriminant analysis to volatile compounds, odour and colour degradation, lipid composition, microbial counts, thiobarbituric acid, pH, drip loss, pigments and colour physical variables, leaving ratios out of the analysis.

Function 2 separated Parda Alpina against Asturiana de los Valles and Pirenaica due to its higher content on the following variables: TG, C18:0, C22:2n-6, C22:6n-3, C18:3n-6, a*, myoglobin, 2,3-butanedione, ethanol, pH, and its lower content in L*, b*, oxymyoglobin, 2,3,3-trimethylpentane, 2,2,5-trimethylhexane, 2-propanone, 2-octene, 3-octene, C, FFA, TBA, drip loss and sensory degradation of colour (Figure 3).
The second essay was accomplished leaving ratios and individual fatty acids out of the analysis. Three discriminant functions were also obtained with 100% of the cases correctly classified. This time, function 1 separated Asturiana de los Valles against Morucha and Parda Alpina due to its higher CE, C and drip loss and its lower content in TG, intramuscular fat, SFA, MUFA, n-3, PUFA, APC, LAB, ethanol and a* (Figure 4). Pirenaica was separated in factor 2 v. Asturiana de los Valles and Parda Alpina due to its higher L*, b*, oxymyoglobin, MG, 1,3-DG, FFA, Enterobacteriaceae counts, sensory degradation of colour and odour, and its lower content in 2,3-butanedione, pH, myoglobin and metmyoglobin (Figure 4).
Separation of ‘breed’ groups obtained applying the discriminant analysis to volatile compounds, odour and colour degradation, lipid composition, microbial counts, thiobarbituric acid, pH, drip loss, pigments and colour physical variables, leaving ratios and individual fatty acids out of the analysis.

The functions obtained in both essays separated breeds in different groups. However, each breed was separated on one of the mentioned functions: Morucha on function 1 (essay 1), Parda Alpina on function 2 (essay 1), Asturiana de los Valles on function 1 (essay 2) and Pirenaica on function 2 (essay 2). Therefore, it can be stated that each breed has some characteristics that differentiate it from the rest. Being aware of these differences among breeds is of great importance at the retail market where new conservation and packaging conditions are used. Consequently, the most suitable packaging conditions should be used for each breed or group of breeds if new packaging technologies are to be applied successfully (Insausti et al., Reference Insausti, Beriain, Purroy, Alberti, Lizaso and Hernandez1999).
Multiple regression analysis
In conclusion, some variables certainly may impact beef quality. TBA and PUFA are related to oxidation, b* and MMb reflect colour stability, and DMS and 2-propanone may be used as oxidation markers.
The stepwise multiple regression analysis was used to predict the sensory odour and colour degradation as a function of these variables.
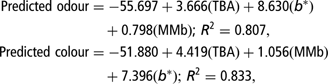
The degradation of both odour and colour were directly related to the increase in TBA, b* and MMb. These results agree with those from Campo et al. (Reference Campo, Nute, Hughes, Enser, Wood and Richardson2006) who reported that the increase in TBA was highly correlated with the decrease in odour acceptability and the overall liking of beef. Besides, the results suggest that the degradation of beef sensory quality was related to lipid and pigment oxidation, as reported by Liu et al. (Reference Liu, Lanari and Schaefer1995) and Faustman et al. (Reference Faustman, Chan, Schaefer and Havens1998). In this study, meat from Asturiana de los Valles and Morucha showed TBA >5 ppm after 10 days of storage (Insausti et al., Reference Insausti, Beriain, Purroy, Alberti, Gorraiz and Alzueta2001). This high oxidation could be explained because meat from Morucha had the highest myoglobin concentration and the highest intramuscular fat percentage (Alberti et al., Reference Alberti, Lahoz, Sañudo and Olleta1999). However, Asturiana de los Valles had the lowest intramuscular fat (Alberti et al., Reference Alberti, Lahoz, Sañudo and Olleta1999) but the highest PUFA/SFA ratio (Insausti et al., Reference Insausti, Beriain, Alzueta, Carr and Purroy2004), suggesting that PUFA were more sensitive to autoxidation.
Parda Alpina and Pirenaica showed both TBA <5ppm after 15 days of storage (Insausti et al., Reference Insausti, Beriain, Purroy, Alberti, Gorraiz and Alzueta2001). Parda Alpina had high myoglobin concentration and marbling (Alberti et al., Reference Alberti, Lahoz, Sañudo and Olleta1999) but low PUFA/SFA ratio (Insausti et al., Reference Insausti, Beriain, Alzueta, Carr and Purroy2004). However, Pirenaica showed lower myoglobin and marbling (Alberti et al., Reference Alberti, Lahoz, Sañudo and Olleta1999) but higher PUFA/SFA than Parda Alpina. Therefore, the rate of oxidation may be influenced by the concentration of myoglobin and the PUFA/SFA ratio leading to different TBA values. In meats with high marbling, myoglobin may be the main cause of oxidation, while in meats with low marbling, the PUFA/SFA ratio may be responsible for the initial instability of meat to oxidation.
These data suggest that changes in some meat quality traits can affect many other meat quality attributes. In this study, the limiting factor in quality was not microbial counts, but odour and colour spoilage by lipid oxidation. Water loss and myoglobin instability also influenced shelf-life (Insausti et al., Reference Insausti, Beriain, Purroy, Alberti, Gorraiz and Alzueta2001). Besides, TBA, 2-propanone and DMS may be used as oxidation markers in raw beef. In this sense, further study is encouraged on the role of b* on beef quality degradation, because it is directly involved in the sensory perception of loss of quality, and it might be helpful in the study of pigment and lipid oxidation.
When studying the shelf-life of beef from different breeds under MAP, there are general trends that may be considered; however, the rate of oxidation might be breed dependent due to concentration of myoglobin and the PUFA/SFA ratio. Consequently, further research is needed to investigate the stability of meat to autoxidation in animals from the same breed at different degrees of fatness.
Therefore, the phenotypic correlations reported in this study yield important information that can be used to aid in directing future studies aimed at elucidating the underlying biological mechanisms behind the development of many quality traits.
Acknowledgements
The authors thank Pere Alberti, from the Centro de Investigaciones y Tecnología Agroalimentaria, DGA, Zaragoza (Spain), for the beef samples supplied for this research.