Belgium is famous for many things, including waffles, chocolate and beer. Yet political scientists often associate Belgium with very long government formation periods: it took 196 days (that is, more than six months) of negotiations to form a government in 2007, 541 days following the general election in 2010, and about five months after the election in 2014. Such extensive government formation periods are often thought to indicate a political system’s instability and complexity:Footnote 1 while parties aim to reach an agreement, the incumbent cabinet rules as a caretaker government. These governments act without a popular mandateFootnote 2 and are restricted – by convention or institutional rules – to administrative matters, and have very limited policy-making capacities.Footnote 3 Delays in government formation thus hinder political reform processes and have detrimental economic consequences by affecting foreign exchange and stock markets.Footnote 4
Despite the rich literature on government formation, we know surprisingly little about the bargaining processes that take place during government formation periods.Footnote 5 Most studies focus on bargaining outcomes to explain the size, ideological proximity and party composition of future governments.Footnote 6 The few empirical studies on the duration of government formation periods focus on the party system level and attribute variation in the duration to systemic factors such as post-election bargaining and the complexity of the party system.
A major disadvantage of this approach is that it rules out actor-specific explanatory factors.Footnote 7 In fact, the concentration on the party system level is rather surprising, given that most research on multiparty governments focuses on parties as the central actors.Footnote 8 Theories and models of government formation, coalition governance and government termination usually focus on individual parties and analyse the effects of their policy preferences, bargaining power and uncertainty, as well as how the institutional environment constrains and affects their room for manoeuvre.Footnote 9 We expect actor-centric factors to be equally relevant for the duration of government formation processes. Coalition bargaining is the ‘wheeling and dealing between parties’,Footnote 10 and each formation attempt includes a particular subset of parties with different preferences and knowledge of each other’s preferences and constraints. In addition to the external environment, we would expect these actors’ preferences, resources and constraints to shape the bargaining process.
In this article, we provide a new dataset on 303 multiparty formation attempts in nineteen European democracies. With these data we can – for the first time – test actor-specific factors to explain the duration of coalition formation processes. Based on theoretical bargaining models and the literature on party competition, we hypothesize that (1) preference tangentiality, (2) ideological proximity, (3) incumbency and (4) party leadership tenure decrease the duration of coalition bargaining.
A prevalent challenge in studying formation attempts is that they emerge from a non-random selection process. Which parties team up to begin coalition talks is a biased sample from the universe of all possible government alternatives, and this type of selection bias may affect the conclusions we draw when analysing delays in the formation process. Another challenge is to account for the fact that some formation attempts eventually fail. To deal with these challenges, we employ a competing risks duration model using a copula approach.Footnote 11 The results of this two-stage model support most of the hypothesized effects. Negotiations are swifter when parties emphasize different issue areas, when they have been in government before and when leaders have been in office for a long time. The effects of these explanatory factors are substantially significant and as important as those of the parties’ bargaining environment.
These findings have several implications for our understanding of government formation processes, political bargaining and party competition in general. First, we highlight the relevance of actor-specific factors to explain the duration of government formation processes. Thus focusing on individual formation attempts allows researchers to develop and test hypotheses that have hitherto been neglected in the coalition literature. Secondly and related, this implies that party leaders are not trapped in the context surrounding the bargaining situation but have discretion regarding the duration of the bargaining process. For example, they can choose potential coalition partners with niche policy profilesFootnote 12 to avoid conflict over policy issues in coalition negotiations. Thus a strong emphasis on issues neglected by rivals may not only help niche parties electorally but also make them attractive as potential coalition partners. Thirdly, aspects that explain delays in the bargaining process may also affect the bargaining outcome. Thus factors such as elite turnover, which we identify as explanatory factors for the duration of bargaining processes, may be equally relevant for other aspects of government formation such as the party composition of future governments. Finally, our findings also have wider implications for the literature on party leader turnover.Footnote 13 We find that party leadership tenure increases the chances to enter government more quickly. Thus parties aiming to enter a future government have certain incentives to stick with their party leaders even if other incentives, such as electoral performance, would suggest otherwise.
GOVERNMENT FORMATION PROCESSES IN PARLIAMENTARY DEMOCRACIES
Theories of coalition formation usually highlight the importance of actor-specific explanatory variables that shed light on the parties’ preferences, costs and constraints.Footnote 14 In contrast, empirical studies on the duration of government formation processes often focus on the bargaining environment.Footnote 15 Specifically, they attribute variation in the length of government formation periods to post-election status, the fragmentation and ideological polarization in parliament, and variation in institutional rules.
One of the major findings in this literature is that formation processes immediately after elections take longer than those between elections.Footnote 16 Post-election status is used as a proxy for the actors’ uncertainty in the bargaining situation.Footnote 17 With incomplete information, parties use the bargaining period to learn about other parties’ preferences.Footnote 18 They may be uncertain about the preferences of potential coalition partnersFootnote 19 and hesitate to agree to a deal when payoffs later in the bargaining process may be higher.Footnote 20 Thus longer formation periods emerge because parties need time to gather information on rival parties’ preferences.
An alternative explanation for delays in coalition bargaining is the complexity of the bargaining situation.Footnote 21 According to this approach, negotiations are difficult if there are many coalition alternatives and if ideological polarization indicates strong disagreements in the parties’ policy preferences. Empirically, the complexity of the parties’ bargaining environment is often measured using indices for the effective number of parties in parliament and the ideological dispersion in the legislature.Footnote 22
Finally, there are institutional features that may affect the duration of government formation periods. For example, governments under ‘positive parliamentarism’ need the explicit support of a parliamentary majority, while those under ‘negative parliamentarism’ only have to make sure that there is no parliamentary majority explicitly opposing them.Footnote 23 Forming a government under positive parliamentarism should be more difficult, and reaching an agreement may thus take more time.Footnote 24
AN ACTOR-CENTRIC APPROACH TO DELAYS IN THE FORMATION PROCESS
While we believe that context factors are important to explain delays in formation processes, we aim to shed more light on attributes that vary across actors and individual formation attempts. In so doing, we draw on the literature of bargaining models to understand delays in the bargaining process.Footnote 25 The government formation process is a typical example of a strategic bargaining situation:Footnote 26 two (or more) actors meet to discuss opportunities to find a mutually beneficial agreement. Such bargaining implies a certain amount of policy conflict. Another crucial element in these models is that uncertainty leads to delays in bargaining processes.Footnote 27 Indicators of the uncertainty on the party-system level were discussed above. Here we focus on two uncertainty indicators that vary across parties and formation attempts.
Party policy preferences are crucial to explain the partisan composition of (coalition) governments,Footnote 28 coalition governanceFootnote 29 and government termination.Footnote 30 A similar argument could be made for delays in the government formation process: increasing conflict in the parties’ issue appeals decreases the chances of finding a compromise that satisfies the demands of all negotiation partners.Footnote 31 Preference divergence becomes particularly relevant if we relax the assumption that parties are ‘unitary actors’. Luebbert famously argued that much of the bargaining in coalition negotiations actually happens within rather than between parties: ‘what makes the talks so long, difficult and complex is generally not the goodwill among elites, but the fact that negotiations must appear the way they do in order to satisfy the members’.Footnote 32
The assumption is that parties are policy-seeking actors that bargain over government formation – for genuine or instrumental reasons – in order to get some of their proposed policies enacted. Perhaps the most relevant yardstick for the parties’ proposed policies is their election manifestos. These documents are usually conceived of as an explicit (though not enforceable) contract between parties and their voters. Parties may thus feel obliged to at least bring up the issues raised in their manifestos as input for the negotiations, although certainly not all issues will make it into the final coalition deal. Previous studies on the role of party manifestos indeed stress their importance as policy yardsticks in government formation processes.Footnote 33
LuebbertFootnote 34 distinguishes different types of bargaining relationships (between parties) using two criteria: issue salience and the divergence of policy positions. The first criterion separates bargaining relationships in which negotiating parties care about the same issues from those in which preferences are tangential, meaning that parties ‘address different issues [...] [that] are sufficiently unrelated [so] that party leaders do not consider them to be incompatible’.Footnote 35 Tangential preferences imply a relatively easy bargaining environment, as parties can maintain their policy positions on the issues that are most important to them. Moreover, government parties can manage to keep their distinctiveness in the coalition government. For example, niche partiesFootnote 36 such as green, nationalist and regionalist parties usually address a rather narrow set of policy issues.Footnote 37 This makes them attractive coalition partners for (mainstream) parties that can logroll authority or policy-related concessions in these areas for policy concessions in many other policy issues.Footnote 38 Preference tangentiality makes governance much easier in these coalition governments and thus reduces the parties’ incentive for mutual control and mechanisms of coalition governance.Footnote 39
Luebbert’s second criterion distinguishes between convergent and divergent preferences in the bargaining relationship. Preferences are convergent if parties can agree on the necessary reforms concerning major policy issues, while they are divergent if parties ‘focus on different issues but advocate mutually exclusive preferences or focus on the same issues and advocate directionally incompatible preferences’.Footnote 40 We expect that negotiations are easier, and arguably swifter, if parties have convergent rather than divergent policy preferences. Martin and VanbergFootnote 41 find empirical evidence that increasing the ideological range between government parties indeed extends the duration of government formation processes. Based on veto player theory,Footnote 42 they argue that greater ideological distances between potential coalition partners decrease the ‘winset’ of potential policy compromises and require more negotiations within individual parties. A crucial assumption in their empirical analysis is that the ideological distance between parties that eventually form the next government can be used as a proxy measure for the entire government formation process. Below, we test this argument using better suited data based on individual formation attempts.Footnote 43 These expectations can be summarized in two hypotheses:
Hypothesis 1 (Preference tangentiality): Tangentiality in party policy preferences decreases the duration of government formation attempts.
Hypothesis 2 (Preference divergence): Divergence in party policy preferences increases the duration of government formation attempts.
A second set of hypotheses focuses on the actors’ uncertainty in the bargaining situation. As outlined above, the general expectation is that higher uncertainty leads to delays in the formation process.Footnote 44 If parties have incomplete information about the preferences of other parties in the negotiations, they may use offers and counteroffers to ‘screen’ the bargaining parties’ preferences and to identify a proposal that is acceptable to all bargaining parties. Another way to reduce uncertainty is to use delays as signals: delays are costly, and therefore all parties would like to avoid them if possible. By delaying an offer, a party can credibly signal to other parties that they cannot get a better deal.
While indicators such as post-election status capture the uncertainty in the party system, we focus on attributes that capture the uncertainty of the actors who are engaged in the negotiation process. The key argument is that uncertainty decreases if party actors are more familiar with each other. We distinguish between (1) familiarity regarding the party composition of a potential government and (2) familiarity between party elites.
We argue that incumbency reduces the uncertainty of party actors in a formation attempt. Incumbency is an important element in the government formation process. Parties of the outgoing government are more likely to enter the new government than other potential coalitions.Footnote 45 In addition to institutional rules that favour continuation, incumbents may also prefer to continue to collaborate in government.Footnote 46 One main reason for this is the familiarity between parties that work together, which fosters mutual trust, knowledge about each other’s preferences and an understanding of the constraints parties face.Footnote 47 Put differently, the previous time in office has ‘served as a screening device reducing information uncertainty and perceived commitment problems’.Footnote 48 Along these lines, we argue that incumbency reduces the uncertainty in the bargaining process. Thus formation attempts among parties of the outgoing government should be swifter than those between parties without an incumbency advantage.
Uncertainty in the bargaining process may also emerge at the level of party elites. Despite the vast literature on the personalization of politics,Footnote 49 the role of party elites in the government formation process is often left in the dark. Rather, it is assumed that parties act as unitary actorsFootnote 50 and that party goals – not personal preferences – characterize the bargaining process. We argue that changes in party leadership also increase the uncertainty in the bargaining process, which eventually increases the duration of government formation attempts.
Potential coalition partners are less familiar with new party leaders than with old ones, since they know less about their preferences, strategies and willingness to compromise. That is, membership turnover increases political actors’ uncertainty about what is acceptable for them in the negotiations.Footnote 51 New leaders are also less experienced than those with longer terms in office. This inexperience may result in longer bargaining periods when recently elected party leaders ‘learn’ how to negotiate efficiently. Furthermore, changes in party leadership are not random events. They are more likely after parties suffered a significant electoral defeat.Footnote 52 Hence, leadership changes may concur alongside a loss in bargaining power, which in turn increases the uncertainty in the bargaining situation. Finally, changes in party leadership may also be the result of intraparty dissent.Footnote 53 In this case, the new leadership is under greater pressure from those who opposed the old leadership to ‘deliver’ in the upcoming coalition negotiations. These expectations regarding uncertainty at the party and party elite levels can be summarized in two hypotheses:
Hypothesis 3 (Incumbency): Incumbency decreases the duration of government formation attempts.
Hypothesis 4 (Leadership tenure): Leadership tenure decreases the duration of government formation attempts.
A COPULA APPROACH TO THE STUDY OF BARGAINING DURATION
Social science research concerned with the duration of various political phenomena relies on survival (event history) analysis as a methodological tool. As we are interested in the duration of individual formation attempts, however, we face two substantial methodological challenges. First, each observed formation attempt is likely to be a non-random selection of the population of all potential coalition governments. Thus government formation is a two-stage process in which (1) political parties decide whether to start coalition negotiations, only after which we then observe (2) the actual length and success of each individual formation attempt. To the extent that unobserved characteristics jointly influence both the likelihood of observing coalition negotiations and their duration, this initial non-random selection may lead to biased coefficient estimates in the subsequent duration stage.
Secondly, while arguably all formation attempts are made to build a government, not all of them are successful. About 30 per cent of all formation attempts result in the breakdown of coalition talks, and the empirical model needs to account for this competing risk of bargaining failure. This is particularly relevant when the competing risks of successful and failed government formation are correlated due to unobserved factors. In this context, treating the competing potential outcome as independent may again lead to biased coefficient estimates.
Regarding the potential selection–duration dependence, we follow Chiba, Martin and StevensonFootnote 54 and model the selection and duration of individual formation attempts as two interdependent processes in which both stages are linked via a joint likelihood function. The initial selection process is modelled as a multinomial choice problem: each observed government formation attempt is non-randomly selected among all 2 n −1 distinct combinations of legislative parties (that is, all subsets excluding the empty set), where n is the number of legislative parties. Specifically, we use a multinomial conditional logit specification to model this selection process. The dependent variable is a binary indicator differentiating between each potential (coalition) government that started negotiations (1) and all other potential governments (0). Concerning the independent variables that affect the likelihood of starting coalition talks, we rely on the literature on coalition formationFootnote 55 and model government formation as a function of (1) size, (2) ideology and (3) incumbency.
With regard to the potential dependence between the risk of successful and failed coalition bargaining in the duration stage, we use a competing risks framework that treats successful formation attempts as the outcome of interest and failed formation attempts as an alternate outcome.Footnote 56 Specifically, we estimate a Weibull accelerated failure time (AFT) competing risks model with bargaining time as the dependent variable. By doing so, we follow the approach suggested by Geskus,Footnote 57 and use a common censoring distribution (as in the semi-parametric Fine and GrayFootnote 58 model) that allows us to model covariate effects on cumulative incidence functions.Footnote 59 In this context, failed formation attempts remain in the risk set and contribute to the cumulative incidence function of successful formation attempts with a time-dependent weight, which in turn is determined by the inverse conditional probability of being censored after experiencing the alternate outcome. This allows us to analyse the probability of successful bargaining while taking into account the possibility that the bargaining process may fail.
The copula-based empirical approach models the selection and bargaining processes via a joint likelihood function. It accounts for the potential dependence between selection and duration as well as the successful and failed formation attempts to obtain unbiased coefficient estimates. The observed duration of each successful formation attempt is thus simultaneously determined by a multinomial logit model of government selection and a Weibull AFT competing risks model of bargaining duration. All (joint) likelihood models are estimated in R.Footnote 60
DATA AND MEASUREMENT
The empirical analysis is based on an original dataset of 303 multiparty government formation attempts in nineteen Western and Central Eastern European democracies between 1980 and 2014.Footnote 61 This dataset contains detailed information on the start and end dates of each formation attempt as well as on the identity of the parties involved. Collecting comparative data on individual attempts requires profound knowledge of the formal and informal rules and regulations that characterize government formation in each country. The data are thus collected by country experts on coalition politics on the basis of extensive content analyses of national media reports – mostly daily and weekly newspapers – concerned with coalition negotiations and government formation.Footnote 62 This original dataset is then merged with data on cabinet structural attributes, party leader survival and party position data.
The dependent variable captures the duration of each individual coalition formation attempt. More importantly, we break down the overall bargaining process into the number of days parties were engaged in a negotiation process. Specifically, we measure bargaining duration as the time period between the onset of official multiparty negotiations and the official conclusion of coalition talks between parties, either by successfully concluding the government formation period (for example, by signing a coalition agreement) or by the breakdown of the coalition talks.
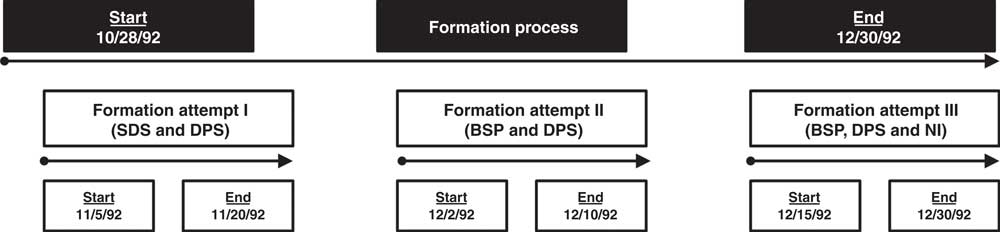
Figure 1 illustrates the coding process for the Berov I cabinet in Bulgaria. The minority government led by Philip Dimitrov from the Conservative Party (SDS) lost a vote of confidence and resigned one year after the general election in 1991. No early elections were called, and both the Conservatives and the Socialists (BSP) unsuccessfully attempted to forge a coalition with the Rights and Freedoms Party (DPS). An agreement was reached only after several defecting members of parliament from the SDS joined the talks, which ended a period characterized as ‘weeks of political chaos and tough negotiations’.Footnote 63 The overall formation process lasted for about two months. During that period, there were three individual formation attempts, of which two failed and one was successful.
Formation process and individual formation attempts of the Berov I cabinet Note: timeline not to scale. The bargaining parties are the Conservative Party (SDS), the Socialist Party (BSP), the Movement for Rights and Freedoms (DPS) and New Choice (NI).

Concerning the key independent variables, the measures of party issue preferences are based on the Manifesto Project (MARPOR) content analysis of parties’ policy programs.Footnote 64 For preference tangentiality, we estimate the party-specific emphasis across thirteen different policy jurisdictions, such as finance, interior or social affairs.Footnote 65 Following Falcó-Gimeno,Footnote 66 we then measure preference tangentiality as the average standard deviation of party issue emphasis across issue areas. Higher values indicate more tangential preferences, while lower values characterize parties with similar issue agendas.Footnote 67 The ideological range of each potential coalition government – the second preference-based determinant – is simply given by the distance between the left-most and the right-most bargaining party on the MARPOR general left–right scale.
Regarding bargaining uncertainty in terms of the incumbency of a potential government, we use an indicator variable taking a value of 1 if all parties involved in a particular formation attempt were in office in the most recent (coalition) government, and 0 if at least one of the bargaining parties was not in office. This information is retrieved from the ERD datasetFootnote 68 for Western Europe and a complementary dataset on coalition governance in Central Eastern Europe. The second actor-centric measure of bargaining uncertainty – leadership tenure – is operationalized on the basis of the party leaders’ time in office (in years). Comparative data on the party leaders’ time in office are recovered from Keesing’s World News Archive, the Munzinger Online Archive and a private online database.Footnote 69 These sources are cross-checked and, where necessary, supplemented by case studies on political parties. For each formation attempt, we first identify the party leader with the shortest tenure in office among all bargaining parties. We then estimate the time span between the start of each formation attempt and this party leader’s inauguration. Given the variable’s considerable positive skew, we log-transform it in order to symmetrize the residuals.
We account for several control variables at the attempt, party system and country levels. At the level of individual formation attempts, we expect that the number of bargaining parties increases the duration of government formation processes. A second characteristic associated with shorter bargaining duration is the pre-electoral identifiability of future (coalition) governments.Footnote 70 Thus we test whether pre-electoral coalitions accelerate government formation. An indicator variable captures whether at least two of the bargaining parties had a pre-electoral coalition (1) or not (0). The data on pre-electoral coalitions in Western Europe from 1980 to 2002 are obtained from the appendix in Golder.Footnote 71 Complementary data for Western Europe from 2002 onwards and for Central Eastern Europe are obtained from an original dataset on pre-electoral coalitions collected by one of the authors. Another contextual factor is the time pressure under which coalition formation takes place. Deadlines play an important role in government formation, as they increase the parties’ discount rates and thus the chances of swift formation processes.Footnote 72 To measure this time pressure, we identify the relevant dates for the end of the fiscal year and the summer recess using each country’s parliamentary calendar. Time pressure is then operationalized as the remaining log-transformed time in days at the start of each formation attempt until the summer recess or the end of the fiscal year, whichever comes earlier.
At the party system level, we control for bargaining complexity on the basis of the legislative party systems typology developed by Laver and Benoit.Footnote 73 Given the parliamentary seat distribution, they differentiate between six different configurations of parliamentary systems, ranging from party systems in which a single party controls a majority of the parliamentary seats (Type A) to open party systems in which there is no winning two-party coalition (Type E). In addition, we use a dummy variable to distinguish government formation processes after elections (1) from those between elections (0). Post-election status is widely used as a proxy measure for uncertainty in the party system, and its effect on formation duration is among the most robust empirical findings in the scholarly literature.Footnote 74
At the country level, we account for semi-presidentialism and positive parliamentarism. Given the considerable influence of the head of state on the government formation process in semi-presidential systems,Footnote 75 we would expect government formation to take longer in these contexts. The second institutional determinant is related to the investiture requirement of the potential government. Governments under positive parliamentarism need the explicit support of a parliamentary majority, while those under negative parliamentarism only have to make sure that there is no parliamentary majority that explicitly opposes them.Footnote 76 Here, the additional institutional requirement of positive parliamentarism should prolong bargaining between parties.Footnote 77 All empirical models include two additional indicator variables for formation attempts in Central Eastern Europe and the first fully democratic election following these countries’ democratic transitions.
Given the presence of multiple spell data, that is, the potential occurrence of several formation attempts within one formation process, we also control for lagged duration and occurrence dependence. We account for the possibility that the duration of a particular formation attempt may be affected by the length of previous government formation attempts by using a lagged dependent variable – setting it to 0 for the first formation attempt in each formation process. Similarly, occurrence dependence designates contexts in which the mere occurrence of previous spells (that is, formation attempts) affects the duration of subsequent coalition talks. Thus we add a control variable that indicates the number of previous formation attempts in a given formation process. Finally, all models feature year fixed effects to account for any secular time trends, most notably the increasing comprehensiveness of party manifestos over time.Footnote 78
EMPIRICAL ANALYSIS
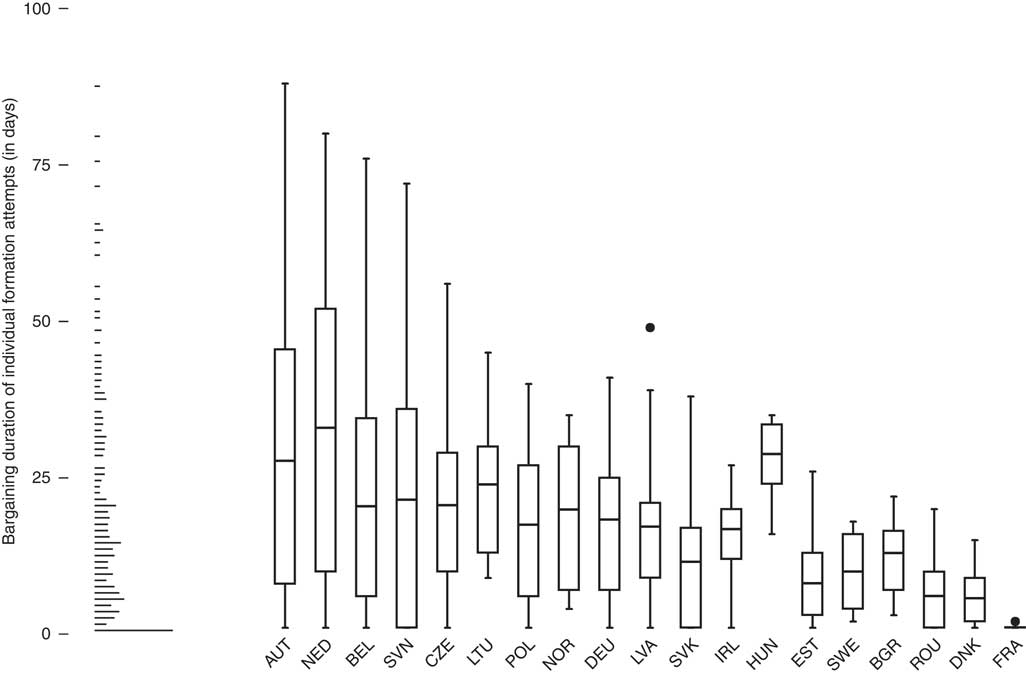
We start the empirical analysis with a brief discussion of the dependent variable. Figure 2 shows the distribution of bargaining duration for individual formation attempts across countries. The distinct boxplots show the distribution of bargaining duration by country. The bands inside the boxes depict the average (not median) bargaining duration, while the whiskers span all data points within 1.5 times the interquartile range of the nearer quartile.
Bargaining duration of individual formation attempts Note: the density plot along the y-axis shows the overall distribution of the bargaining duration of individual formation attempts. The box plots show the distribution of bargaining duration by country. The band inside the box depicts the average (not median) bargaining duration, while the whiskers span all data points within 1.5 times the interquartile range of the nearer quartile. The countries are ordered according to the level of variance of bargaining duration.

As apparent from the scheme, there is considerable variation in the duration of individual formation attempts across and within countries. About 15 per cent of the formation attempts last only a single day. In contrast, the most extensive coalition talks last more than twelve weeks. Yet these excessive bargaining periods are the exception rather than the rule, as the median and average bargaining duration is 13 and 16.9 days, respectively. The country-specific boxplots also show considerable variation between countries. The average bargaining duration in Romania (~6 days) is noticeably shorter than in Austria (~28 days) or the Netherlands (~33 days). Most importantly, however, we observe substantive variation within countries at the level of individual formation attempts. In fact, a variance components model suggests that approximately 75 per cent of the total variance is attributable to that level of analysis.Footnote 79 This is strong prima facie empirical evidence for going beyond contextual factors and emphasizing actor-specific explanatory variables at the level of individual formation attempts.
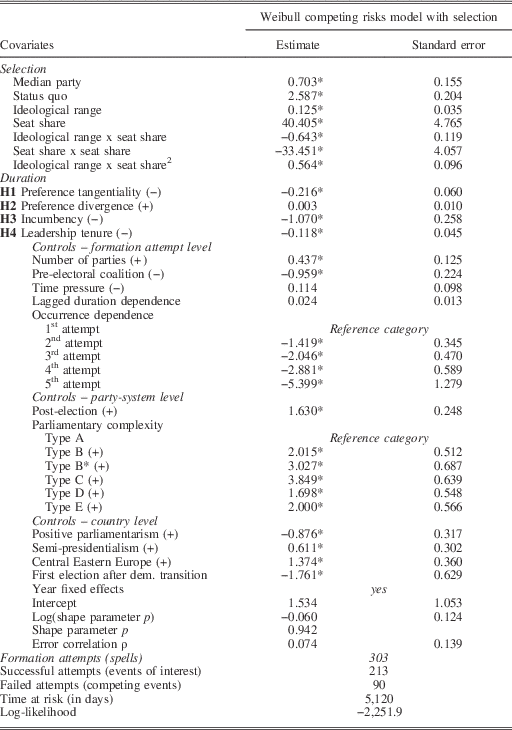
Table 1 presents the results of a two-stage duration model that accounts for non-random sample selection and non-random informative censoring of competing risks. The cell entries report coefficient estimates with standard errors based on the accelerated failure time parameterization. Accordingly, positive coefficients delay government formation, while negative coefficients expedite the process. Overall, the model provides consistent support for three of four hypothesized determining factors of bargaining duration. At the same time, we observe a positive though insignificant correlation (ρ=0.074) between the selection and bargaining duration stages.
Determinants of the Duration of Individual Formation Attempts

Note: all duration stage coefficient estimates are expressed in accelerated failure-time metric. Positive coefficients indicate factors that delay government formation, while negative coefficients are indicative of factors which expedite government formation. * p<0.05
Starting with the initial selection stage, the empirical results conform to existing theories of government formation. Both size and ideological coherence increase the likelihood that political parties start bargaining over the formation of the future government. At the same time, both interaction effects indicate that the impact of size decreases as the potential government’s size increases, while size and ideological homogeneity indeed display a mutually reinforcing multiplicative effect.
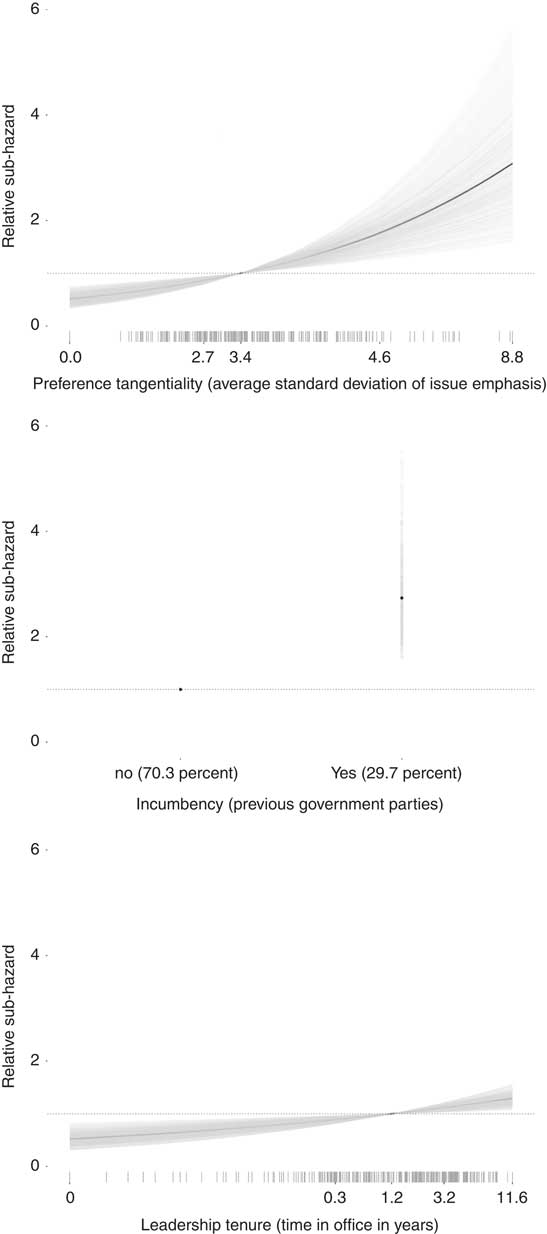
Turning to the duration stage, the empirical results indicate that coalition talks among parties that emphasize different issues in their policy programs are considerably shorter (Hypothesis 1). The upper panel in Figure 3 shows how the risk of successfully concluding coalition negotiations changes with varying levels of preference tangentiality. The benchmark is the median value of preference tangentiality (preference tangentiality ~3.4). Thus parties with a considerable degree of issue overlap in their policy programs (preference tangentiality ~2.7, 1st quartile) are approximately 14 per cent less likely to finalize their coalition talks than parties with more tangential preferences at the median value. Similarly, increasing preference tangentiality from the median (3.4) to the third quartile (4.6) enhances the risk of concluding coalition talks by about 27 per cent. One way to put this effect into context is to estimate how it affects the median survival time of a ‘representative’ formation attempt (that is, keeping all other variables at their mean,Footnote median or mode, respectively). The median survival time indicates the duration after which half of all formation attempts are concluded while the other half are still ongoing.Footnote 81 As such, it provides a good approximation of the estimated length of a ‘typical’ formation attempt. For a representative case, increasing parties’ preference tangentiality from the first to the third quartile (from 2.7 to 4.6) reduces the median bargaining duration by twelve days.
Relative sub-hazards Note: each plot depicts the estimated sub-hazard for varying levels of one of the three significant key independent variables, relative to the variable’s median value. Thus a relative sub-hazard of two indicates that for the given value of the independent variable the formation attempt is twice as likely to be successfully terminated as compared to the independent variable’s median value. Each thin grey line (dot) shows the relative sub-hazard for one of the 1,000 draws estimated using parameter and covariance estimates obtained from the model in Table 1 (and discarding those 2.5 per cent of the estimates at the lower and upper end of the distribution). The median estimate is highlighted by the thick black line (dot). The rug plot shows the distribution of the independent variable. All graphs were generated in R using a modified version of Gandrud’s80 simPH package.

In contrast to preference tangentiality, there is no empirical evidence that preference divergence has a significant impact on the duration of government formation (Hypothesis 2). Thus when the extent to which parties emphasize different issues is taken into account, ideological distance within the potential coalition plays no substantial role in the duration of government formation. Moreover, it is worth noting that preference divergence has an indirect effect as a strong predicting variable in the selection stage. Put differently, parties with ideologically diverse policy platforms are less likely to start coalition talks, and in the constrained set of attempts that eventually materialize, preference divergence does not affect the duration of government formation attempts. We therefore discard Hypothesis 2.
The empirical analysis also indicates that incumbency significantly and substantially affects the duration of government formation (centre panel in Figure 3). Corroborating Hypothesis 3, the relative sub-hazard of successfully concluding coalition talks is approximately 2.7 times higher for formation attempts among the incumbent government compared to formation attempts that include at least one non-incumbent party. For a typical formation attempt, restoring the incumbent coalition government reduces the median bargaining duration by about 19 days.Footnote 82
In line with Hypothesis 4, tenure as party leader likewise decreases the duration of a government formation attempt (lower panel in Figure 3). Thus formation attempts between party leaders who are in office for a long time are concluded substantially and significantly faster than those that include inexperienced party leaders. Each additional year of party leader tenure raises the relative hazard of successfully concluding the coalition negotiations by approximately 6 per cent. Thus increasing the time in office from 1.2 years (median value) to 3.2 years (3rd quartile), for instance, increases the relative sub-hazard of successful coalition negotiations by about 11 per cent. In substantial terms, increasing leadership tenure from the 1st (0.3 years) to the 3rd quartile (3.2 years) decreases the estimated median bargaining duration by approximately 8 days.
Turning to the control variables, several factors at the attempt, the party system, and the institutional level exert considerable influence on the duration of multiparty bargaining. Specifically, the empirical results suggest that increasing the number of parties involved in a formation attempt significantly prolongs the duration of coalition talks. In contrast, formation attempts in which parties agree to form a coalition government before the parliamentary elections conclude significantly faster than those without such pre-electoral arrangements. Time pressure indicated by the time left until the parliamentary summer break or the end of the fiscal year has no significant effect on the duration of government formation processes.
Concerning the factors related to the party system level, the empirical analysis corroborates two prevalent findings of previous studies on bargaining duration. First, coalition talks after parliamentary elections, in which uncertainty is expected to be higher than between elections, take substantially longer. Secondly, formation attempts in a complex bargaining environment, in which no single party has a disproportionately strong position in parliament, are concluded significantly and substantially slower than attempts in which a larger party dominates the legislature. Finally, several country-specific attributes likewise exert considerable influence on the duration of individual formation attempts. Specifically, both semi-presidential systems and formation attempts in Central Eastern Europe delay government formation, while positive parliamentarism unexpectedly expedites the formation of a new government.
Overall, the empirical analysis of individual formation attempts unanimously and consistently supports the advanced preference tangentiality, incumbency and leadership tenure hypotheses. The empirical results also suggest that actor-specific characteristics significantly and substantially add to our understanding of the duration of individual formation attempts. Specifically, a likelihood ratio test indicates that certain features of individual formation attempts considerably increase the model fit. Yet gauging the substantial improvement in terms of predictive power is less straightforward. An alternate approach to assess the predictive power in survival analysis is based on the model’s ability to produce concordant pairs of observations based on their observed duration and their estimated hazard ratios (using Harrell’s C). A Monte Carlo cross validation using 1,000 random subsamples of 50 per cent of the observations as training and the remaining 50 per cent as validation sets indicates that incorporating actor-specific factors provides a considerable advantage in explaining bargaining duration. Specifically, the model’s predictive power based on Harrell’s C increases by approximately 100 per cent (or 7.5 percentage points) compared to a simple coin flip (that is, from about 58 per cent to over 65 per cent). Thus in addition to being the theoretically more appropriate specification, actor-specific features and characteristics also substantially increase the model’s predictive power.
DISCUSSION AND CONCLUSION
About 30 years ago, LuebbertFootnote 83 observed that ‘[f]or political elites and the news media, the [coalition] negotiations become almost an obsession. This is not surprising, for it is assumed with some justification that it is in these negotiations that the central issues of politics are decided: Who will govern? Who will benefit? and, Who will pay?’. However, political scientists have so far paid little attention to the causes of lengthy negotiations and bargaining processes prior to government formation.Footnote 84
This article presents a novel approach to the study of coalition bargaining duration in multiparty democracies. Based on an original dataset of 303 multiparty formation attempts in nineteen European countries, we analyse how preference tangentiality, ideological proximity, incumbency and party leadership tenure affect the duration of coalition talks. We find empirical support for most of the hypothesized effects: coalition negotiations are concluded earlier when parties care most about different issues, when they have been in government before and when party leaders have been in office longer. In line with previous research, our findings also show that the uncertainty and complexity of the bargaining context affect the duration of government formation processes.
Our analysis of government formation attempts is a response to previous studies that call for more actor-centric analyses of government formation processes.Footnote 85 Many explanatory factors deal with actor-specific characteristics such as the number of bargaining parties,Footnote 86 but studies of the level of the overall bargaining process cannot account for them. To the best of our knowledge, the present analysis is the first comparative study to test these effects on the level of individual formation attempts. We also follow recent calls to integrate several stages of coalition politics rather than study them in isolation.Footnote 87 Using a copula approach to account for the non-random selection of our model, we show that the observed sample of (successful and failed) formation attempts follows established theories in the government formation literature.
Our findings have several implications for understanding political bargaining processes and party competition. For one, they show the substantial analytical value of differentiating between government formation processes and individual formation attempts. This is particularly true when testing actor-specific hypotheses and those related to the bargaining context in a unified framework. Moreover, these findings highlight the importance of explanatory factors that have hitherto been neglected in the scholarly literature. One such factor is the role of political elites in the bargaining process. While parties are often treated as unitary actors in bargaining processes, our results highlight the importance of systematically including party elites’ characteristics to explain bargaining outcomes. We also identify factors to account for the length of formation attempts that are partly in the parties’ sphere of influence. Thus parties can choose coalition partners with which they expect ‘easy’ (that is, short) negotiations.
Our findings also suggest strategies that parties can use to increase their chances of entering government. Ceteris paribus, formateur parties that strive for smooth negotiations are more likely to start negotiations with parties that have more experienced party leaders and a rather distinct issue profile. Thus the chance to enter government may prolong a party leader’s time in office even if other incentives, such as electoral performance, would suggest otherwise. Similarly, niche parties that emphasize issues neglected by rival partiesFootnote 88 may appear to be particularly attractive coalition partners. Their preferences are more likely to be tangential to those of the formateur, which should ease the bargaining process. Our findings also speak to the literature that compares party and coalition politics in Western and Central Eastern Europe.Footnote 89 Similar to other phenomena such as government duration,Footnote 90 party systems in Western and Central Eastern Europe differ in terms of the duration of government formation processes.
The present study highlights the explanatory power of actor-specific factors for explaining delays in government formation processes. In addition to the level of policy conflict and the uncertainty among government parties, our results show that pre-electoral coalitions affect the duration of government formation processes. Future research may pay closer attention to additional factors such as the role of intraparty democracy and factionalism. How parties organize is a crucial determinant of many aspects of party behaviour. For Luebbert,Footnote 91 interparty negotiations in the government formation period are primarily a ‘ritual’ for intraparty purposes.Footnote 92 Thus coalition negotiations including activist-centred parties may take more time to form than those that include leader-centred parties. Intraparty politics thus may be a useful starting point for future research on delays in government formation processes.