1 Introduction
The standard view in the pension literature is that pay-as-you-go (PAYG) systems distort labor market incentives as returns on pension contributions are lower than those on other forms of savings (Samuelson, Reference Samuelson1958). Parametric reforms discussions of PAYG systems thus focus prominently on tightening the contribution–benefit linkage to increase actuarial fairness (Lindbeck and Persson, Reference Lindbeck and Persson2003, and references therein). In this connection, extending the averaging period of contributions used to calculate pension benefits has received a fair amount of attention in the literature, but not in the context of quantitative assessments using applied dynamic general equilibrium (DGE) models.
This paper evaluates the macroeconomic and welfare effects of extending the averaging period. It also examines the complementarities between these extensions and increasing the retirement age under alternative tax scenarios. The evaluation is based on a DGE framework in the Auerbach–Kotlikoff tradition applied to the Spanish economy.
Spain serves as a valuable case study in this regard. First, the public PAYG system calculates pension benefits based on average, inflation-indexed, gross wage earnings in the corresponding averaging period. Moreover, reforms implemented in 1997 doubled the averaging period to the last 15 years of an individual's work life. Second, Spain reached a broad political and social consensus – known as the Pacto de Toledo Footnote 1 – on the need to preserve the public PAYG system through reforms geared to ensuring its sustainability, including those that tighten the alignment of benefits and contributions; the Pacto ruled out privatization and reforms toward compulsory fully funded schemes. Third, even considering Spain's remarkable immigration phenomenon, the demographic shock is expected to be larger and thus pose a more substantial challenge for long-run fiscal sustainability than elsewhere in Europe.
Previous studies have examined the Spanish case. Diamond (Reference Diamond2001) identified the labor market distortions arising from the short averaging period and advocated extending it to the entire work life, but did not quantify the impact of this reform.Footnote 2 Without benefiting from a DGE approach, Jimeno (Reference Jimeno2000 and Reference Jimeno2003) concluded that extending the averaging period results in pension expenditure reductions ranging between 1 and 2 percentage points of output. Díaz-Gimenez and Díaz-Saavedra (Reference Díaz-Gimenez and Díaz-Saavedra2007) studied delaying the retirement age in a model that accounts for educational trends and households' heterogeneities, but did not examine how this reform interacts with an extension in the averaging period.Footnote 3
This paper provides a more comprehensive assessment of the effects of extending the averaging period in Spain. The general equilibrium structure of the model employed here follows the Auerbach–Kotlikoff tradition, but it incorporates a stylized version of the Spanish pension rule whereby the old-age benefit is calculated based on average gross wage earnings in the corresponding averaging period, which is initially set to the last 15 years of an individual's work life. Also, this is the first study in the literature that evaluates the macroeconomic effects of extending the averaging period in Spain using a dynamic general equilibrium framework that accounts for the following relevant features of the pension system and the economy: distortionary taxation and tax smoothing; grandfathering of current generations; complementarity of reforms that extend the averaging period and increase the retirement age; and health-related public expenditure pressures associated with population aging. All these features of the pension system and the economy play a key role in our simulations. In a complementary paper, Sanchez Martín (Reference Sanchez Martín2008) studies the distributional effects of pension reforms in a model with intra-cohort household heterogeneity and a fiscal system based on lump-sum taxation.Footnote 4
We ignore intra-cohort household heterogeneity to evaluate the aggregate effects of reforming the Spanish pension system in a more transparent manner. The reforms that we study – extending the averaging period and increasing the retirement age – affect the intertemporal incentives of households. For this reason, we consider more worthwhile increasing the complexity of the model and simulation exercise along the time dimension: by including grandfathering rules, tax smoothing in a distortionary tax system, and health-related public expenditures that vary with the population's age structure. We believe that distributional effects are interesting and important, but they are studied in Sánchez Martín and Marcos (Reference Sánchez Martín and Marcos2008) and Sanchez Martín (Reference Sanchez Martín2008) . Adding intra-cohort household heterogeneity to this paper would complicate the discussion of the intertemporal effects associated with the pension reforms that we study.
The baseline simulations underscore the extent of the fiscal challenge in Spain: pension expenditures increase, as a share of output, by 16 percentage points and the consumption tax rate rises by more than 30 percentage points by 2050 to finance aging-related expenditures. The projected increase in pension expenditures are thus 9 percentage points and 3 percentage points higher than those projected, respectively, by the European Commission (EC, 2006) and Rojas (Reference Rojas2005) . The baseline simulations assume a tax-as-you-go fiscal policy, whereby the consumption tax rate is adjusted annually to finance age-related expenditures, and reflect the impact on individual pensions of increases in the dependency ratio and the wage rate as labor becomes scarce.
Parametric reforms, however, deliver substantial macroeconomic and welfare benefits. These arise from lower and flatter paths of consumption tax rates, which reduce distortions to households' consumption-saving decisions, and the extension of the averaging period, which removes labor market distortions.
Specifically, the paper considers two pension reform scenarios. First, a partial pension reform scenario – gradually increasing the retirement age,Footnote 5 while holding constant the averaging period – provides a meaningful benchmark to evaluate the effects of extending the averaging period. This reform attenuates expenditure pressures and the needed increase in taxes, while boosting the aggregate capital stock and output. It reduces the increase in pension expenditure, as a share of output, by 4 percentage points and the consumption tax rate increase by 7 percentage points over the next 40 years. These results differ from those in Díaz-Gimenez and Díaz-Saavedra (Reference Díaz-Gimenez and Díaz-Saavedra2007) which evaluates reforms delaying retirement when retirement is endogenous but, unrealistically, current generations are not grandfathered.
Second, a full pension reform scenario – that, in addition, gradually extends the averaging period to the entire work life – further reduces the increase in pension expenditure, as a share of output, by 4 percentage points and the consumption tax rate increase by 7 percentage points over the next 40 years. In other words, extending the averaging period is as important in mitigating the aging-related spending as is increasing the retirement age.
In either reform scenario, pre-funding the fiscal impact of the demographic shock by ‘tax smoothing’ – a once-and-for-all increase in the consumption tax rate – further attenuates the adverse macroeconomic effects in the demographic transition. However, pre-funding shifts the tax burden from generations that are active when the dependency ratio peaks to current and future generations. Relative to the baseline, the combined effect of pension reforms and pre-funding creates net welfare losses for some current generations and net gains for all future generations. Thus, a Pareto improving package of reforms will require additional compensating mechanisms. These may include delaying the increase in the consumption tax rate or targeting transfers to net losers financed with public debt.
The simulations also reveal broader qualitative implications of extending the averaging period. First, under a tax-as-you-go policy, its contribution to limit tax rate increases varies over time: it limits the increase in individual pension benefits at the peak of the demographic transition – when wage rates rise faster – more than in the long run.Footnote 6 Second, in the long run, extending the averaging period to the entire work life results in the largest welfare gains when technological progress is high. In the absence of technological progress, welfare gains are maximized with a shorter averaging period. And third, pension reforms generate aggregate labor cycles. Increasing the retirement age induces a ‘bust-boom’ cycle. Aggregate labor declines at the outset of the reform but increases thereafter, reflecting households' intertemporal labor substitution effects: households work more at older ages, when their skills are low, and exert less effort during their middle work lives, when their skills are high. Initially, aggregate labor declines because many households are in their middle work lives, but as time goes by more cohorts enter the upper age ranges and aggregate labor increases. In contrast, extending the averaging period causes a ‘boom-bust’ cycle because households intensify labor effort during their middle work lives, when skills are highest, and exert less effort when they are close to retirement.
The rest of the paper is organized as follows. Section 2 discusses the model and its calibration. Section 3 presents the baseline scenario that serves as a benchmark for the pension reform scenarios; the latter are discussed in Section 4, where the analysis of extending the averaging period is anchored by, and made conditioned on, a gradually increasing work life. Section 5 concludes.
2 The model
Model overview
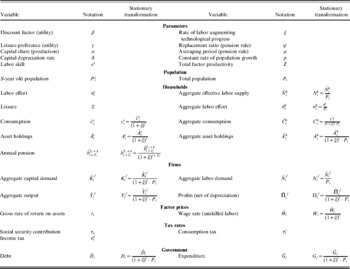
As noted above, the general equilibrium structure is standard and follows the Auerbach–Kotlikoff tradition.Footnote 7 Nevertheless, the old-age benefit is calculated based on average gross wage earnings in the corresponding averaging period, which is initially set to the last 15 years of an individual's work life.Footnote 8 Household's life expectancy is exogenous and increases over time to match demographic projections. Although the retirement age is also exogenous, labor supply is endogenous as households choose the amounts of labor and leisure time during their work life. Labor skills (productivity) vary exogenously with age to account for the observed hump-shape in wage rates over years of employment. Also, the aggregate economy benefits from labor-augmenting productivity growth. Finally, the model explicitly accounts for the effects of population aging on public health-related expenditures. In what follows, the model is presented in stationary form and, for the reader's convenience, its notation is summarized in Table 1.
Variable definitions and notation

Note: Superscripts (subscripts) indicate the age of the household (time period); stock variables are dated at the beginning of the corresponding year.
Household
The lifetime utility of a household that is born (enters the labor force) at time t is determined by its lifetime consumption (c) and leisure (l)

where the household's life comprises two distinct phases: a work life lasting T t periods or years (s=1, …, T t) and a mandatory retirement lasting T tR years (s=T t+1, …, T t+T tR); across generations, household's life expectancy and retirement age are allowed to vary and are non-decreasing over time. A household is endowed with a fixed number of hours per year that is normalized so that work (n) and leisure (l) add up to one

A household accumulates assets (A) during its work life according to the following budget constraint

where next year's assets are determined by adding to this year's assets the household's savings, which in turn are obtained by adding net return on assets to net wage income and subtracting gross consumption. As noted above, the household's labor productivity per hour varies with age according to a skill premium (e s), which is defined as the relative productivity of an s-year old household to that of a one-year old (unskilled) household. The latter is normalized to 1 so that W denotes the wage per unit of labor time of an unskilled worker. In equation (3), the household takes as given the payroll (τ), income (τI ), and consumption (τc) tax rates, and the interest (r) and wage (W) rates.Footnote 9 Note that taxes are distortionary. This feature of the model is key to quantify the adverse incentives and the general equilibrium effects of population aging and pension reforms. Tax distorsions (deadweight losses) grow exponentially as tax rates increase, and as we show in the simulations, coping with population aging in Spain will require large increases in taxes. Thus ignoring tax distortions by assuming lump-sum taxation as in Sanchez Martín (Reference Sanchez Martín2008) is not innocuous: it results in an underestimation of the fiscal and macroeconomic effects of population aging and it leads to an underestimation of the benefits of introducing reforms.
During retirement, the household's wage income is replaced by an old-age pension (b) in the budget constraint, as follows

The old-age pension for a household born at time t and retiring at time t+T t is computed as

where the average (gross) wage in the averaging period (covering the last μ years before retirement) is ‘scaled down’ by the replacement ratio (Ψ).Footnote 10 Note that pension benefits and real wage earnings are discounted by labor augmenting productivity growth (ξ) in equations (4) and (5). This discounting reflects the fact that household's pension benefits and the past nominal wage earnings used to compute the initial pension benefit are adjusted by inflation, but not by productivity growth.Footnote 11
The model assumes that there are no intergenerational bequests or inheritances: the household is born (enters the labor force) with zero assets at age s=1, and dies without assets at age s=T t+T tR+1, and thus 
The household's problem is to choose the paths of consumption, leisure and asset holdings  to maximize its lifetime utility (1) subject to constraints (2)–(5) and
 This can be expressed as a sequence of two dynamic optimization problems, as follows


where 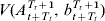 is the household's value function or discounted indirect utility when it retires at time t+T t having reached the age of T t+1 years. Upon retirement, the household's optimization problem can be expressed recursively, and a closed-form solution for the value function (V) follows from the log utility assumption.Footnote 12
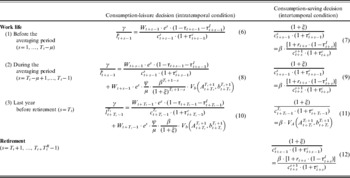
Two sets of conditions solve the household's problem under standard dynamic optimization techniques; Table 2 contains these sets of first-order conditions where V A(.) and V b(.) denote the partial derivatives of V(.) with respect to  and
 . The first set – equations (6), (8), and (10) – refers to a household's consumption-leisure choice at specific ages (intratemporal conditions) and, in each period, households equate the marginal utility of consumption (scaled by wages) to the marginal utility of leisure. The second set – equations (7), (9), (11), and (12) – governs the household's consumption-saving decisions over time (intertemporal conditions, or Euler equations),Footnote 13 whereby households equate the marginal utility of current consumption to the discounted marginal utility of future consumption (scaled by the net return on savings).
Household's optimization problem – first-order conditions
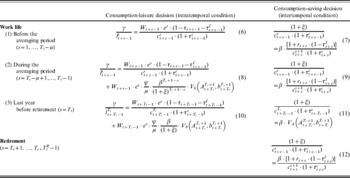
These conditions reflect whether a household is working or retired and the peculiarities of the Spanish pension rule. Specifically, while the household is in the labor force the pension rule introduces three subperiods in the household's optimization problem. The first comprises the initial years in the labor force prior to the averaging period (μ) (s=1, …, T t−μ), so that a household's annual wage earnings do not affect future pension benefits. The second corresponds to the first μ−1 years in the averaging period (s=T t−μ+1 ,…, T t−1) when the consumption-leisure choice also reflects the fact that wage earnings accrued in this subperiod provide additional utility during retirement (because of their effect on pension benefits);Footnote 14 the consumption-saving decision, however, remains unchanged. In the final year of the averaging period (s=T t), the consumption-saving decision reflects the retirement of the individual in the following period (V A). When the household retires (s=T t+1 ,…, T t+T tR−1), there is no labor supply choice and only the consumption-saving decision remains.Footnote 15
Aggregate consumption (C th), effective labor supply (N th), and assets (A th) are obtained by aggregating individual household's variables at each point in time, as followsFootnote 16

Firms
Firms maximize profits net of capital depreciation  . They do so subject to a constant-returns-to-scale Cobb–Douglas production function with labor-augmenting technological progress

where δ is the rate of capital depreciation. Both output and factor markets are perfectly competitive and firms thus face given wages (W t) and rental rates (r t). The first-order conditions require that W t and r t+δ equal, respectively, the marginal product of labor and capital

The government
As noted before, the government collects payroll, income, and consumption taxes from households and sets taxes to ensure long-run fiscal sustainability. Tax revenues are used to finance public consumption (G), pension benefits, and redeem government debt (D). Public consumption has two components: health-related public consumption driven by changes in the population's age structure (see Appendix I for details); and non-health-related public consumption that remains constant as a share of aggregate output. The government's budget constraint can thus be expressed as followsFootnote 17

where the (non-social security) primary deficit (term in brackets), and the social security deficit (last two terms) are shown separately.
Equilibrium
An equilibrium simultaneously places all households and firms on their maximizing paths, establishes the solvency of the government, and clears markets. Consider an initial population of size P 0 with age structure  , a given sequence of newborn cohorts
 with work lives
 and life expectancies
 , initial public debt D 0⩾0, capital stock K 0>0, and assets distribution
 , such that
 . Formally, the equilibrium is a collection of lifetime plans for households born during the period of analysis (t⩾0),
 , for t=0, 1, …, ∞, and for those of ages 2 through T 0+T 0R at t=0 that face ‘truncated’ lifetime plans
 for
 ; a sequence of allocations for the firms
 ; a sequence of relative prices of labor and capital
 ; and a sequence of government variables including payroll, income, and consumption tax rates, and government consumption and debt,
 , such that, for t⩾0, firms and households solve their optimization problems; the government budget constraint is satisfied; the labor market clears, N t=N tf=N th; the asset market clears, A t=D t+K tf=A th; and the output market clears,
 , where Y t=Y tf and C t=C th are the equilibrium aggregate output and consumption levels.
Balanced growth path and calibration
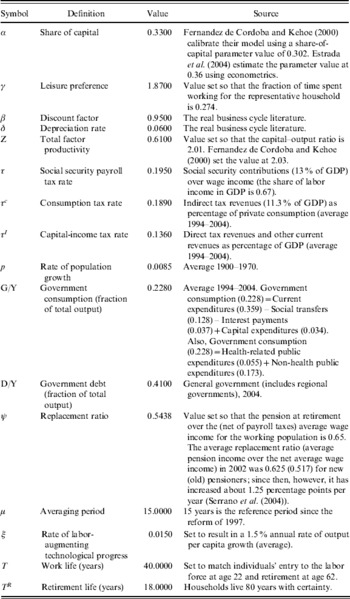
The model is calibrated to match some relevant features of the Spanish economy. To do so, a balanced growth equilibrium path is defined – assuming a constant population growth rate (p), work life (T t=T), retirement age (T tR=T R), and a fiscal policy characterized by constant tax rates and unchanged ratios of public expenditure and debt to output – and used to express the steady state in terms of detrended variables in the stationary-transformed model.Footnote 18,Footnote 19Table 3 and Appendix I summarize the values used in the calibration and their sources. The calibration exercise verifies that the endogenous variables in the initial steady state and public expenditure and tax ratios closely match those in the Spanish data.
Calibration of the baseline model (initial steady state)

Sources: National Accounts and Labor Statistics: Instituto Nacional de Estadística (INE) and AMICO; Fiscal Accounts: Ministerio de Economía y Hacienda, IGAE; Population: INE; Life expectancy: World Health Organization and World Bank (2004).
Household's labor, consumption, and asset holdings in the initial steady state
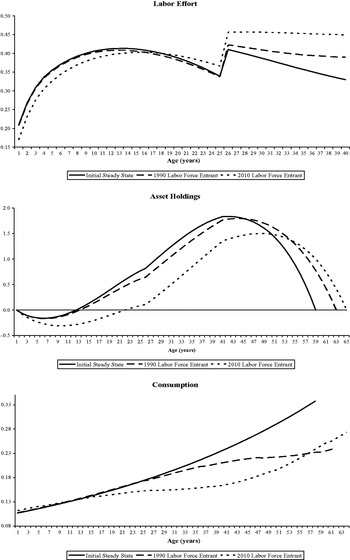
As anticipated, the averaging period introduces a discrete jump in the households' labor effort profile 15 years before retirement (Figure 1). Upon entering the averaging period the number of hours worked jumps, and remains high until retirement, because households internalize the effect of their labor effort on the future pension. At the beginning of work life, households are relatively unskilled and thus work few hours; however, as they age, and labor skills improve, time devoted to work increases. This upward trend disappears before entering the averaging period, even though skills are still increasing.Footnote 20 This is because households reduce labor effort before the averaging period to compensate for the higher labor effort they will exert during the averaging period, which dominates over the incentives to increase labor effort provided by the gains in skills.
Household's labor effort (n s), asset holdings (A s), and consumption (c s) profiles by age (in the initial steady state and for selected generations in the baseline scenario.)

Still, household's wage earnings increase throughout their worklife. Accordingly, households incur debt at the beginning of their lives to partially smooth consumption – which increases over time because the households' rate of time preference is lower than the net rate of return on assets. During the averaging period, households intensify their asset accumulation to supplement their pension income and boost consumption during retirement. In retirement, consumption is highest and assets are depleted.
3 Baseline simulations
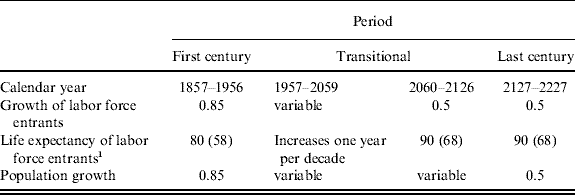
The time line for the simulations is a 370-year period divided into three unequal subperiods; the beginning of these periods are 1857, 1957, and 2127. In the first 100-year subperiod, the economy is in the steady state described in Section 2. The second subperiod covers the demographic transition – from high to low fertility rates and rising life expectancy – that takes 170 years to work itself out. In the final 100 years, the economy is in a new steady state characterized by lower population growth and higher life expectancy.Footnote 21
Demographic transition
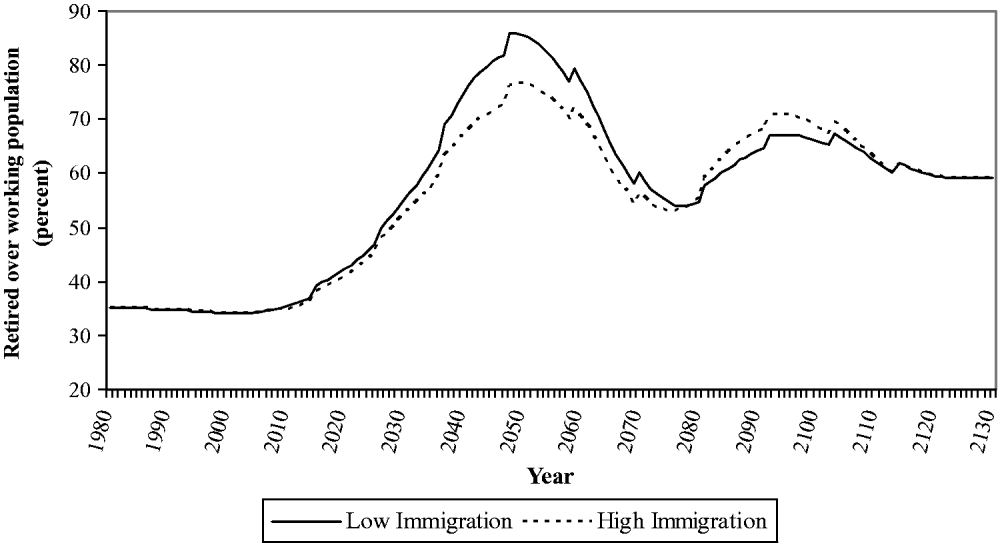
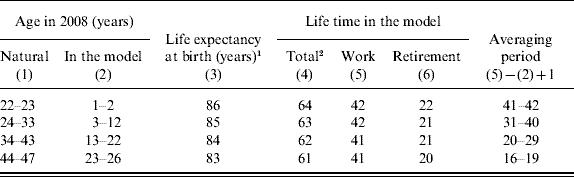
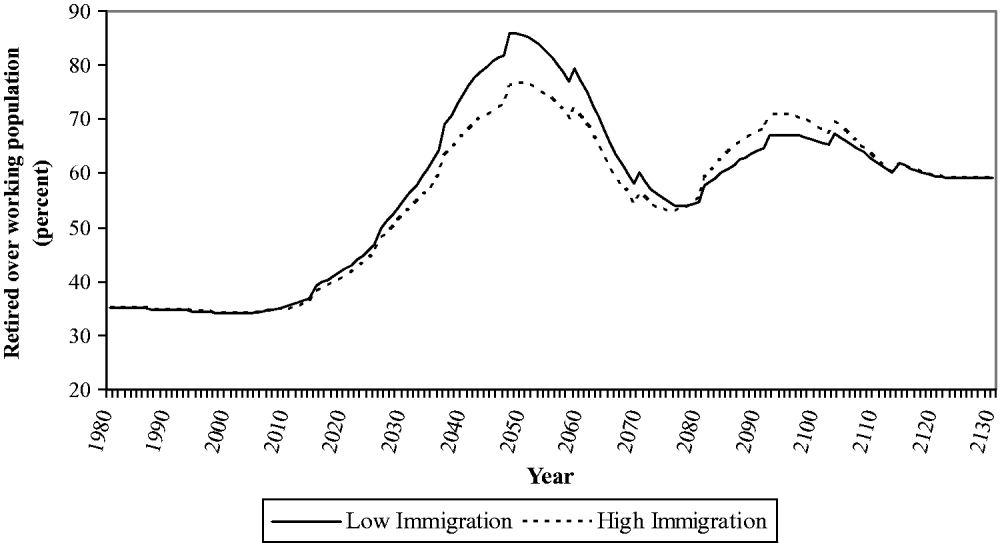
Among the exogenous elements, the demographic shock and immigration merit discussion. During the demographic transition, life expectancy increases one year per decade starting in 1957; households entering the labor force nine decades later die at 90 years of age compared to 81 years of age at the outset of the transition (Table 4). The number of labor force entrants reflects fertility rates, combined with immigration, which is set so that the endogenous trajectory of the model's dependency ratio – the ratio of the population 62 years and older to the population between 22 and 61 years of age – matches that of the official projections through 2060 (Figure 2).Footnote 22 Specifically, the model reproduces the Spanish National Statistics Institute's (INE) low-immigration scenario; using instead INE's high immigration scenario does not change substantially the quantitative results (for details, see Catalán et al. (Reference Catalán, Hoffmaister and Guajardo2007) .
Model's Dependency Ratio
Simulated demographic scenario
(Annual percentage growth rates, unless otherwise indicated)
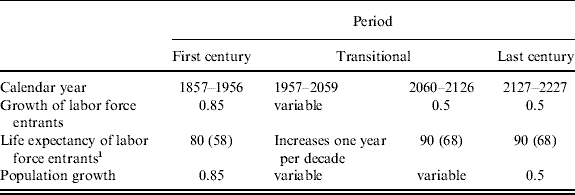
Note: 1 Natural life expectancy at birth of the cohort entering the labor force in a given year. Numbers in parentheses indicate remaining life time upon entry to the labor force in the model. Strictly, life expectancy increases one year per decade between 1957 and 2047, and is constant thereafter.
Baseline macroeconomic scenario
In the baseline simulation, the parameters of the social security system – retirement age and averaging period – remain unchanged. Also, as fiscal pressures arise during the demographic transition, the government implements a ‘tax-as-you-go’ policy: each year consumption tax rates are adjusted to finance the added expenditure, while other tax rates and non-health expenditure-to-output and debt-to-output ratios remain constant.Footnote 23
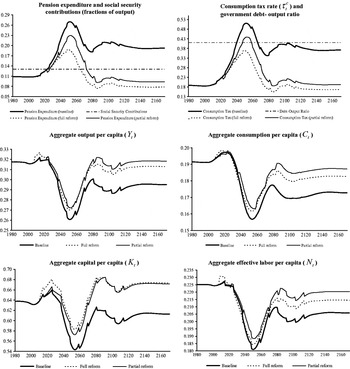
The baseline simulations suggest that pension expenditures, as a share of output, increase by 16 percentage points by 2050 with severe macroeconomic consequences (Figure 3). The consumption tax rate peaks at 51% in 2050, which is more than 30 percentage points higher than in 2007. As a result, output and consumption per capita are 18% lower than in the initial steady state.Footnote 24
Macroeconomic results under tax-as-you-go – baseline and pension reform scenarios (Unless otherwise indicated, variables are expressed as deviations from trend)

Output and consumption per capita deteriorate long before the peak of the demographic shock in 2050, but remain unscathed through 2025 even though taxes start rising in 2010. This reflects the fact that capital (per capita) increases with the rising share in the population of old working households that possess large asset holdings. Besides a higher marginal productivity of labor, aggregate effective labor is sustained by the rising share of old high-skilled working households. The change in the population's age structure also contributes to an increase in consumption per capita; this increase is reinforced by the anticipation of consumption by young generations that foresee tax rate increases. After 2025, however, capital, labor, output and consumption per capita fall sharply until about 2050. These declines reflect the growing importance in the population of young generations – typified by those entering the labor market between 1990 and 2010Footnote 25 (Figure 1) – that hold less assets because they have faced a heavier tax burden. Also, the newly retired generations that account for a larger share of the population deplete their asset holdings, reinforcing the downturn in output and capital.
Factor prices track the evolution of the dependency ratio: the return on capital falls, and the (stationary transformed) wage rate increases until about 2050. Thus, the (detrended) average pension rises by 14% and thereby exacerbates the expenditure pressures.
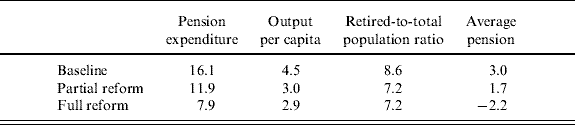
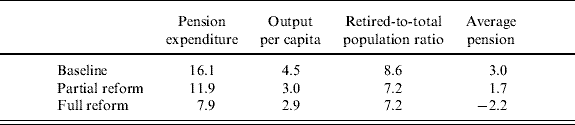
The general equilibrium effects on the average pension and output account for about half of the pension expenditure pressures (Table 5). Thus, these effects also help explain the differences with the EC's assessment of the fiscal impact of aging. Specifically, decomposing the pension expenditure increases shows that the increase in the average pension accounts for 3 percentage points, the decline in output per capita accounts for 4.5 percentage points, and the change in the population's age structure accounts for the remaining 8.6 percentage points.
Decomposition of the change in pension expenditure (2007–2050)
(Percentage points of output)
4 Simulations of pension reforms
As discussed above, two reform scenarios are considered. The first, a ‘partial pension reform’, increases households' retirement age with an unchanged averaging period. The second, a ‘full pension reform’ in addition extends the averaging period used to compute the pension benefit to the entire work life. Before discussing the demographic transition, it is useful to first understand the long-run impact of these reforms.
Effects of pension reform in the final steady state
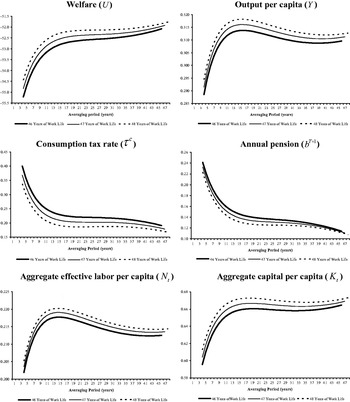
In a nutshell, reforming the pension system improves welfare in the final steady state, as the benefits associated with lower taxes – including lower intertemporal distortions in consumption and labor – more than offset the welfare costs of pension benefits cuts (Figure 4). A detailed discussion of this result follows.
Welfare and macroeconomic effects of pension reforms in the final steady state1 (Variables are expressed as deviations from trend, except the consumption tax rate)

Partial pension reform
Increasing the retirement age from 47 years to 49 years (and the work life from 46 years to 48 years) lowers the dependency ratio and boosts aggregate effective labor by increasing the number of cohorts working in each period.Footnote 26, Footnote 27 Higher lifetime labor income increases savings, which in turn increases the capital–labor ratio and the wage rate. And even though the wage rate is higher, individual pension benefits decline because the hump-shaped skills imply a reduction in households' average labor skills in the averaging period. Still, welfare improves as the lower individual pensions and dependency ratio imply lower consumption tax rates and increases in consumption.
Full pension reform
Extending the averaging period increases welfare monotonically despite the decline in pension benefits due to a concomitant decline in consumption tax rates. The decline in pension benefits, in turn, results from the interaction of the labor skills and technological progress. Specifically, when the averaging period is shorter than 15 years, extending it results in a higher aggregate effective labor supply that reflects the higher average skills and enhanced labor effort of households in the averaging period. Pension benefits decrease, however, as this effect is more than offset by the discounting effect of technological progress because wage earnings accrued at younger ages are more heavily discounted. When the averaging period is 15 years or longer, extending it decreases the aggregate effective labor supply as it results in lower average skills in the averaging period. This and technological progress reduce pension benefits. In either case, the decline in pension benefits allows a reduction in the consumption tax rate that boosts household's consumption and welfare. A full pension reform unambiguously increases welfare in the final steady state.
A word of caution regarding the welfare effects of extending the averaging period: the monotonic improvement depends on the rate of technological progress. Specifically, with no technological progress, welfare is maximized for an averaging period shorter than the entire work life (see Appendix II). When the averaging period is long and is extended further, the pension benefit rises as the decline in effective labor induces higher wages that, in contrast to the discussion above, are not deflated by technological progress. Consumption tax rates increase to finance the higher pension benefits, reducing household's welfare.
Note that in the model, welfare improves even though pension benefits decline because of the concomitant cut in consumption taxes, which increases household's (disposable) income. Households save an optimal share of this added income in ‘private retirement accounts’ that earn the market rate of return because they are fully rational and forward looking. In the rational environment of this model, there is no need for a compulsory private pension system, or a voluntary one based on subsidies and tax incentives (as envisaged in the ‘The Toledo Agreement’). In reality, however, myopia or self-control problems could thwart this forward-looking behavior. In this case, replicating the implications of the reforms discussed in this paper would require establishing (compulsory) individual retirement accounts (earning the market rate of return) where the proceeds from the tax cuts would be invested.
Effects of pension reforms in the demographic transition
The simulations discussed below assume that reforms are unanticipated. Households envisage the baseline scenario to unfold before reforms are simultaneously announced and implemented at the beginning of 2008. The announcement is credible and includes grandfathering clauses that provide full grandfathering for those households that are in the averaging period (or have already retired), and gradually less grandfathering to households further from retirement (Table 6).Footnote 28
New parameters of the 2008 pension reforms
(Generations subject to partial grandfathering)
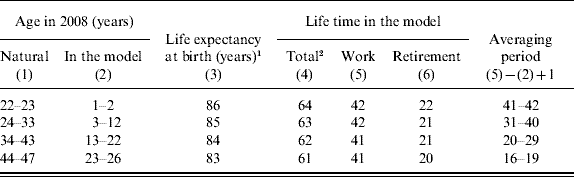
Notes: 1 Natural life expectancy at birth of the cohort of indicated age in 2008.
2 Remaining life time after entry to the labor force in the model.
Partial pension reform
A partial pension reform – increasing the retirement age – attenuates the expenditure pressures and consumption tax rate increases, while boosting the capital stock, aggregate labor, output, and consumption. Specifically, comparing the baseline and partial reform scenarios in Figure 3, the following effects are observed:
• Pension expenditures increase by 12 percentage points of output between 2008 and 2050 and the consumption tax rate peaks at 44% in 2053; these are respectively 4 percentage points and 7 percentage points less than in the baseline.
• The capital stock per capita is consistently higher, particularly after 2015. Aggregate labor per capita is substantially higher after 2023, but slightly lower before 2023, reflecting grandfathering clauses and households' behavior. Output per capita is substantially higher only since the early 2020s. By 2050, output per capita is 4% higher, or 14% lower than in the initial steady state.
• Capital–labor ratios and wage rates are consistently higher; while rates of return on assets are lower, except for a brief period (2038–44).
• Consumption per capita is considerably higher than in the baseline after 2025.
• Pension benefits are lower, but, as in the baseline, the average pension increases through 2050. Even though average pensions increase by 9%, (total) pension expenditures decline as the share of retired population in total population decreases in 2050 from 43% (baseline) to 26%.
• The decomposition of the pension expenditure pressures through 2050 show that the average pension, the population's age structure, and output per capita have similar contributions to limiting expenditure increases relative to the baseline – between 1.3 percentage points and 1.5 percentage points of output each (Table 5).
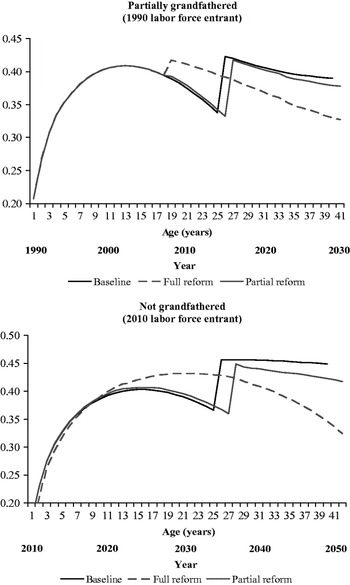
Increasing the retirement age results in a ‘bust-boom’ cycle in aggregate effective labor: effective labor declines before the 2020s, but increases thereafter, reflecting grandfathering clauses and intertemporal labor substitution effects (Figure 5). As households work longer (with an unchanged averaging period) they substitute labor intertemporally: working more at older ages, when their skills are lower, while exerting less effort during their middle work lives, when their skills are higher. At the outset of the reform, this intertemporal substitution results in small reductions in aggregate labor. As time goes by, however, more households enter the upper age ranges and exert high labor effort, which, together with a larger number of working cohorts, increases aggregate labor.
Household's labor effort (n s) profile by age underlying aggregate labor cycles (for selected generations in the baseline and pension reform scenarios)

Full pension reform
A full pension reform delivers more significant gains: it further limits the increase in pension expenditures between 2008 and 2050 to 8 percentage points of output, 8 percentage points less than in the baseline; the peak tax rate is further limited to 37%, or about 14 percentage points less than in the baseline. Thus, at the peak of the demographic shock, extending the averaging period – conditional on increasing the retirement age – is as important in reducing aging-related expenditure pressures as is increasing the retirement age.
Comparing the full and partial pension reform scenarios (Figure 3), extending the averaging period from 15 years to the entire work life:
• Reduces pension expenditures increases by 4 percentage points of output, and those in consumption tax rates by 7 percentage points between 2008 and 2050.
• Leads to consistently higher capital stock levels. Aggregate effective labor per capita is higher before 2020, but lower thereafter. Output per capita is higher before 2025, but lower afterwards, as the higher capital stock does not offset the lower labor input. By 2050, output per capita is 1% lower (15% lower compared to the baseline).
• Increases capital–labor ratios after 2013, implying higher wage rates and lower rates of return on capital. Before then, however, the higher effective labor – caused by the extension of the averaging period – reduces the capital–labor ratio.
• Boosts consumption per capita before 2023, but reduces it afterwards.
• Reduces the (detrended) average pension benefit by 11% between 2007 and 2050; grandfathering clauses prevent sharp reductions in pension benefits before the 2020s. Also, the reduced average pension accounts for the whole reduction in pension expenditure increases – the contributions of the population's age structure and output per capita are unchanged – relative to a partial reform (Table 5).
Intuitively, extending the averaging period causes an intertemporal labor substitution at the household level that is reflected at the aggregate level. Specifically, households intensify labor effort during the middle of their work lives, when skills are highest, and exert less effort when they are close to retirement. In contrast with the delayed aggregate labor gains in the partial reform, the intertemporal labor substitution effect in the full pension reform leads to immediate aggregate labor gains. But the costs of anticipating the aggregate labor gains show up later. As a larger share of the population approaches retirement, aggregate effective labor declines, precisely when labor is most scarce; that is, when the dependency ratio starts rising sharply. Note further that compared with the partial reform, a ‘boom-bust’ cycle in aggregate effective labor emerges.
The relative contributions of the pension reforms – increasing the retirement age and extending the averaging period – to limiting the consumption tax rate increase vary over time. At the peak of the demographic transition, extending the averaging period accounts for half of the tax rate reduction obtained from a full pension reform (relative to the baseline). In the final steady state, however, extending the averaging period accounts for just a tenth of the tax rate reduction. Intuitively, extending the averaging period lowers pension benefits more when (detrended) wage rates rise over time, as is the case in 2010–50. When (detrended) wage rates are constant, as is the case in the final steady state, the relative contribution of extending the averaging period is much smaller.
Effects of tax-smoothing policies
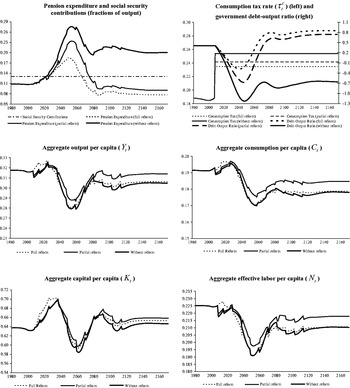
Pre-funding the fiscal costs associated with aging – with or without pension reforms – is simulated by a once-and-for-all increase in the consumption tax rate in 2008. This avoids the distortions and adverse macroeconomic effects associated with sharp adjustments in tax rates in the tax-as-you-go policy discussed so far. Also, tax smoothing reduces the tax burden on the households during the toughest years of the demographic transition at the cost of increasing the burden on older and future generations.
Not surprisingly, the once-and-for-all increase in the tax rate depends on the reform scenario. In the absence of pension reforms, the consumption tax rate must increase to 25.4% – 6.4 percentage points higher than in 2007 – to pre-finance the demographic shock (Figure 6). From that level, a partial pension reform reduces the tax rate by 1.2 percentage points, and a full pension reform reduces it further by 0.8 percentage points. Regardless of the pension reform scenario, the government debt-to-output ratio declines rapidly before the peak of the dependency ratio, and the government becomes a net creditor.Footnote 29
Macroeconomic results under tax-smoothing – with and without pension reforms (Unless otherwise indicated, variables are expressed as deviations from trend)

Compared with tax-as-you-go, the tax-smoothing simulations suggest that:
• Labor, output, and consumption per capita all increase during the worst period of the demographic transition (2025–55), but decline before 2025 and after 2055.
• Capital per capita and capital–labor ratios are higher before 2060, and lower thereafter.
• Pension expenditure-to-output ratios do no vary significantly.
Intuitively, tax smoothing reduces distortions on asset accumulation relative to the tax-as-you-go scenario, but also affects the intergenerational welfare distribution. Pension reforms combined with tax-smoothing policies would result in a Pareto improvement if the welfare loses of some generations could be avoided by some compensating mechanism.
Welfare analysis
To conclude the discussion of the simulation results, cross generational welfare is computed for the baseline and reform scenarios under both tax policies.
Tax-as-you-go
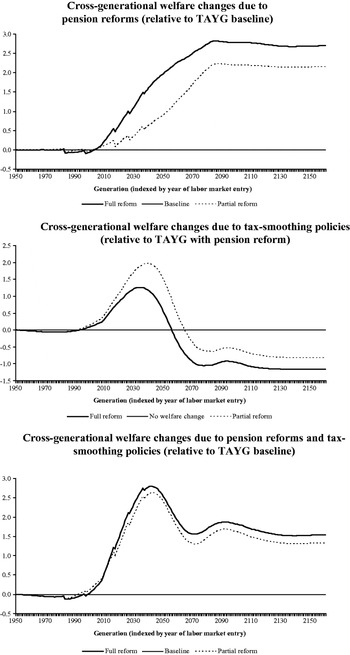
Under a tax-as-you-go policy both the partial and full pension reforms reduce the welfare of generations that entered the labor force between 1983 and 2002 (Figure 7, upper panel). The reduction in welfare associated with a lower pension benefit and shorter retirement period is not fully offset by lower taxes and the reoptimization of household's plans. (These generations must reassess their optimal plans resulting in labor, consumption and asset accumulation profiles that are not as smooth as if reforms had been anticipated.)
Welfare effects of pension reforms and fiscal policies during the demographic transition

All other generations benefit from pension reforms. Those entering the labor force before 1983 are fully grandfathered and benefit from lower consumption tax rates and higher returns on assets that are made possible by the reform. Those entering the labor force between 2002 and 2008 will see the welfare losaes associated with lower pension benefits and shorter retirement periods more than offset by lower taxes from which they benefit for a longer period than previous generations. And those entering the labor market after 2008, will be able to optimize from the outset of their work life and benefit from the reforms.
The full pension reform accentuates the welfare gains and losses compared to the partial reform scenario, leaving largely unchanged the distribution of winners and losers.
Tax smoothing
Conditional on full pension reform, tax-smoothing policies deliver welfare gains to generations that enter the labor force in 1992–2055 and welfare losses to generations that enter the labor force in 1951–1991 and after 2055 (Figure 7, middle panel).
The tax burden shifts from generations alive at the peak of the demographic shock to previous and future generations. The generations that entered the labor force before 1992 did not face any major tax rate increase under the tax-as-you-go policy, and, thus, are worse off when taxes are increased in 2008 with the tax-smoothing policy. Those generations entering the labor force between 1992 and 2064 would have faced large tax hikes in the tax-as-you-go policy – well beyond those in the tax-smoothing policy, and thus benefit from a lower and constant consumption tax rate. Finally, those generations entering the labor force after 2064 are worse off, as they face a higher tax rate than with a tax-as-you-go policy.
Compared to the tax-as-you-go baseline, a full pension reform with tax smoothing reduces the welfare of generations entering the labor force in 1951–1998, and improves the welfare of all other generations. Also, in a partial pension reform, fewer generations – those entering the labor force in 1951–1992 – lose welfare, but the welfare gains of other generations are smaller than in a full pension reform (Figure 7, lower panel).
Although this paper does not attempt to find mechanisms to achieve a Pareto improvement, those mechanisms may involve delaying the increase in the consumption tax rate or targeting transfers to net losers financed by public debt.
6 Conclusion
When considering parametric reforms of PAYG pension systems, academic and policy discussions alike have focused prominently on tightening the link between contributions and benefits. Among the policies proposed to strengthen this link is extending the averaging period used to compute pension benefits. This reform, however, has received scant attention in the quantitative DGE literature.
This paper seeks to fill this gap in the literature. Specifically, this study evaluates the macroeconomic and welfare effects of extending the averaging period in a PAYG system using a DGE model in the Auerbach–Kotlikoff tradition. The paper also examines the complementarities between reforms extending the averaging period and those increasing the retirement age under alternative tax policies. By incorporating a stylized version of the Spanish pension rule in the model, the analysis is applied to Spain where extending the averaging period has taken center stage in pension reform discussions.
In the absence of reforms, pension expenditures and consumption tax rates increase sharply, with severe macroeconomic consequences. Specifically, pension expenditures will increase by 16 percentage points of output by 2050, significantly higher than in EC (2006) . The latter estimates the increase to be 7 percentage points of output by assuming that output per capita will grow in line with past trends and pension benefits will rise broadly in line with output per capita. By relaxing this assumption, this paper finds that household's pension benefits increase sharply relative to output per capita during the peak of the demographic transition due to the general equilibrium effects. As the peak of the demographic shock nears and labor becomes scarce, wage pressures build boosting individual pension benefits and overall pension expenditure. To finance these increases, tax rates must rise, adversely affecting output.
Extending the averaging period can significantly limit the adverse macroeconomic consequences of aging. Specifically, it can reduce increases in aging-related spending at the peak of the demographic transition by 4 percentage points of output, and those in the consumption tax rate by 7 percentage points. This is because pension benefits decline – specially when (detrended) wage rates rise over time – as the extended averaging period includes wage earnings earlier in a household's labor life, which are lower (and more heavily discounted by productivity growth). Still, households' welfare increases as the resulting lower and flatter consumption tax rate path reduces distortions in the consumption-saving decisions and the extension in the averaging period removes labor market distortions.
Complementing reforms extending the averaging period with those increasing the retirement age (in line with life expectancy) can further mitigate the adverse macroeconomic consequences of aging. Doing so can reduce aging-related spending at the peak of the demographic transition by another 4 percentage points of output, and the consumption tax rate by additional 7 percentage points. Tax smoothing can also limit the adverse macroeconomic consequences of aging by further reducing consumption-saving distortions.
Some caveats regarding the quantitative results are in order, however. Although the aging process and the major demographic trends in Spain are inexorable, some components of the long-term demographic projections are inherently uncertain – for example, future immigration flows. Also, we assumed that health-related public expenditure per individual of each age group will grow over time at the rate of technological progress. In recent years, however, health-related expenditures per individual have grown faster than output per capita in Spain and other developed countries. We have used the best projections available at this time, but the quantitative results will change if official projections are significantly revised.
Although the results are Spain specific, these point to broader qualitative results in extending the averaging period. First, the extension limits the increase in individual pension benefits at the peak of the demographic transition more than in the long run. In other words, with a tax-as-you-go policy, the extension's contribution to limit tax rate increases varies over time. Second, in the long run, extending the averaging period to the entire work life may be suboptimal if technological progress is insufficient. With no technological progress, long-run welfare gains are largest when the averaging period is shorter than the entire work life. And, third, pension reforms generate aggregate labor cycles. Increasing the retirement age induces a ‘bust–boom’ cycle as households' substitute labor intertemporally: working more later in life when their skills are low, and exerting less effort during their middle work lives, when their skills are high. In contrast, extending the averaging period causes a ‘boom–bust’ cycle because households intensify labor effort during their middle work lives, when skills are highest, and exert less effort when they are close to retirement.
Appendix I. Calibration data sources
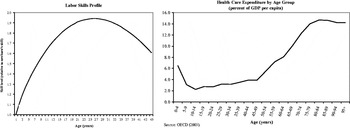
Household's labor skills by age (Figure A1): the labor skills profile by age is calibrated to match the relative wage rates (per hour) earned by households in different age groups, according to data from the Spanish National Statistics Institute (INE). The calibration of skills for households with more than 30 years in the workforce is based on Hansen (Reference Hansen1993) . Government health expenditure profile by age: Figure A1 shows the private and public health-related expenditure by age group as a share of GDP per capita in 1998. Using the GDP, the age structure of the population and the sum of public health-related consumption over all age groups (5.5% of GDP in 1998), and assuming that private and public health-related expenditures exhibit the same age profiles, we compute the expenditure per individual of a given age group. We assume that the public expenditure per individual of each age group grows over time at the rate of technological progress,Footnote 30 and track the total public health-related expenditure over time.
Figure A1

Appendix II. Comparative statics in the final steady state
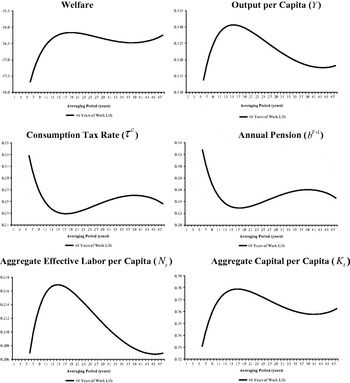
We evaluate the welfare and macroeconomic effects of extending the averaging period when the rate of labor-augmenting technological progress is zero (ξ=0). We find that welfare is maximized for an averaging period of 19 years.Footnote 31
Figure A2

 . This benefit, once determined, remains constant throughout retirement:
 for
 .
 and given
 The function is given by
 where Ω is a constant. Note that V(.) is also a function of future interest rates and income tax rates. A detailed derivation of this function can be found in Catalán et al. (
 , which are assumed to have the same work life and retirement periods. Thus, during the first T 0+T 0R years, the model considers a number of ‘truncated’ optimization problems associated with them.
 .
 Note that the stationary-transformed old-age pension for a household born at time t−T t and retiring at time t is given by
 . As
 for
 thus
 .
 grow at the annual rate p+ξ+p ⋅ ξ; the variables
 grow at the annual rate ξ;
 grows at the annual rate p; and the variables r t, (n t1, …, n tT) stay constant.