I. INTRODUCTION AND OVERVIEW
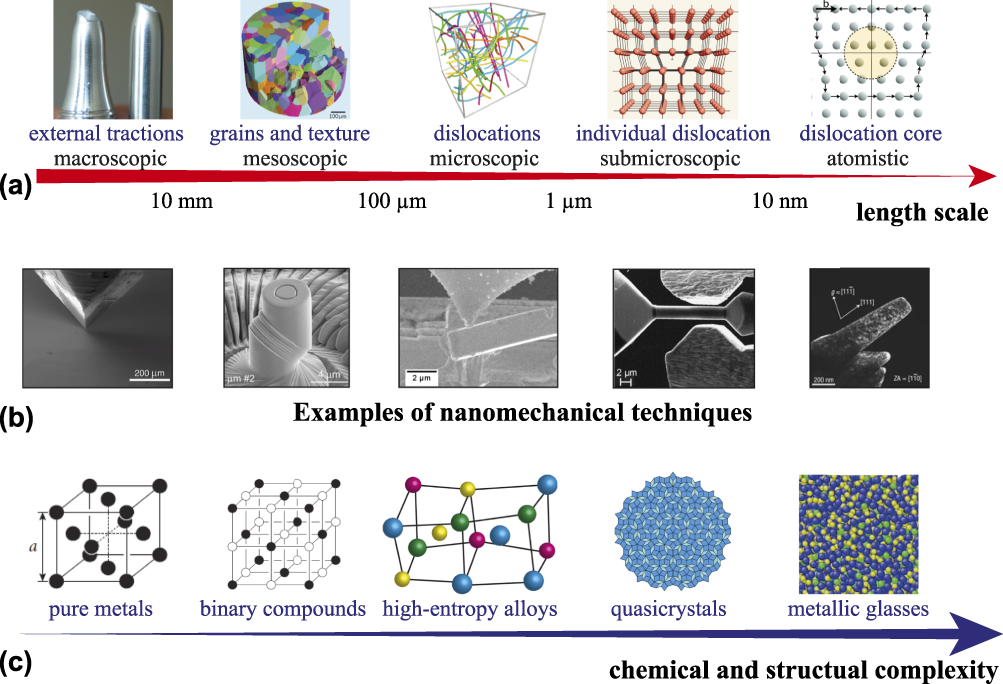
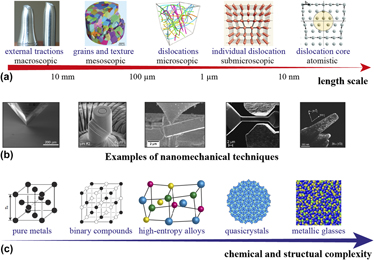
More than a century has passed since the initial scientific study on the mechanical behavior of materials.Reference Mügge1,Reference Ewing and Rosenhain2 Still today, research on mechanical properties plays an essential role in materials science, especially for metallic materials. As the most widely used structural materials in the world, alloys contain complex structures [e.g., phases, grains, grain boundaries (GBs), dislocations, vacancies, and interstitials] across many length scales, extending from the macroscopic scale to the atomistic size, as illustrated in Fig. 1(a).
(a) Length scales associated with structure defects and dislocation systems from the macroscopic scale to the nanometer scale (the concept is adapted from Zaiser and SeegerReference Zaiser, Seeger, Nabarro and Duesbery100 and the schematic illustrations are from Refs. Reference Walker, Carrez and Cordier101–105). (b) Examples of available nanomechanical techniques (from left to right): nanoindentation, microcompression, microcantilever bending, micro/nanotensile tests, and in situ TEM (representative images from Refs. Reference Dimiduk, Uchic and Parthasarathy11, Reference Wheeler and Michler9, Reference Iqbal, Ast, Göken and Durst106–Reference Minor, Shan, Mishra, Asif and Warren108 respectively). (c) Increasing chemical and structure complexity from single-element fcc metals to multicomponent metallic glasses, a couple of intermediate states such as ordered intermetallic compounds, HEAs, and quasicrystals. The periodicity and structural order of materials decrease from left to right (the schematic illustrations from Refs. Reference Hull and Bacon109–111). (Reproduced with permissions.)
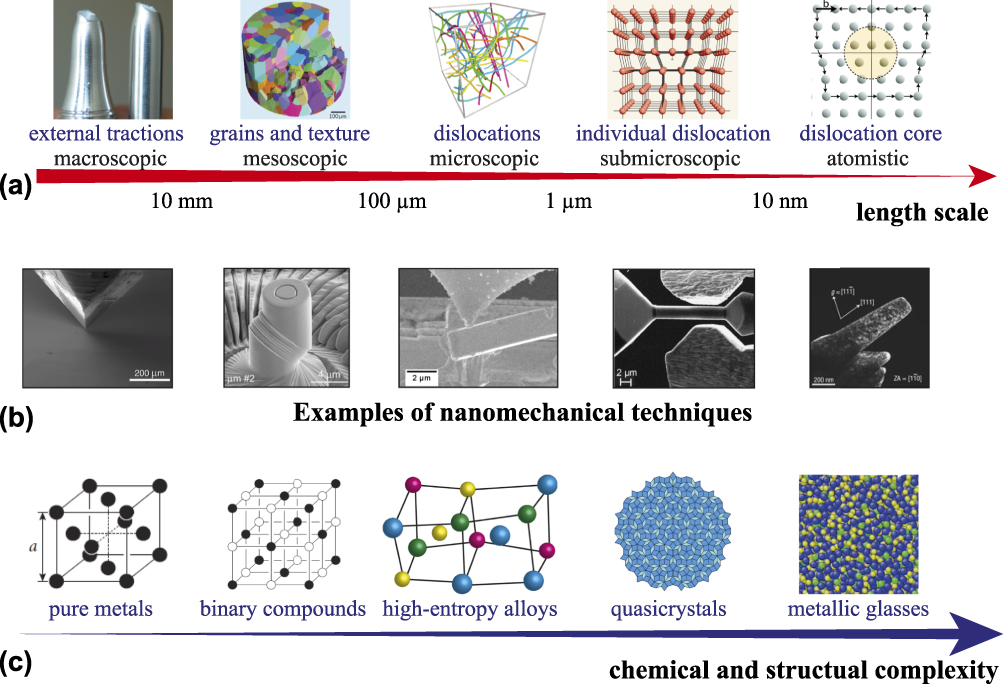
Over the past three decades, significant advances have been made in fundamentally understanding mechanical behavior of materials at the micrometer and nanometer scales, owing to the invention of instrumented nanoindentation.Reference Oliver and Pharr3,Reference Oliver and Pharr4 Particularly, in the past decade, the emerging techniques [e.g., focused ion beam (FIB), lithography, advanced atomic force microscopy, in situ electron microscopy, and new sensors and actuators of nanoindenters] have led to a large variety of nanomechanical testing methods, including micro/nanocompression, microtension, microbending, high-temperature/cryogenic nanoindentation, high-strain-rate indentation, and in situ electron microscopy [Fig. 1(b)], as reviewed in Refs. Reference Uchic, Shade and Dimiduk5–Reference Dehm, Jaya, Raghavan and Kirchlechner10 These techniques have generated a second wave of more sophisticated experiments and theories on small-scale plasticity: So far, over a thousand reports have been published on a large variety of materials, including regular metals,Reference Dimiduk, Uchic and Parthasarathy11 ordered intermetallics,Reference Uchic, Dimiduk, Florando and Nix12 ionic crystals,Reference Zou and Spolenak13 semiconductors,Reference Michler, Wasmer, Meier, Ostlund and Leifer14 ceramics,Reference Korte and Clegg15 quasicrystals,Reference Zou, Kuczera, Sologubenko, Sumigawa, Kitamura, Steurer and Spolenak16 and metallic glasses,Reference Volkert, Donohue and Spaepen17 as summarized in the reviews.Reference Uchic, Shade and Dimiduk5–Reference Greer and De Hosson7 These techniques not only explore materials properties in the new regimes (i.e., size, temperature, and strain-rate) but also provide a database for the design of materials for new functionalities.Reference Zhu and Li18–Reference Zou20
At almost the same time as the second wave of nanomechanics, the concept of high-entropy alloys (HEAs) was introduced by Yeh et al.Reference Yeh, Chen, Lin, Gan, Chin, Shun, Tsau and Chang21 and Cantor et al.Reference Cantor, Chang, Knight and Vincent22 in 2004, attracting significant attention in the materials community. HEAs are loosely defined as solid-solution alloys that made of five or more metallic elements with equimolar or near-equimolar ratios, wherein multiple principal elements tend to form single solid-solution-like phases. Typically, conventional alloys have one or two principal components, and their composition is restricted to the corners or edges of a phase diagram. In HEAs, it is difficult to distinguish which element is the principal one, i.e., solvent, and which one is solute, their compositions are at the centers of their phase diagrams. It is generally believed that in such HEAs, the high configurational entropy assists to stabilize solid-solution phases at high temperatures, preventing the formation of possible intermetallics, which is regarded as a thermodynamic mechanism.Reference Yeh, Chen, Lin, Gan, Chin, Shun, Tsau and Chang21,Reference Huang, Yeh, Shun and Chen23,Reference Yeh, Chen, Lin and Chen24 It is also believed that the stability of HEAs can be attributed to suppressed long-range diffusion, which is due to a kinetic mechanism.Reference Otto, Yang, Bei and George25,Reference Tsai, Tsai and Yeh26 As a broader definition, HEAs can contain multiple phases,Reference Yeh, Chen, Lin, Gan, Chin, Shun, Tsau and Chang21,Reference Cantor, Chang, Knight and Vincent22 and their constitutional elements are not necessarily equal atomic ratios (i.e., nonequiatomic but near the center of a phase diagramReference Yao, Pradeep, Tasan and Raabe27). Many interesting and useful properties have been found in macroscopic mechanical testing of HEAs, such as high strength levels at high temperatures,Reference Senkov, Wilks, Scott and Miracle28 excellent fracture toughness at low temperatures,Reference Gludovatz, Hohenwarter, Catoor, Chang, George and Ritchie29 and outstanding strength–ductility combination,Reference Li, Pradeep, Deng, Raabe and Tasan30 as critically reviewed.Reference Tsai and Yeh31–Reference Gao, Yeh, Liaw and Zhang35 The mechanical properties of HEAs at the micro- or nanoscale have also attracted attention since about five years ago.
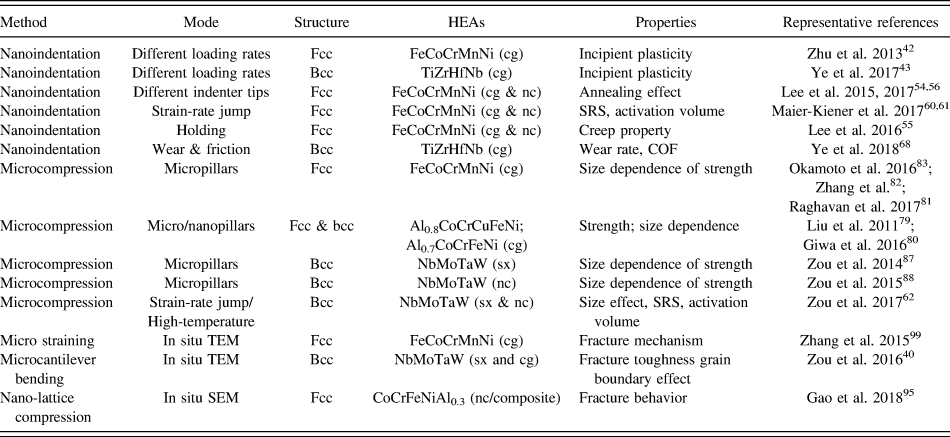
Regular metals and metallic glasses present two extreme classes of materials regarding chemical and structural complexity—the number of constituted elements, structure order, and periodicity [Fig. 1(c)]. HEAs could be regarded as one of the intermediate states between single-element regular metals and multi-element disordered metallic glasses. Despite simple average structures of HEAs—face-centered cubic (fcc),Reference Cantor, Chang, Knight and Vincent22 body-centered cubic (bcc),Reference Senkov and Woodward36 and hexagonal closest packed (hcp),Reference Feuerbacher, Heidelmann and Thomas37 they present many complexities at small length scales: local lattice distortion,Reference Song, Tian, Hu, Vitos, Wang, Shen and Chen38 nanoscale clusters,Reference Maiti and Steurer39 grain-boundary segregation,Reference Zou, Okle, Yu, Sumigawa, Kitamura, Maiti, Steurer and Spolenak40 and nanoscale phase separation.Reference Xu, Liu, Guo, Hirata, Fujita, Nieh, Liu and Chen41 The overall mechanical performance of the bulk HEAs considerably depends on these structures at the micrometer and even nanometer scales, where nanomechanical tools will be essentially useful. A large number of new HEAs were developed at the same time the invention of many advanced nanomechanical methods in the last decade, consequently, when nanomechanics “meets” HEAs, the number of literature on this topic has been dramatically increased over the past five years. To date, about 50 papers have been published, a few examples shown in Table I. To the author’s knowledge, so far, there has been no review article focusing nanomechanical studies of HEAs, and many fundamental aspects of mechanical behavior at small scales remain unresolved for HEAs—much in contrast to regular alloys and metallic glasses. Hence, it is time to review recent findings and highlight the state of the art on this topic.
A brief summary of studies of HEAs using different nanomechanical methods: nanoindentation, microcompression, and fracture testing (cg: coarse-grained, nc: nanocrystalline, and sx: single-crystal).

In this article, we will focus our attention on a few well-known HEAs, fcc FeCoCrMnNi (also known as the Cantor alloy) and bcc refractory NbMoTaW. This entire review is organized by techniques—nanoindentation (Sec. II), microcompression (Sec. III), and fracture testing (Sec. IV). Many properties of HEAs will be discussed: incipient plasticity, grain-boundary strengthening, strain-rate sensitivity (SRS), creep behavior, wear/friction properties, size dependence of plasticity, the temperature dependence of strength, and fracture toughness. In the end (Sec. V), this article will summarize the findings in HEAs based on nanomechanical methods, raise unanswered questions, and point out new opportunities in this field.
II. NANOINDENTATION OF HEAS
A. Incipient plasticity and dislocation nucleation in HEAs
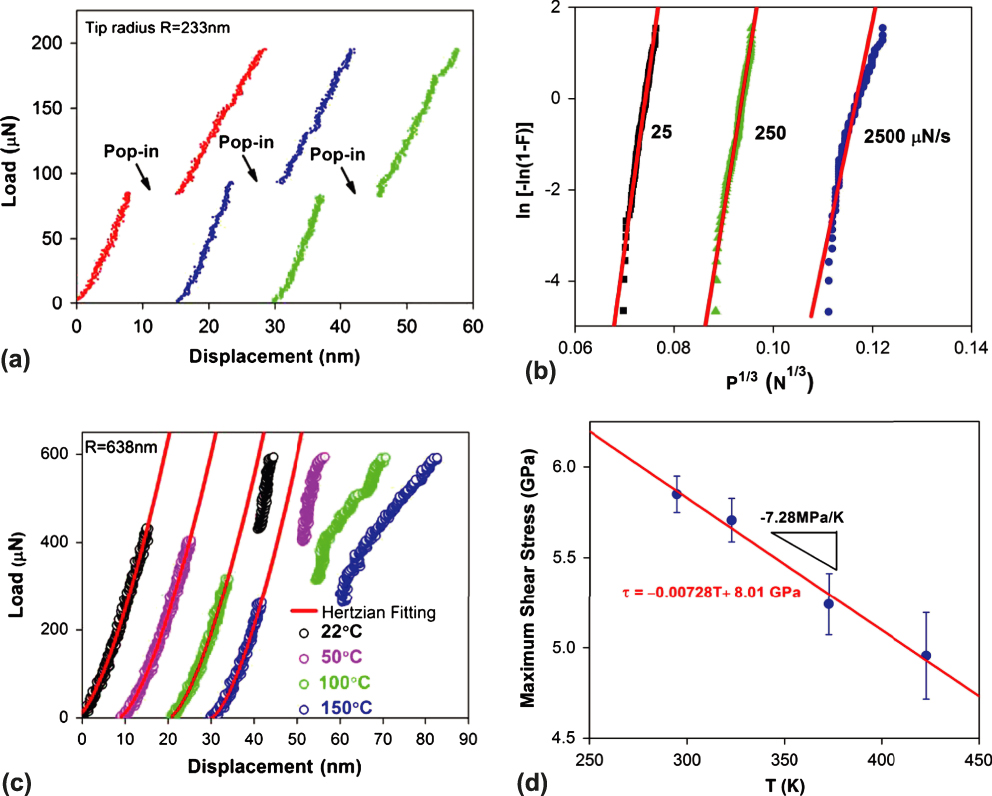
Nanoindentation was initially used to study incipient plasticity in HEAs for understanding their dislocation nucleation mechanism.Reference Zhu, Lu and Nieh42–Reference Lin, Chang, Chang and Huang47 Similar experiments have been intensively applied for analyzing the onset of plasticity in regular metals and metallic glasses, as reviewed in Refs. Reference Bahr, Kramer and Gerberich48 and Reference Suresh, Nieh and Choi49. During the indentation process, a diamond tip, which is typically a Berkovich tip with an effective tip radius of ∼100–500 nm (inevitably blunt), contacts a sample from its surface, generating a load (P)–displacement (h) curve. Incipient plasticity occurs at the very earliest stages of mechanical deformation when the transition from elasticity to plasticity happens in a tiny volume of deformation. In an indentation experiment, such incipient plasticity is often revealed by a discontinuity in the P–h curve, often called a “pop-in” event. Thus, the onset of plastic deformation, or yield point, during nanoindentation can be identified. In a typical load-controlled experiment, it shows a plateau of load—without a steady increase of load, as shown in Fig. 2(a). Such “pop-in” phenomena are believed to be associated with the dislocation nucleation underneath the sample surface or initial shear banding in metallic glasses. The activation energy and activation volume for the dislocation nucleation can be calculatedReference Schuh, Mason and Lund50,Reference Schuh51 and used to interpret the underlying mechanisms during the process.
(a) Typical load–displacement (P–h) curves from three different FeCoCrMnNi HEA grains tested at room temperature, showing pop-in phenomena when dislocation nucleation occurs. (b) Extracting the activation volume from room-temperature experimental data at different loading rates, where F is the cumulative probability and P is a pop-in load. (c) Typical P–h curves at temperatures of 22, 50, 100, and 150 °C, showing a decreased pop-in load with an increasing temperature. (d) Variation of maximum shear stress as a function of temperature, suggesting a thermally activated dislocation nucleation process.Reference Zhu, Lu and Nieh42 The activation energy and volume for the onset of plasticity can be calculated according to Eqs. (1) and (2). (Reproduced with permission from Ref. Reference Zhu, Lu and Nieh42.)
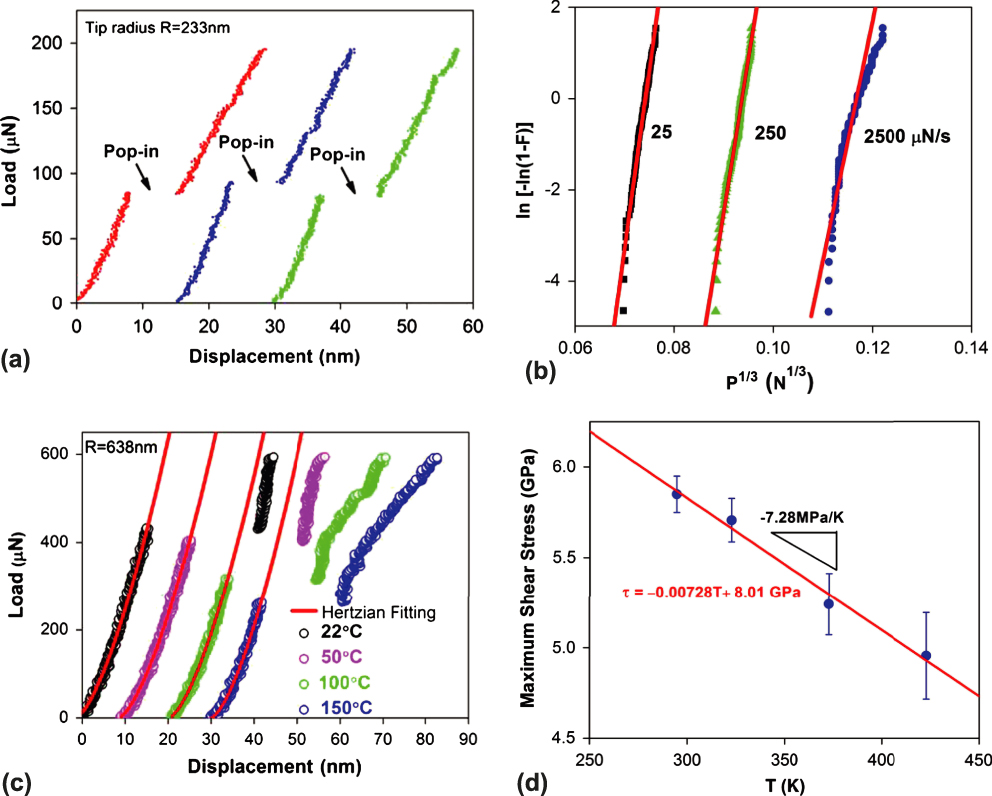
Using this methodology, Zhu et al.Reference Zhu, Lu and Nieh42 studied the onset of plasticity in the single-phase fcc FeCoCrMnNi HEA. Figure 2(a) shows typical load–displacement curves with “pop-ins” during the indentation. This observed pop-in phenomenon is not associated with oxide cracking at the surface but the intrinsic behavior of the HEA. The maximum shear stress of the HEA at the pop-in was calculated to be 5.2–6.8 GPa, within 1/15–1/10 of the shear modulus. More in-depth information related to the intrinsic behavior was revealed by changing loading rates and deformation temperatures. Figure 2(b) shows a series of indentations using different loading rates (25–2500 µN/S) at room temperature, presenting load-rate dependence of pop-in stress. Using an analytical method proposed by Mason et al.,Reference Mason, Lund and Schuh52 the cumulative probability, F(P), is correlated with the indentation pop-in load, P, as
 $$\ln \left[ { - \ln \left( {1 - F} \right)} \right] = \alpha {P^{{1 / 3}}} + \beta \quad ,$$
where α and β are fitting parameters. The activation volume V can be calculated, as follows:
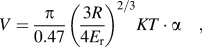 $$V = {\pi \over {0.47}}{\left( {{{3R} \over {4{E_{\rm{r}}}}}} \right)^{{2 / 3}}}KT \cdot \alpha \quad ,$$
where R is the tip radius of the indenter, E r is the reduced modulus of the indenter–sample combination, K is the Boltzmann constant, and T is the temperature. Thus, the activation volume V can be calculated, accordingly. Moreover, as temperature increases, the pop-in load decreases and the average load at pop-in drops nearly one-third from 22 to 150 °C, indicating that the pop-in event is a thermally activated process [Figs. 2(c) and 2(d)]. Such rate- and temperature dependence of pop-in loads in the HEA is comparable to those in pure fcc metals.Reference Schuh, Mason and Lund50,Reference Schuh51 As reported, typical activation volumes for pop-in in fcc metals are ∼1 Ω (where Ω is the atomic volume, see Table II). Interestingly, the activation energy and volume for the onset of plasticity are 1.72 ± 0.35 eV and 34 ± 7 Å3 (∼3 Ω), respectively. To interpret the higher activation energy and volume in the HEAs than that of fcc metals, Zhu et al.Reference Zhu, Lu and Nieh42 suggested that a vacancy or vacancy-like mediated heterogeneous dislocation nucleation was associated with the onset of plasticity in the HEAs, which is different from the conventional one-to-one atom–vacancy exchange in typical fcc metals.
Activation volumes for the pop-ins in fcc and bcc materials (after Ye et al.Reference Ye, Lu and Nieh43).

Using the similar method, the same research group also studied the incipient plasticity of a bcc TiZrHfNb HEA.Reference Ye, Lu and Nieh43 They found that the activation volume for the pop-ins in this bcc HEA is ∼3–5 atomic volumes (Table II). The higher activation volume in the bcc-HEA than that in fcc-HEAs suggests that the former one deforms with full dislocation nucleation while the latter one starts with partial dislocation nucleation. Although a few other groups also investigated the incipient plasticity and measured mechanical properties of HEAs using a nanoindenter,Reference Jiao, Ma, Yuan, Wang, Yang and Qiao44–Reference Lin, Chang, Chang and Huang47 no theoretical model and atomistic simulation, unfortunately, has been provided to support their hypotheses. So far, the dislocation nucleation in HEAs at the atomic level is still not well known.
B. Single crystalline (sx) HEAs versus nanocrystalline (nc) HEAs
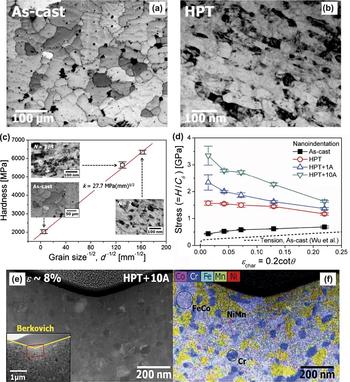
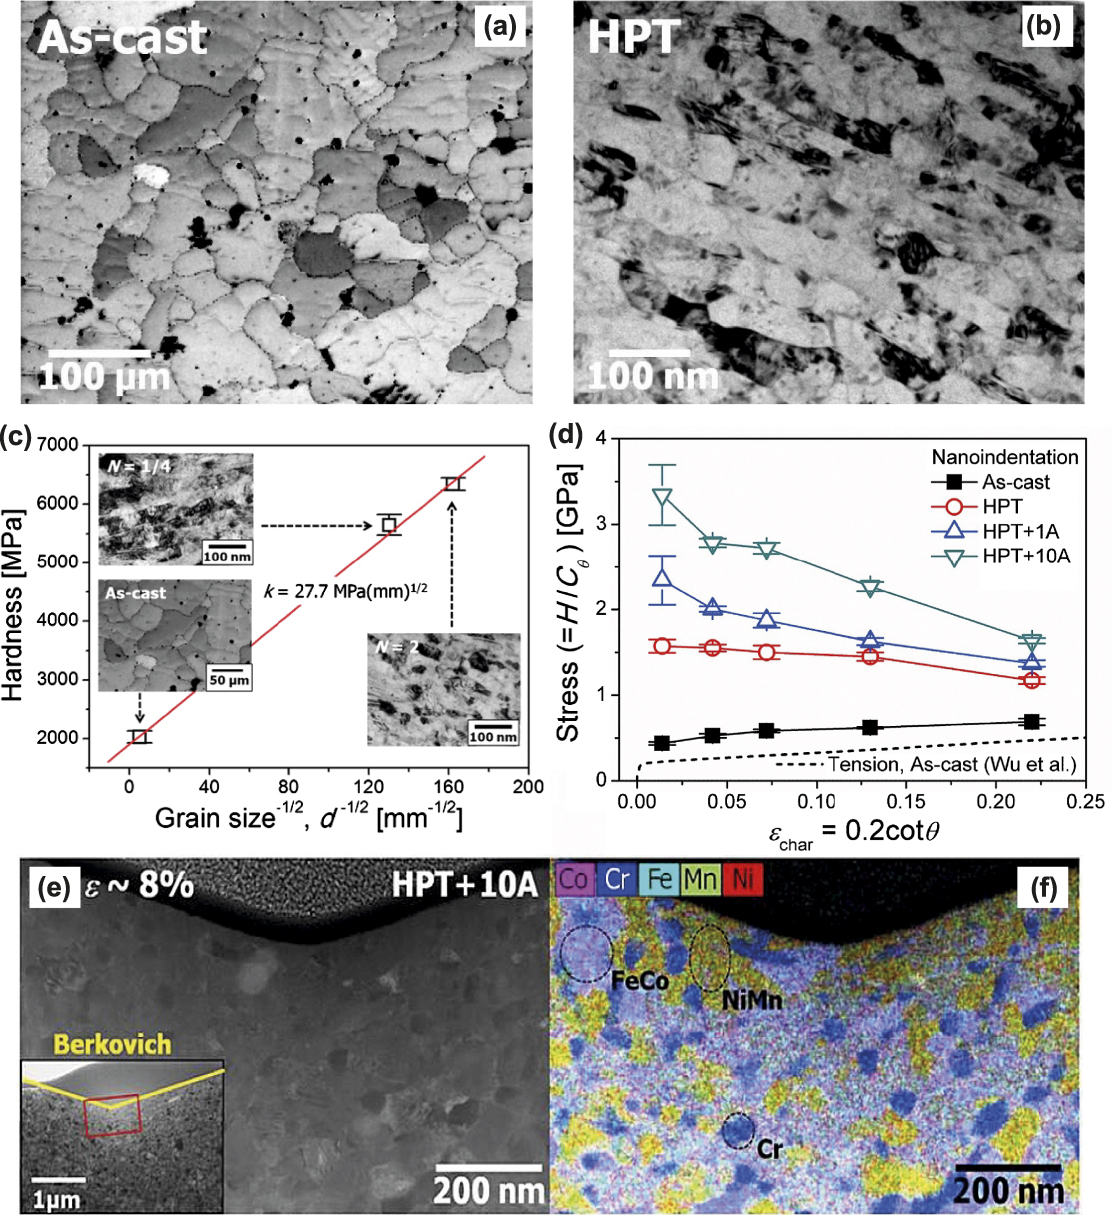
Nanomechanical techniques can be used to quantitatively compare mechanical properties between sx-HEAs and nc-HEAs. HEAs with ultrafine grains or nanoscale grains have been prepared using many different methods, for example, mechanical alloying, high-pressure torsion (HPT), and magnetron sputtering.Reference Koch53 Using nanoindentation, Lee and his co-workers studied an as-cast coarse-grained FeCoCrMnNi HEA and a nanocrystalline one made by HPT.Reference Lee, Choi, Seok, He, Lu, Suh, Kawasaki, Langdon and Jang54–Reference Lee, Lee, Zhao, Lu, Suh, Kim, Ramamurty, Kawasaki, Langdon and Jang56 After two turns of HPT, the grain size of the as-cast HEA (∼40 µm) was refined to ∼40 nm [Figs. 3(a) and 3(b)]. The hardness is increased with decreasing grain size, fitting the Hall–Petch relationship well [Fig. 3(c)].Reference Lee, Choi, Seok, He, Lu, Suh, Kawasaki, Langdon and Jang54 Using various nanoindenter tips, Lee et al.Reference Lee, Lee, Zhao, Lu, Suh, Kim, Ramamurty, Kawasaki, Langdon and Jang56 also systematically studied the annealing effect on the strength of the nc-HEAs after annealing at 450 °C for 1 h and 10 h [Samples: HPT + 1A and HPT + 10A, Fig. 3(d)]. Interestingly, they found that the nanohardness of nc-HEAs was increased after heat treatment, showing an “annealing-induced hardening” phenomenon [Fig. 3(d)]. Figure 3(d) also shows considerable “strain softening” effect in nc-HEAs—flow stress decreases with flow strain, but this trend was not observed in coarse-grained (cg) HEAs. As evidenced by transmission electron microscopy (TEM) analysis, the “annealing-induced hardening” effect is attributed to the formation of nanoscale intermetallic phases, such as NiMn-, FeCo-, and Cr-rich phases [Figs. 3(e) and 3(f)]. These authors also showed that the hardness of annealed HEAs decreases with increasing indentation depth. Such pronounced “strain softening” could be because indentation deformation may assist dissolution of the precipitates. However, no detailed theoretical model and further evidence were provided to support this assumption.
Typical microstructure of (a) the as-cast (average grain size ∼40 µm) and (b) HPT-processed (average grain size ∼40 nm) FeCoCrMnNi HEA. (c) Hardness as a function of the grain size in the HEA, following the Hall–Petch relation. (d) Estimated stress–strain relations calculated from nanoindentation data, showing a strong indentation-size effect in annealed HEAs and annealing-induced hardening (1A: annealing at 450 °C for 1 h; 10A annealing at 450 °C for 10 h). (e) Typical TEM image and (f) the corresponding EDS map for the subsurface region underneath the nanoindenter (Berkovich tip for the sample HPT + 10A), indicating phase separation and formation of new intermetallics.Reference Lee, Choi, Seok, He, Lu, Suh, Kawasaki, Langdon and Jang54,Reference Lee, Lee, Zhao, Lu, Suh, Kim, Ramamurty, Kawasaki, Langdon and Jang56 (Reproduced with permission from Refs. Reference Lee, Choi, Seok, He, Lu, Suh, Kawasaki, Langdon and Jang54 and Reference Lee, Lee, Zhao, Lu, Suh, Kim, Ramamurty, Kawasaki, Langdon and Jang56.)
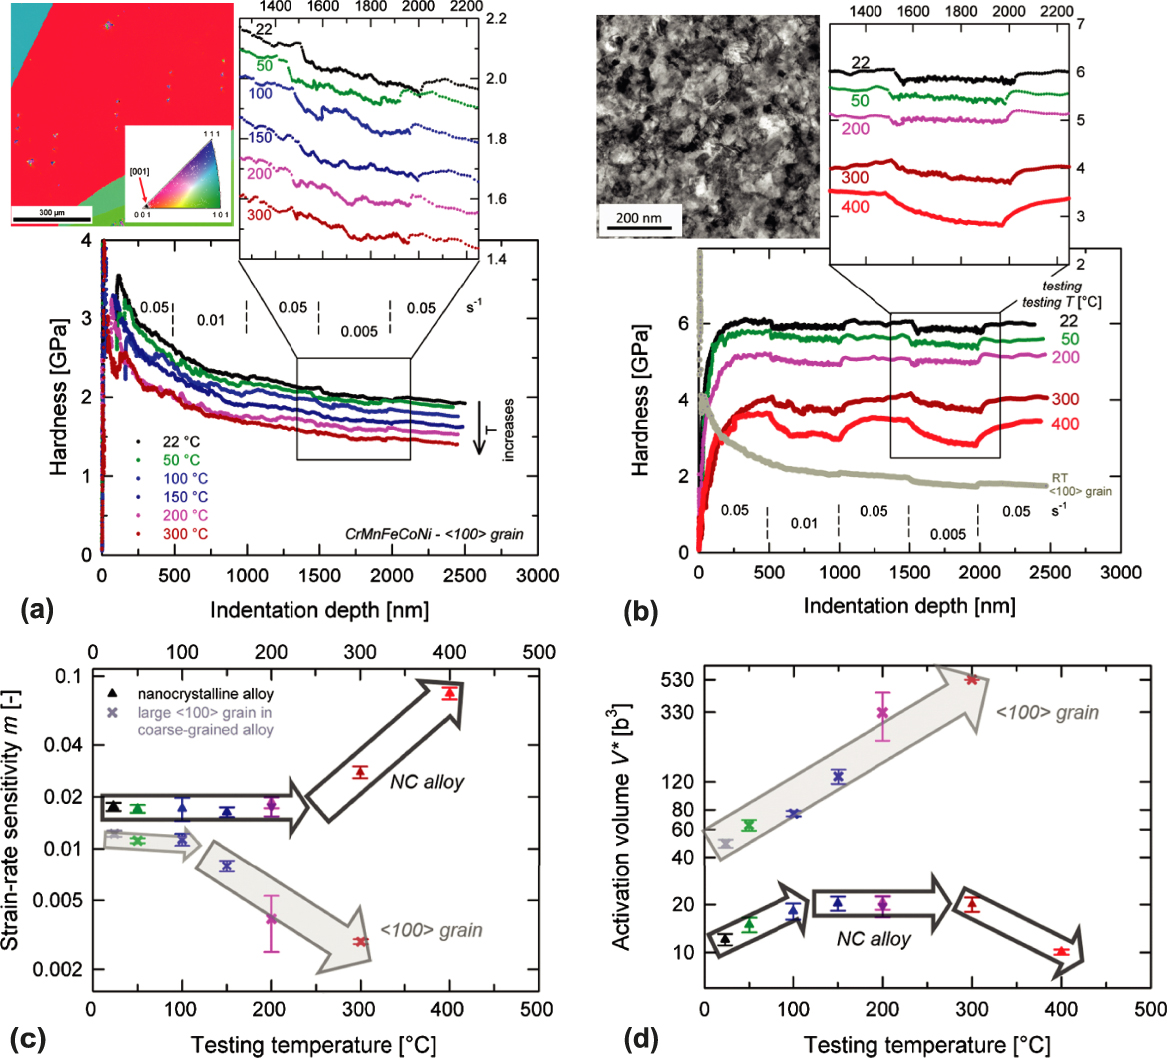
In addition to regular force–displacement measurement, nanoindentation strain-rate jump testing is a powerful approach to investigate thermally activated deformation behavior, particularly over a broad temperature range.Reference Maier, Durst, Mueller, Backes, Höppel and Göken57 By measuring SRS and activation volume (V), the deformation mechanism can be fundamentally understood. In nanoindentation, the strain rates vary from 1 × 10⁻⁴/s to 1 × 10⁻¹/s, and the temperature is from room temperature to ∼600 °C. SRS can be measured by the relation of flow stress, σ, as a function of strain rate,  $\dot{\varepsilon }$, by
 $${\rm{SRS}} = {{\partial \ln \sigma } \over {\partial \ln \dot{\varepsilon }}}\quad .$$
The SRS is related to the apparent activation volume (V), as
 $$V = \sqrt 3 {{{K_{\rm{B}}}T} \over {{\rm{SRS}} \cdot \sigma }}\quad .$$
In the experiment, the measurement of V is essential because V is related to the area swept by the dislocation during the thermally activated event. In general, it is believed that a tiny V (∼0.1–1b 3) corresponds to a diffusion-controlled deformation, where b is the Burgers vector; a small one (∼10–100b 3) can be related to the Peierls mechanism; a large one (100–1000b 3) can be associated with dislocation solute interactions, and a very large one (∼1000b 3) is the forest mechanism.Reference Caillard and Martin58,Reference Messerschmidt59
Quantitative details on the nature of plasticity of sx-HEAs and nc-HEAs have recently been studied through the use of the strain-rate jump test in a high-temperature nanoindenter. Maier-Kiener et al.Reference Maier-Kiener, Schuh, George, Clemens and Hohenwarter60,Reference Maier-Kiener, Schuh, George, Clemens and Hohenwarter61 revealed the thermal–mechanical behavior of the fcc FeCoCrMnNi HEA from room temperature to 400 °C. Two microstructure states were compared: one is a 〈100〉-oriented grain from a coarse-grained specimen and the other is nanocrystalline one (grain size ∼50 nm) made by HPT. They found a few interesting phenomena. First, both the sx-HEA and nc-HEA exhibit zig-zag scattered plastic flows, which could be associated with dynamic strain aging or dislocation interaction with obstacles [Figs. 4(a) and 4(b)]. Second, the SRS in the sx-HEA decreases significantly above 150 °C, from 0.018 to 0.002; the V of the sx-HEA increases linearly from ∼40b 3 at room temperature to 530b 3 at 300 °C [Figs. 4(c) and 4(d)]. Compared with the room-temperature V of typical fcc metals (∼1000b 3), the V value of sx-HEA is relatively low, suggesting that the sx-HEA is deformed in a thermally activated process at room temperature, so the critical temperature for the temperature-independent flow in the fcc HEAs is well above room temperature. Third, the SRS in the nc-HEA stays nearly consistent from room temperature to about 200 °C and increases almost linearly above 200 °C, suggesting the change of deformation mechanism. As shown in Fig. 4(d), the V of the nc-HEA shows three temperature-dependent regimes: increasing at 25–100 °C (similar trend as the sx-HEA), remaining constant at ∼100–300 °C, and decreasing above 300 °C. This phenomenon suggests that there is a competition between dislocation mechanism (bulk behavior) and diffusion or grain-boundary sliding mechanism (nanocrystalline behavior). The latter one becomes a controlling mechanism for the plastic deformation above ∼300 °C. The researchersReference Maier-Kiener, Schuh, George, Clemens and Hohenwarter60 also suggested the formation of precipitates during the high-temperature indentation process, but this is to be confirmed by additional investigation.
Nanoindentation strain-rate jump tests on a 〈100〉 orientation grain in (a) the coarse-grained and (b) the nanocrystalline (nc) FeCoCrMnNi HEA. Representative curves are showing hardness versus indentation depth for different temperatures. The inset shows an enlarged segment of the slowest strain-rate region for all temperatures. (c) SRS and (d) activation volume (V) as functions of testing temperature up to 400 °C, indicating different mechanisms of thermally activated deformation in the coarse-grained and nanocrystalline HEAs.Reference Maier-Kiener, Schuh, George, Clemens and Hohenwarter60 (Reproduced with permission from Ref. Reference Maier-Kiener, Schuh, George, Clemens and Hohenwarter60.)

The strain-rate jump results of such fcc HEA are different from a bcc NbMoTaW HEA,Reference Zou, Wheeler, Ma, Okle and Spolenak62 as discussed in the next session. It is mainly because in the bcc HEAs, one thermally activated double kink mechanism is believed to be primarily responsible for dislocation motion. Although this work does not show that this fcc HEA is very different from other fcc metals or alloys, the strain-rate jump test provides a unique method to probe the thermal–mechanical behavior of a large variety of HEAs. A systematical indentation study on different HEAs over large temperature and strain-rate ranges would be interesting to reveal the fundamental difference between HEAs and other alloys.
C. Creep behavior of HEAs
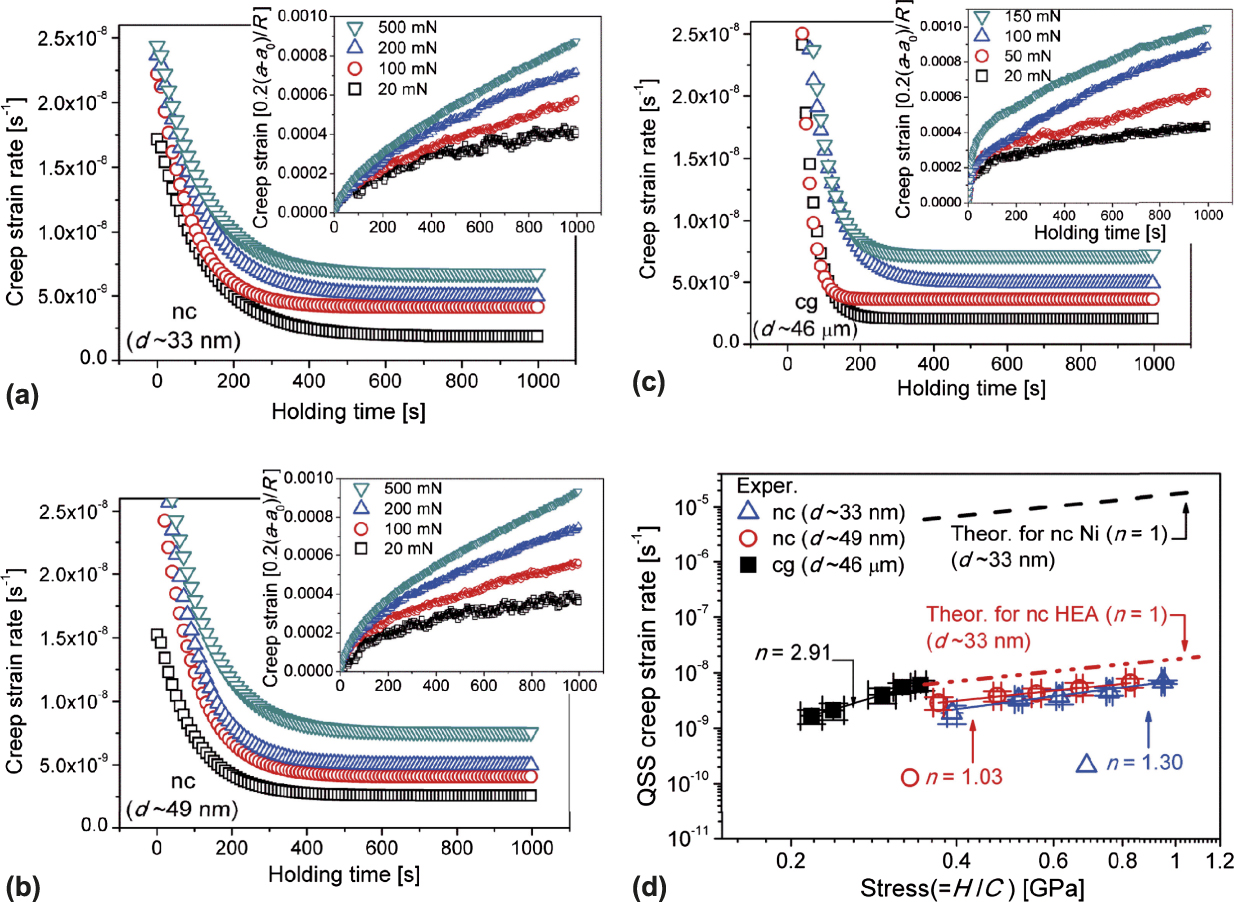
Using an instrumented nanoindenter, a few groups focused on studying creep behavior of HEAs.Reference Lee, Seok, Zhao, Choi, He, Lu, Suh, Ramamurty, Kawasaki, Langdon and Jang55,Reference Wang, Guo, Wang, Liu, Wang, Yang and Liu63–Reference Zhang, Yu, Cheng, Zhang, Diao, Shi, Chen, Chen, Feng, Bai, Jing, Ma, Liaw, Li and Liu65 Lee et al.Reference Lee, Seok, Zhao, Choi, He, Lu, Suh, Ramamurty, Kawasaki, Langdon and Jang55 compared creep properties of coarse-grained (cg) and nanocrystalline (nc) FeCoCrMnNi HEAs using different indenter tips. The authors indicated that the spherical nanoindentation creep tests produced more reliable creep data than the sharp indentation tests. Figures 5(a)–5(c) plot the creep strain rates as functions of holding time. Both creep displacement and strain rates of HEAs were increased with applied loads at the onset of creep. The creep stress exponent, n, was estimated as ∼3 for cg HEA and ∼1 for nc HEA, indicating that the nc-HEA creeps faster than the cg-HEA, which could be associated with grain-boundary diffusion in the nc-HEAs. More interestingly, the creep strain rates of the fcc nc-HEA are significantly lower than that of fcc nc Ni (within a factor of ∼4). As suggested by the authors, the nc HEA exhibits much higher creep resistance than conventional fcc nc metals because of the sluggish diffusion in HEAs.
Strain-rate as functions of holding time for (a) ∼33 nm grain, (b) ∼49 nm grain, and (c) coarse-grain FeCoCrMnNi HEA. The insets show creep strain versus holding time. (d) Relationship between quasi-steady-state creep strain rates as functions of stress (slopes correspond to the creep-stress exponent n), indicating that the nanocrystalline (nc) HEAs exhibit significantly lower creep rates than that of nanocrystalline Ni.Reference Lee, Seok, Zhao, Choi, He, Lu, Suh, Ramamurty, Kawasaki, Langdon and Jang55 (Reproduced with permission from Ref. Reference Lee, Seok, Zhao, Choi, He, Lu, Suh, Ramamurty, Kawasaki, Langdon and Jang55.)
A few other groups also investigated the creep behavior in various HEAs. Ma et al.Reference Ma, Feng, Debela, Peng and Zhang64 compared the creep behavior of fcc and bcc nc-HEA thin films. They indicated that creep strains of the fcc CoCrFeNiCu HEA film were increased by increasing a holding load or loading rate, while a bcc CoCrFeNiCuAl2.5 HEA thin film exhibited a consistent creep flow. Zhang et al.Reference Zhang, Yu, Cheng, Zhang, Diao, Shi, Chen, Chen, Feng, Bai, Jing, Ma, Liaw, Li and Liu65 also found that the creep mechanism is dependent on indentation loads: at high indentation loads (>500 µN). The dominant creep mechanism could be dislocation slip, while at low loads (<500 µN), self-diffusion along the indenter/specimen interface and the free surface of the specimen may play an important role. Wang et al.Reference Wang, Guo, Wang, Liu, Wang, Yang and Liu63 evaluated the initial creep behavior in CoFeNi multiple-component alloy systems. They revealed a crossover behavior, showing the change of the slopes in the double logarithmic plot of initial displacement as a function of time at the initial creep stage. They suggested that the different deformation mechanisms are associated with such a crossover: Before the crossover point, separated dislocation entanglement leads to work hardening; after the dislocation cell formation, the work hardening effect is saturated, and the residual dislocations migrate into the domain boundary of the dislocation cell, showing a viscous behavior.
As suggested by many studies, HEAs may exhibit distinct diffusion behavior compared to conventional alloys. Unfortunately, sluggish diffusion as one of the four primary HEA hypotheses has not been sufficiently proved,Reference Zhang, Zuo, Tang, Gao, Dahmen, Liaw and Lu33 it was only demonstrated in one study.Reference Tsai, Tsai and Yeh26 A better understanding of diffusion in both cg- and nc-HEAs is essential to understand the creep behavior in HEAs and the design of creep-resistant HEAs.
D. Friction and wear of HEAs
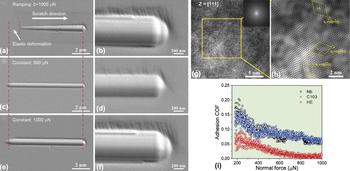
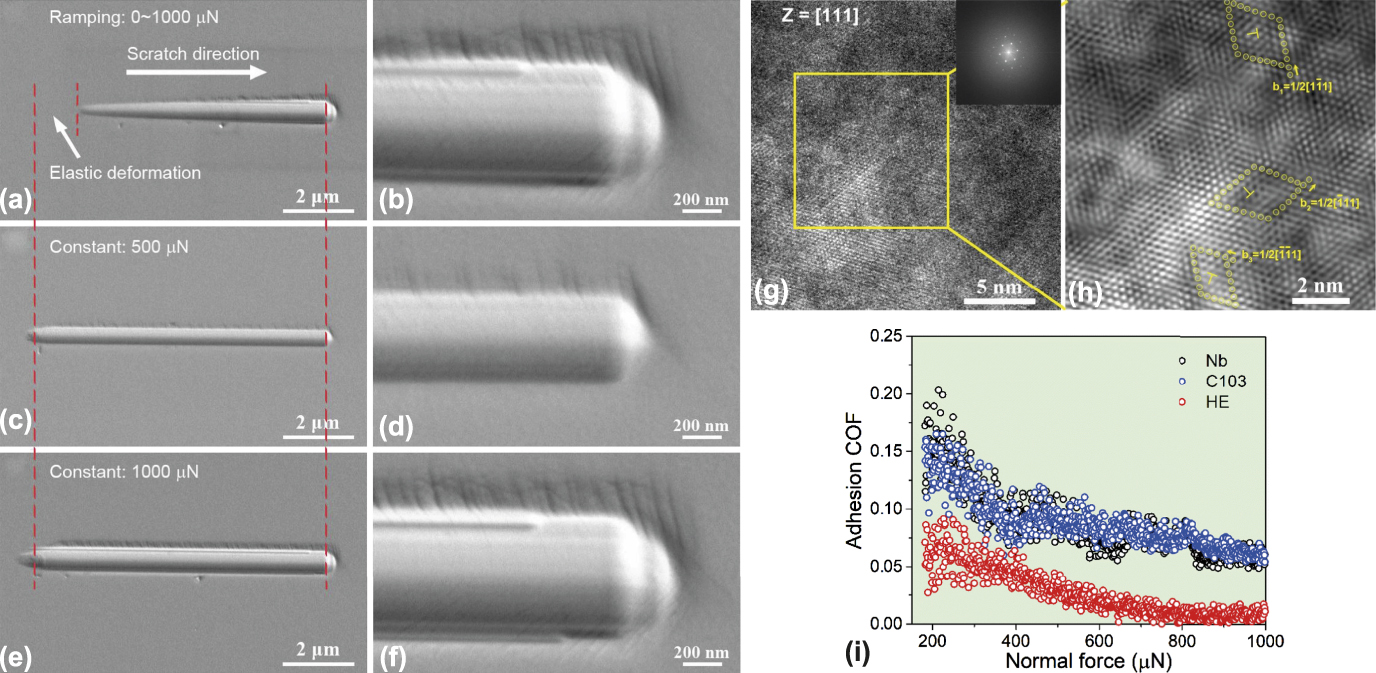
Wear-resistant properties of HEAs have also attracted considerable attention in the HEA community.Reference Chuang, Tsai, Wang, Lin and Yeh66,Reference Poletti, Fiore, Gili, Mangherini and Battezzati67 Most previous studies were based on macroscopic wear/friction experiments, such as pin-on-disc and ball-on-disc. Studies of tribology and related mechanisms of HEAs at micro/nanoscale have rarely been reported. Using a nanoscratch method in an instrumented nanoindenter, Ye et al.Reference Ye, Liu, Wang and Nieh68 studied wear and friction behavior of a bcc TiZrHfNb HEA under both ramping and constant load modes [Figs. 6(a)–6(f)]. The wear behavior of the HEA is comparable to conventional alloys, following the Archard’s equation for dry wear and with wear rates proportional to the applied load. The friction behavior of the HEA is much more complicated: In the elastic regime, the coefficient of friction (COF) decreased rapidly with increasing the normal load, while in the plastic regime, as indicated by dislocations in underneath the deformation zone [Figs. 6(g) and 6(h)], the COF became constant, indicating different friction mechanisms. However, what induced such transition is not very clear. Overall, such an HEA exhibits improved wear resistance and a lower COF as compared to its traditional alloy counterparts (pure Nb and Nb-based C103 alloys) [Fig. 6(i)], implying that the HEA may have the potential for tribological applications. Unfortunately, so far, only very few studies have been reported on friction and wear of HEAs at small scales. Many questions are still unanswered: what is the fundamental difference of wear/friction between HEAs and conventional alloys? What is the wear and friction behavior over a large temperature and load ranges? What is the wear-corrosion behavior in HEAs?
Typical SEM images of the TiZrHfNb HEA under (a and b) ramping mode from 0 to 1000 µN, (c and d) constant load at 500 µN, and (e and f) constant load at 1000 µN. (g and h) The high-resolution TEM image along zone axis of [111] shows severely distorted lattice and high density of dislocations with Burgers vectors. (i) Adhesion COF as a function of the normal force for Nb and Nb-based C103 alloy and the HEA in the plasticity-dominated regime, indicating that the HEA has the lowest COF and best wear resistance among them.Reference Ye, Liu, Wang and Nieh68 (Reproduced with permission from Ref. Reference Ye, Liu, Wang and Nieh68.)
III. MICROCOMPRESSION AND SIZE EFFECTS IN HEAS
In the last decade, there has been a significant advance in applying FIB technique and microcompression methodology to study mechanical properties of micro/nanopillars with the dimension from several microns down to ∼100 nanometers. In 2004, Uchic and his co-workers first reported the plastic behavior of micrometer-scale cylinder metal pillars under uniaxial compression.Reference Uchic, Dimiduk, Florando and Nix12 The micropillars were produced using the FIB milling technique, and the compression was used in a nanoindentation system with a flat-punch tip. At the submicrometer scales, the yield strength of materials can attain a significant fraction of their theoretical strength. It has been widely found that the yield or flow strength (σ) of the pillar can be strongly increased when its dimension (D) is decreased, exhibiting a “smaller-is-stronger” phenomenon (see reviewsReference Uchic, Shade and Dimiduk5–Reference Greer and De Hosson7). This relation has commonly been expressed by a relationship of σ ∝ D m,Reference Dimiduk, Uchic and Parthasarathy11,Reference Dou and Derby69 where m is called size-effect exponent. Fcc metals (e.g., Ni, Au, Al, and Cu) exhibit a pronounced and constant size dependence of plasticity with m in the range between −0.6 and −0.8.Reference Uchic, Dimiduk, Florando and Nix12,Reference Greer, Oliver and Nix70,Reference Ng and Ngan71 Bcc metals (e.g., Nb, Mo, V, Ta, and W) show a much more complicated size-related behavior with various m values ranging from −0.2 to −0.9, reported by Schneider et al.Reference Schneider, Kaufmann, Clark, Frick, Gruber, Monig, Kraft and Arzt72,Reference Schneider, Frick, Clark, Gruber and Arzt73 and Kim et al.Reference Kim and Greer74,Reference Kim, Jang and Greer75 So far, two prominent mechanisms have been proposed to explain these size-related phenomena: single-arm source or source-dominated model developed by Rao et al.Reference Rao, Dimiduk, Tang, Parthasarathy, Uchic and Woodward76,Reference Norfleet, Dimiduk, Polasik, Uchic and Mills77 and dislocation starvation theory proposed by Greer and Nix.Reference Greer, Oliver and Nix70,Reference Greer and Nix78 It is believed that the latter mechanism plays an important role only when the pillar at or below the submicrometer. HEAs, which were also first reported in 2004, are solid solutions with a simple fcc or bcc structure (only a few with hcp structures). Two questions thus arise: What is the strength of these HEA pillars at micron and submicron scales, compared with their bulk forms? And what are the size effects of fcc and bcc HEAs, compared with those of pure fcc and bcc metals? Using the microcompression method, several research groups have investigated these questions.
A. Microcompression of fcc HEA pillars
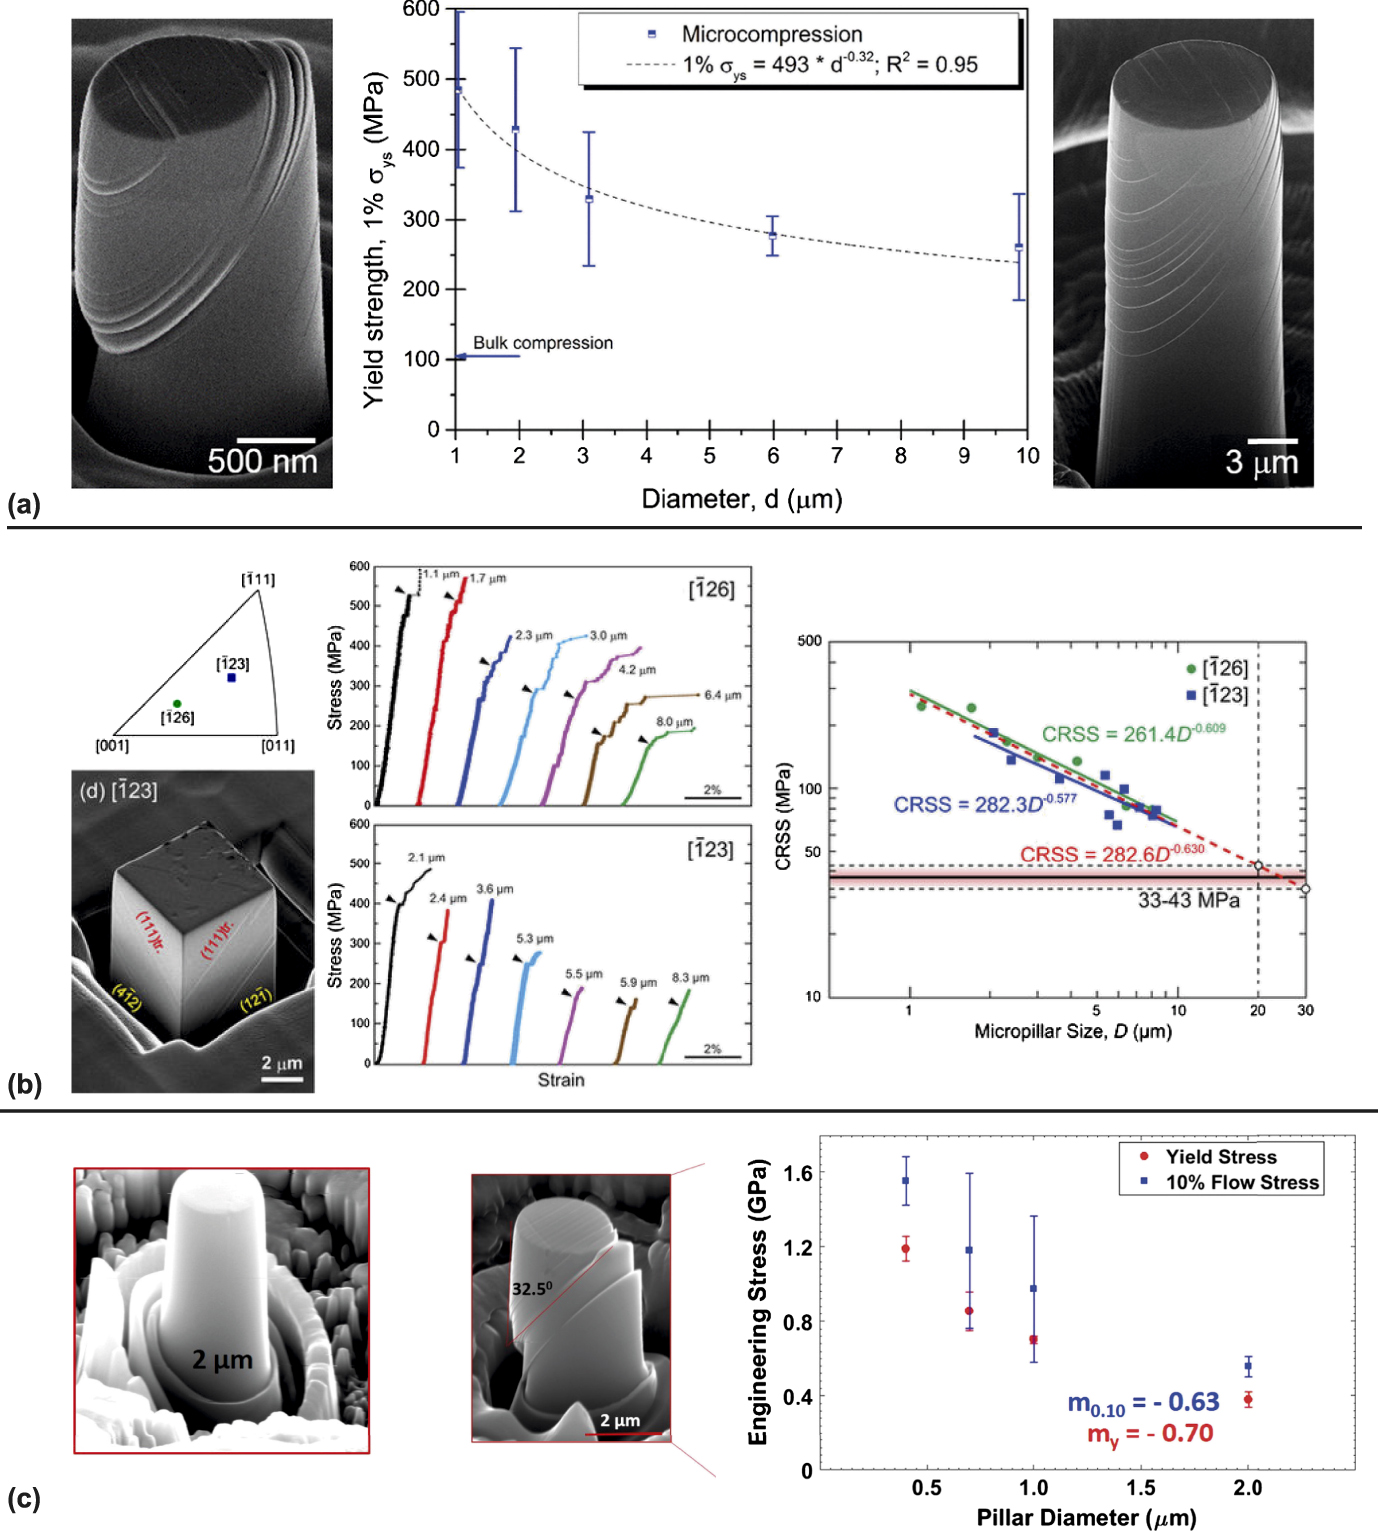
The largest body of literature on microcompression of HEAs is focused on the fcc FeCrCoMnNi HEA.Reference Liu, Guo, Liu, Ye, Yang, Wang, Yang, An and Liu79–Reference Heczel, Kawasaki, Ugi, Jang, Langdon and Gubicza84 However, the reported size-effect exponents by several groups are not very consistent. Raghavan et al.Reference Raghavan, Kirchlechner, Jaya, Feuerbacher and Dehm81 compressed single-crystal (SC) FeCrCoMnNi micropillars (cylinder shape, 1–10 µm in diameter) along [11 3 5] orientation [Fig. 6(a)]. They observed a planar slip on the  $\left( {1\bar{1}1} \right)$[110] slip system, with the highest Schmid factor of 0.48. The size dependence of yield strength follows a power–law relation with a log–log exponent of −0.32, which is a considerably lower size effect than that of pure fcc metals (m ∼ −0.6). They suggested that their lower size effect than that pure fcc metals was attributed to a high bulk-to-theoretical strength ratio in the HEA. In a similar study, Zhang et al.Reference Zhang, Siu, Liao, Wang, Yang and Lu82 reported a size-effect exponent of −0.46 in such fcc HEA, also showing a lower size effect than typical fcc metals.
Okamoto et al.Reference Okamoto, Fujimoto, Kambara, Kawamura, Chen, Matsunoshita, Tanaka, Inui and George83 investigated the size effect of the same fcc FeCrCoMnNi HEA by compressing rectangular micropillars (diameters of ∼1–8 µm) along the loading orientations of  $\left[ {\bar{1}26} \right]$ and
 $\left[ {\bar{1}23} \right]$ [Fig. 7(b)]. They found that the slip systems were also {111}
 $\left\langle {\bar{1}01} \right\rangle$, but the size-effect exponents were about −0.63 (independent of orientation), which was comparable to that of typical fcc metal micropillars. In another fcc HEA (Al0.7CoCrFeNi), Giwa et al.Reference Giwa, Liaw, Dahmen and Greer80 studied the size effect of the fcc phase and showed a size-effect exponent of −0.66, which is also equivalent to most of the fcc metals [Fig. 7(c)].
(a) Typical SEM images of the fcc FeCoCrMnNi HEA micropillars after deformation (1–10 µm in diameter, cylinder shape); Scaling of the yield strength as a function of the pillar diameter, with a size-effect exponent of about −0.32.Reference Raghavan, Kirchlechner, Jaya, Feuerbacher and Dehm81 (b) SEM image of the fcc FeCoCrMnNi HEA micropillars after deformation (∼1–8 µm in diameter, rectangular shape) deformed along  $\left[ {\bar{1}23} \right]$ orientation. The size-effect exponent is about −0.6.Reference Okamoto, Fujimoto, Kambara, Kawamura, Chen, Matsunoshita, Tanaka, Inui and George83 (c) Microcompression of a fcc Al0.7CoCrFeNi HEA micropillar (450 nm–2 µm in diameter, cylinder shape), the size-effect exponent is about −0.6.Reference Giwa, Liaw, Dahmen and Greer80 (Reproduced with permission from Refs. Reference Giwa, Liaw, Dahmen and Greer80, Reference Raghavan, Kirchlechner, Jaya, Feuerbacher and Dehm81, and Reference Okamoto, Fujimoto, Kambara, Kawamura, Chen, Matsunoshita, Tanaka, Inui and George83.)
It is interesting to find that different groups have reported various size effects even in the same fcc HEA. As reported in pure metals and other solids, the size effect is not only dependent on its crystal structure but also relies on many other factors, such as defect density and how the sample prepared.Reference El-Awady, Uchic, Shade, Kim, Rao, Dimiduk and Woodward85,Reference Hütsch and Lilleodden86 The difference of the size effects observed in the fcc HEAs might be attributed to many other factors such as FIB preparation, initial dislocation density, local point defect density, microstructure, and pillar shapes. So far, only two HEAs have been reported for microcompression, and future work is needed to make a substantial conclusion. Also, the reported FIB-milled HEA pillars are limited to ∼500 nm in diameter, and what the deformation mechanism and mechanical strength of an HEA pillar with an even smaller dimension (<100 nm) are still unknown.
B. Microcompression of bcc HEA pillars: single-crystalline (sx) and nanocrystalline (nc)
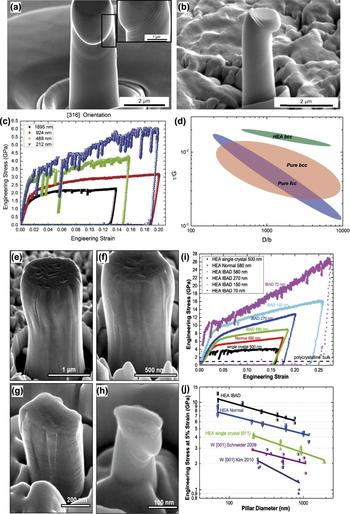
Using the microcompression method, the author of this review and his coworkers studied bcc HEA micropillars and their size effects for the first time, on both sx-HEA pillarsReference Zou, Maiti, Steurer and Spolenak87 and nc-HEA pillars.Reference Zou, Ma and Spolenak88 Sx-NbMoTaW HEA pillars (diameters of ∼250 nm–2 µm) were compressed along two orientations ([001] and [316]). These bcc HEA pillars can reach high strength levels of ∼4 GPa, which is ∼3 times higher than that of the bulk HEA (Fig. 8). The bcc-HEA pillars exhibit higher strengths than any of the pure bcc Nb, Mo, Ta, and W pillars,Reference Schneider, Kaufmann, Clark, Frick, Gruber, Monig, Kraft and Arzt72–Reference Kim, Jang and Greer75 in both absolute and normalized values. Also, the bcc-HEA pillars show relatively low compressive size effects, with size-effect exponents (m) of about −0.3 [Fig. 8(d)]. The higher strength levels and lower size dependence for the HEA could be attributed to the increased lattice resistance caused by localized distortion at atomic length scales, as observed in high-resolution TEM and detected by XRD.Reference Zou, Maiti, Steurer and Spolenak87 In addition, Giwa et al.Reference Giwa, Liaw, Dahmen and Greer80 also studied the size effect in a bcc (A2 + B2) phase in an Al0.7CoCrFeNi HEA. They discovered that the bcc phase also presented a ‘‘smaller is stronger’’ size effect with the exponent of −0.28 between strength and pillar diameter, which is also lower than all size dependence reported for pure bcc metals.
SEM images of post-compressed [316]-oriented sx-HEA Nb25Mo25Ta25W25 pillars with approximate diameters of (a) 2 µm and (b) 1 µm. An enlarged image which presents sharp slip bands is shown in the inset of (a). (c) Stress–strain curves for the sx-HEA pillars. (d) Schematic illustration of size-dependent strengths for different metallic systems: FIB-milled pure fcc and bcc pillars. The HEA bcc pillars exhibit both higher absolute and normalized strength levels than any other bcc metals but a relatively low size dependence of strengths.Reference Zou, Maiti, Steurer and Spolenak87 (e)–(j) Compression results for the pillars prepared from the HEA films. (e)–(h) SEM images of typical as-deformed HEA pillars (IBAD) with the diameter (D) ranging from approximately 1 μm to 100 nm. (i) Representative stress–strain curves of the HEA pillars, showing a size-dependent strength. (j) A comparison of the strength–size relationships for the columnar-structured HEA pillars, SC HEA (based on the specimen and method in Ref. Reference Zou, Maiti, Steurer and Spolenak87) and W pillars.Reference Schneider, Kaufmann, Clark, Frick, Gruber, Monig, Kraft and Arzt72,Reference Kim, Jang and Greer75,Reference Zou, Ma and Spolenak88 (Reproduced with permission from Refs. Reference Zou, Maiti, Steurer and Spolenak87 and Reference Zou, Ma and Spolenak88.)

For pure bcc metal pillars, Schneider and his co-workersReference Schneider, Kaufmann, Clark, Frick, Gruber, Monig, Kraft and Arzt72 noticed that various m values in bcc metals could be correlated with different critical temperatures (T c), above which flow stress becomes insensitive to test temperature and equivalently residual Peierls potentials: the higher T c and the lower size dependence. The popular interpretation of this correlation is that different nonplanar dislocation cores in bcc metals play essential roles in the mobility of screw dislocations. Both the simulationReference Weinberger and Cai89 and experimentReference Greer, Weinberger and Cai90 suggest that bcc and fcc metal pillars differ in the controlling mechanisms of the size effect. The lower size dependence of the strength of bcc HEAs compared to pure bcc metals could be attributed to the severe lattice distortions in the HEA, which results in a significantly higher Peierls potential than for each of the constituents.
The first report about nc-HEA micropillars examined FIB-milled pillars prepared from bcc NbMoTaW HEA thin films by the co-sputtering technique.Reference Zou, Ma and Spolenak88 Such nc-HEA pillars exhibit extraordinarily high yield strengths of approximately 10 GPa—among the highest reported strengths in micro-/nanopillar compression (even stronger than nc-W pillars) and one order of magnitude higher than that of its bulk form. As shown in Figs. 8(e)–8(j), the smallest HEA pillars (∼70–100 nm in diameter) exhibit high yield strengths of ∼8–10 GPa, with a low size-effect exponent of −0.2. Such ultra-high strength in the nc-HEA pillars is contributed by the combination of substantial solid-solution hardening effect in HEAs, sample-size effect (source-controlled strengthening) and grain-boundary strengthening.Reference Zou, Ma and Spolenak88
C. Microcompression of nanocrystalline (nc) HEAs: room temperature versus high temperature
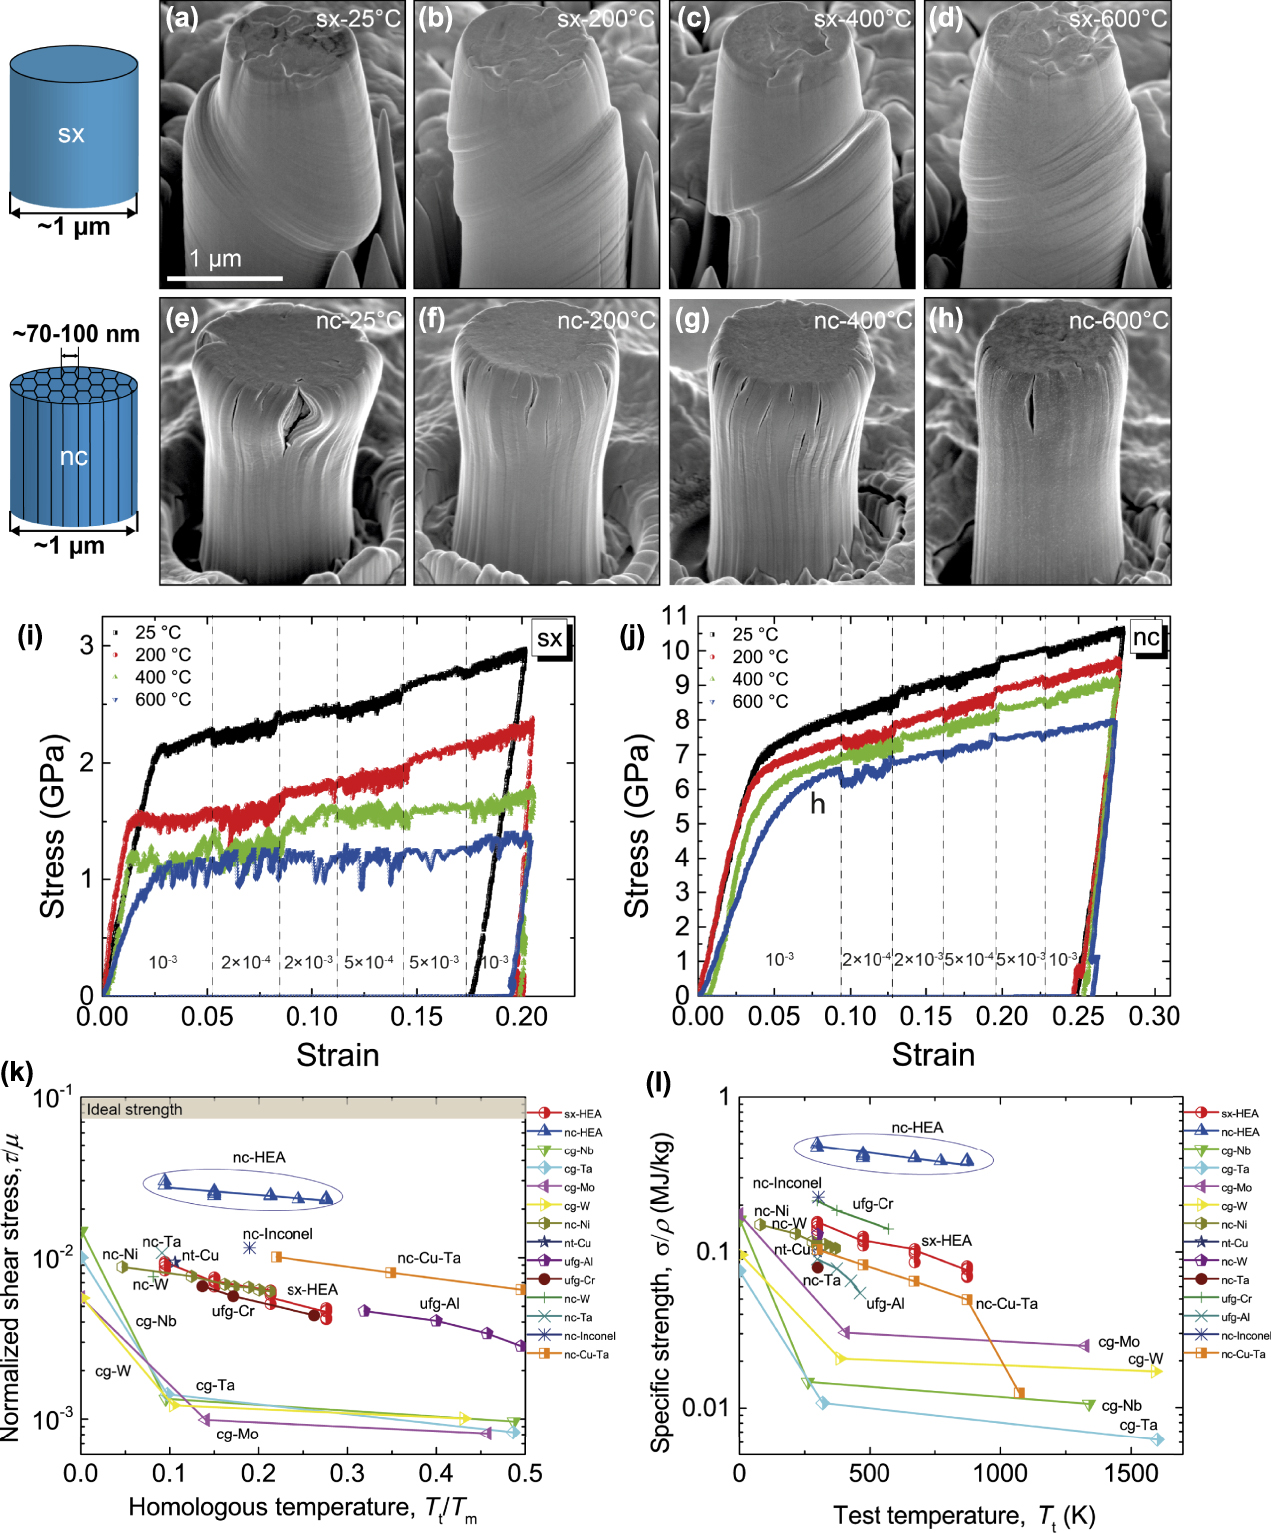
Based on high-temperature indentation, the mechanical properties of sx-HEA and nc-HEA pillars can be compared over a broad temperature range. In general, nanocrystalline metals exhibit high strengths at ambient conditions, yet their strengths substantially decrease with increasing temperature. Surprisingly, bcc NbMoTaW nc-HEA pillars retain an extraordinarily high yield strength over 5 GPa up to 600 °C—one order of magnitude higher than that of its coarse-grained form, and five times higher than that of its single-crystalline counterpart,Reference Zou, Wheeler, Ma, Okle and Spolenak62 as shown in Fig. 9.
Compression results for the sx- and nc-HEA micropillars from room temperature to 600 °C. Representative SEM images of the deformed sx-HEA pillars [(a)–(d)] and nanostructured columnar-grained HEA pillars [(e)–(h)]. Corresponding engineering stress–strain curves of (i) the sx-HEA and (j) nc-HEA pillars, showing how flow stresses change by temperature. Strain-rate jump tests are applied to measure the SRS using initial and final strain rates of 10−3 s−1 and four other strain rates of 2 × 10⁻⁴ s−1, 2 × 10⁻³ s−1, 5 × 10⁻⁴ s−1, and 5 × 10⁻³ s−1. (j) Normalized critical resolved shear stress (τ/µ) as a function of homologous temperature (T t/T m) for the sx- and nc-HEA pillars, indicating that the nc-HEA pillars exhibit the highest normalized strength (∼1/50–1/30) among all the bulk and nanostructured metals (τ is the critical resolved shear strength, µ is the corresponding shear modulus, T t is the testing temperature, and T m is the melting temperature). (k) Ashby-inspired map of specific strength (strength-to-density ratio) versus test temperature, showing that the nc-HEAs exhibit the highest strength-to-density ratio in all the nc-metals at the same tested temperatures.Reference Zou, Wheeler, Ma, Okle and Spolenak62 (Reproduced with permission from Ref. Reference Zou, Wheeler, Ma, Okle and Spolenak62.)
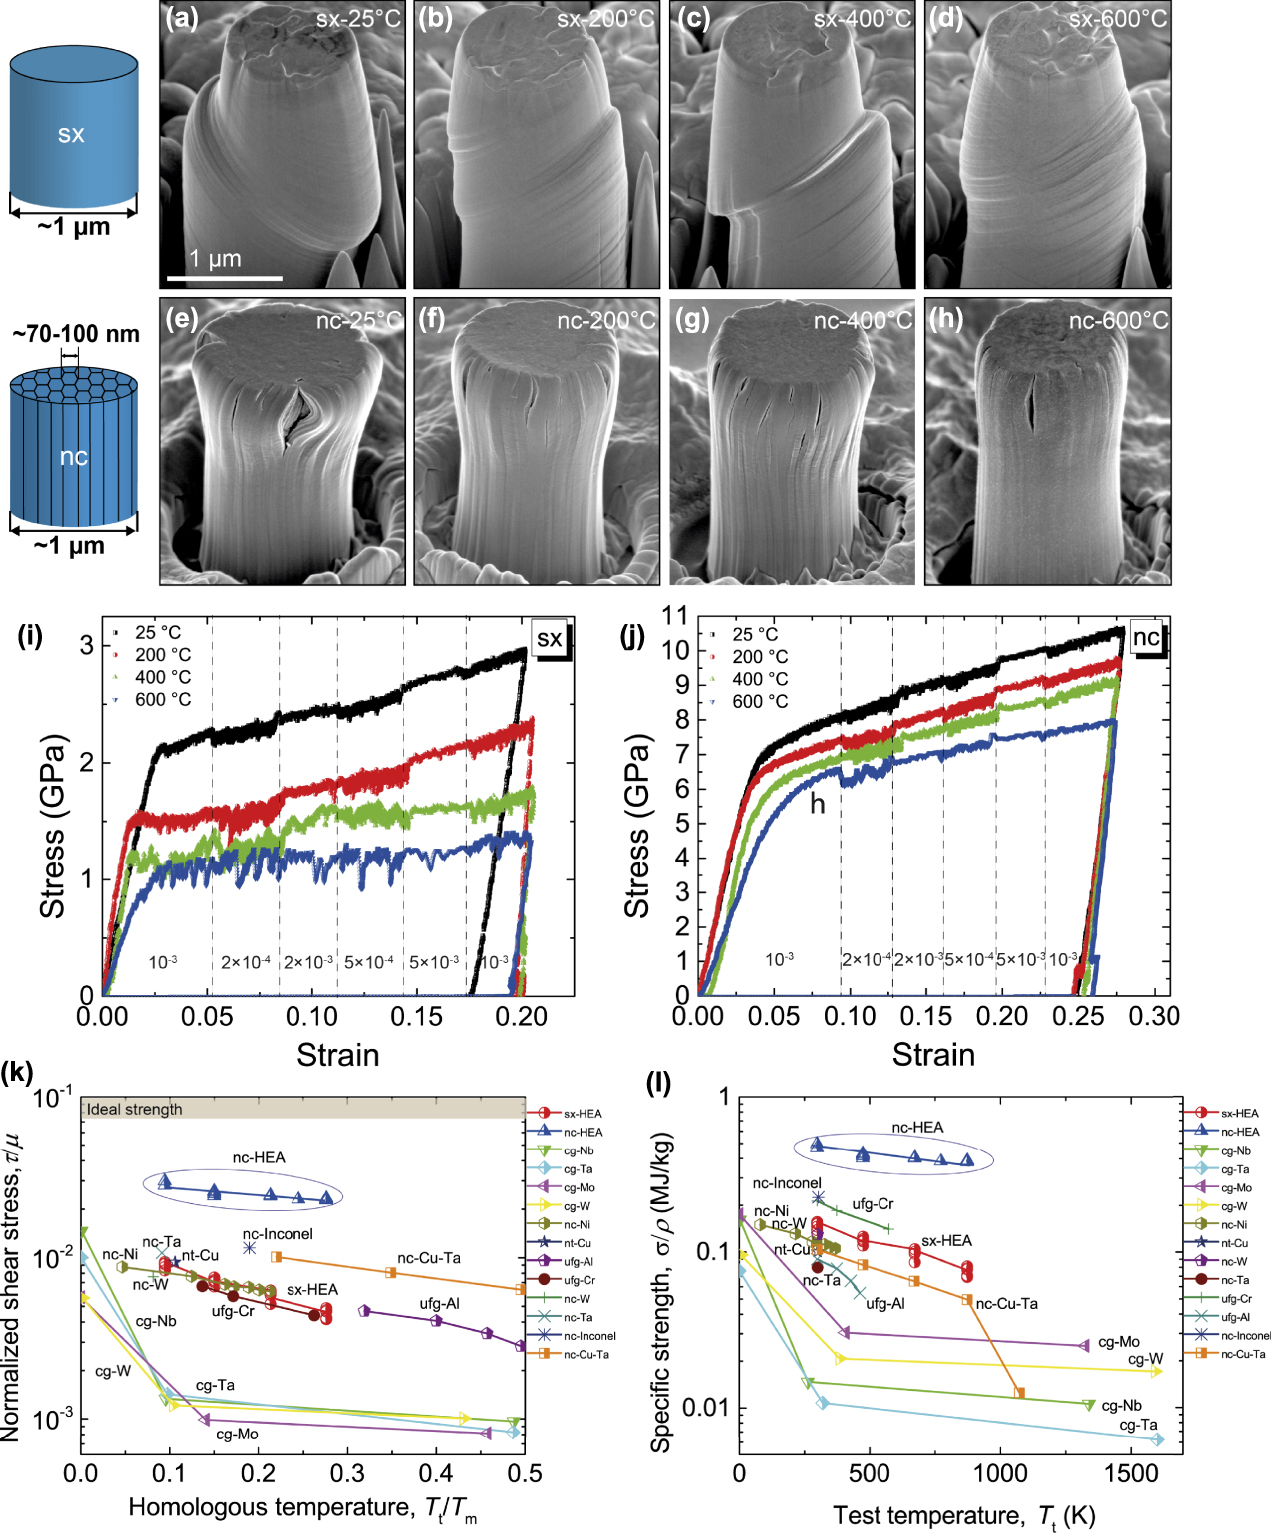
The strain-rate jump method was also applied to determine the SRS and activation volume (V). At 600 °C, the activation volume of the sc-HEA pillars is ∼175b 3, implying that sx-HEAs are deformed by the Peierls mechanism at 600 °C, which is comparable to the deformation of fcc metalsReference Wheeler, Maier, Durst, Göken and Michler91; At 600 °C, the V of the nc-HEAs slightly increases to ∼50b 3 at 600 °C, suggesting that the deformation of nc-HEAs could be still dominated by the kink-pair mechanism rather than the grain-boundary mediated mechanism. Such nanostructured HEAs reveal strengthening figures of merit—normalized strength by the shear modulus above 1/50 and strength-to-density ratios above 0.4 MJ/kg, which are substantially higher than any previously reported values for nanocrystalline metals in the same homologous temperature range [Figs. 9(k) and 9(j)].
Using the similar calculation method in the last section, the activation volumes for the sx- and nc-HEAs are calculated to be ∼10b 3 at room temperature. This value is identical to that reported from bulk tensile measurements on W, in which thermally activated double kink mechanism is believed to be responsible for the motion of screw dislocations.Reference Wei and Kecskes92 With increasing temperature, the V of the sx-HEA pillars increases to an average value of ∼175b 3 at 600 °C, implying that sx-HEAs are deformed by, or partially by, the Peierls mechanism at 600 °C, which is comparable to the deformation of fcc metals.Reference Wheeler, Maier, Durst, Göken and Michler91 The V of the nc-HEAs slightly increases to ∼50 b 3 at 600 °C, suggesting that the deformation of nc-HEAs could be still dominated by the kink-pair mechanism rather than the grain-boundary mediated mechanism. These V values for bcc HEAs are different from that of previous studies on fcc HEA pillars, in which activation volumes increase with increasing test temperature, suggesting an enhanced grain-boundary mediated deformation.Reference Mohanty, Wheeler, Raghavan, Wehrs, Hasegawa, Mischler, Philippe and Michler93
IV. In situ fracture tests of HEAs at small scales
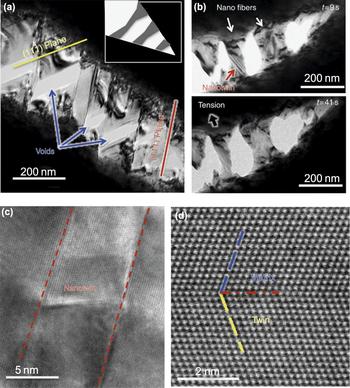
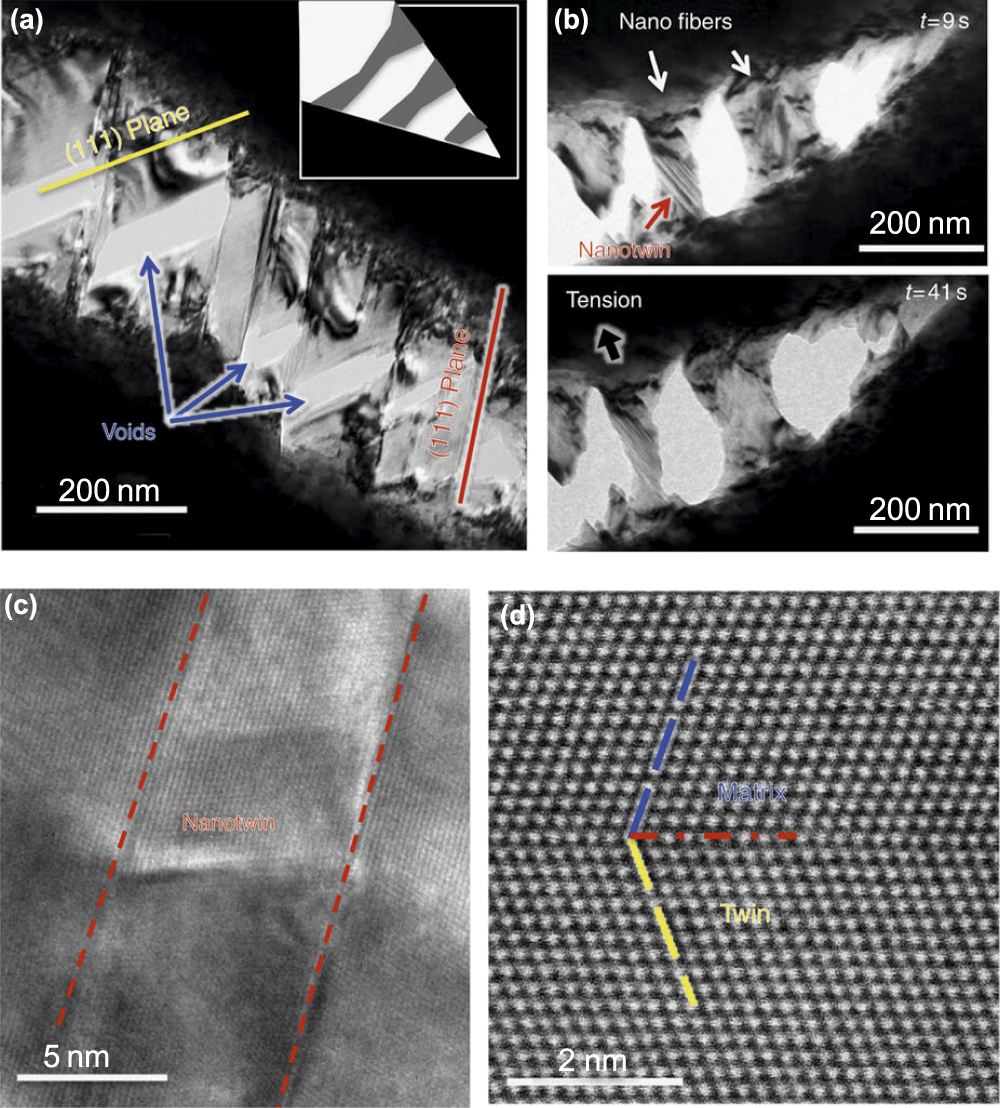
Using in situ SEM and TEM techniques, fracture properties of HEAs have been studied at the micrometer and nanometer scales. The extraordinarily high fracture toughness of the bulk FeCrCoMnNi HEA attracts significant attention in the materials community. The bulk single-phase FeCrCoMnNi alloy displays tensile strength levels of ∼1 GPa, excellent ductility (∼60–70%), and exceptional fracture toughness (K JIc > 200 MPa m1/2). Using in situ straining in a TEM, Zhang et al.Reference Zou, Wheeler, Ma, Okle and Spolenak62 report on the atomistic to microscale mechanisms underlying the origin of these properties, using an in situ straining test in a TEM (Fig. 10). They identified multiple deformation mechanisms in the HEA, which are rarely observed simultaneously in metallic alloys, including the easy motion of Shockley partials, their interactions to form stacking-fault parallelepipeds and arrest at planar slip bands of undissociated dislocations. These mechanisms together generate high strength, work hardening, and ductility. Furthermore, crack propagation impeded by twinned, nanoscale bridges that form between the near-tip crack faces and delay fracture by shielding the crack tip [Fig. 10(b)]. Without such in situ fracture test, it is difficult to understand the fracture behavior in detail. Using in situ TEM, Cai et al.Reference Cai, Cui, Liu, Li, Dong, Lu and Jin94 studied the fracture behavior of a bcc NiCrCoV HEA phase. Using this method, they can measure Young’s module, fracture strength, and ultimate elongation (∼107 GPa, ∼2.70 GPa, and ∼2.6%, respectively) and observe cleavage fracture with the cleavage plane of {112}.
(a) Bright-field TEM image of a growing crack during in situ straining of the fcc FeCoCrMnNi HEA. Submicron/nanoscale voids at the intersection of slip systems are observed. (scale bar, 200 nm) (b) TEM images show nanoscale fibers bridge the cracks (scale bar, 200 nm). Nanotwins can be seen to form in the fibers, which enhance ductility and toughness. (c) High-resolution TEM image of deformation twinning during in situ TEM tensile test (scale bar, 5 nm). (d) HAADF-STEM image of the atomic structure of the deformation nanotwins (scale bar, 2 nm).Reference Zhang, Mao, Wang, Gludovatz, Zhang, Mao, George, Yu and Ritchie99 (Reproduced with permission from Ref. Reference Zhang, Mao, Wang, Gludovatz, Zhang, Mao, George, Yu and Ritchie99.)
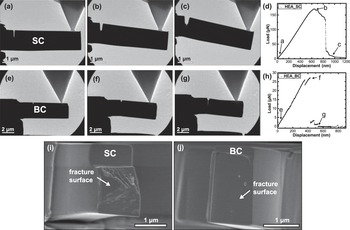
Previous studies on bulk bcc HEAs imply that GBs affect fracture behavior of bcc HEAs, but quantitative studies on their fracture properties are scarce. Using in situ microcantilever tests, the author of this review and his co-workers compared the fracture toughness of single crystal (SC) and bicrystal (BC) HEAs (NbMoTaW). Figures 11(a)–11(c) and 11(e)–11(g) present snapshots from movies of typical SC- and BC-cantilevers upon loading, respectively. Figures 11(d) and 11(h) show their corresponding load–displacement curves. The SC-cantilever exhibits a linear elastic behavior at the initial loading stage, a slight yielding before reaching the maximum load, and a subsequent gradual force drop. In contrary to the SC-cantilevers, all the BC-cantilevers experienced a catastrophic event at the maximum load. They did not show any plastic yielding before fracture, and the crack tips suddenly opened and advanced along the GBs [Fig. 11(g)], indicating that the BC specimens are more brittle than the SC ones. After in situ cantilever tests, fracture surfaces of the two types of cantilevers reveal distinct surface morphologies [Figs. 11(i) and 11(j)]. Quantitatively, the fracture toughness of these cantilevers was measured: The SC cantilevers fail by quasi-cleavage fracture with fracture toughness K Ic of ∼1.3–2.1 MPa m1/2, while the BC cantilevers exhibit brittle intergranular fracture with much lower K Ic of ∼0.2 MPa m1/2. The observation from small-scale testing suggests that the poor fracture resistance of the polycrystalline refractory HEAs is attributed to the GB segregation and formation of brittle oxides and nitrides at GBs.
Representative in situ TEM images of deflected SC—(a–c) and BC—(e–g) cantilevers: (a) and (e) initial contacts; (b) and (f) crack tip opening at the maximum load; (c) and (g) fracture and load drops. (d) and (h) Corresponding indenter load–displacement curves for the SC- and BC-cantilevers, respectively. The indenter displacement was evaluated using image correction software. Typical post-mortem SEM images of the fracture surfaces: (i) SC-cantilever specimen shows a quasi-cleavage feature with river markings, suggesting SC-HEAs are not intrinsically brittle; (j) the BC-cantilever specimen exhibits a typical feature of brittle intergranular fracture.Reference Zou, Okle, Yu, Sumigawa, Kitamura, Maiti, Steurer and Spolenak40 (Reproduced with permission from Ref. Reference Zou, Okle, Yu, Sumigawa, Kitamura, Maiti, Steurer and Spolenak40.)

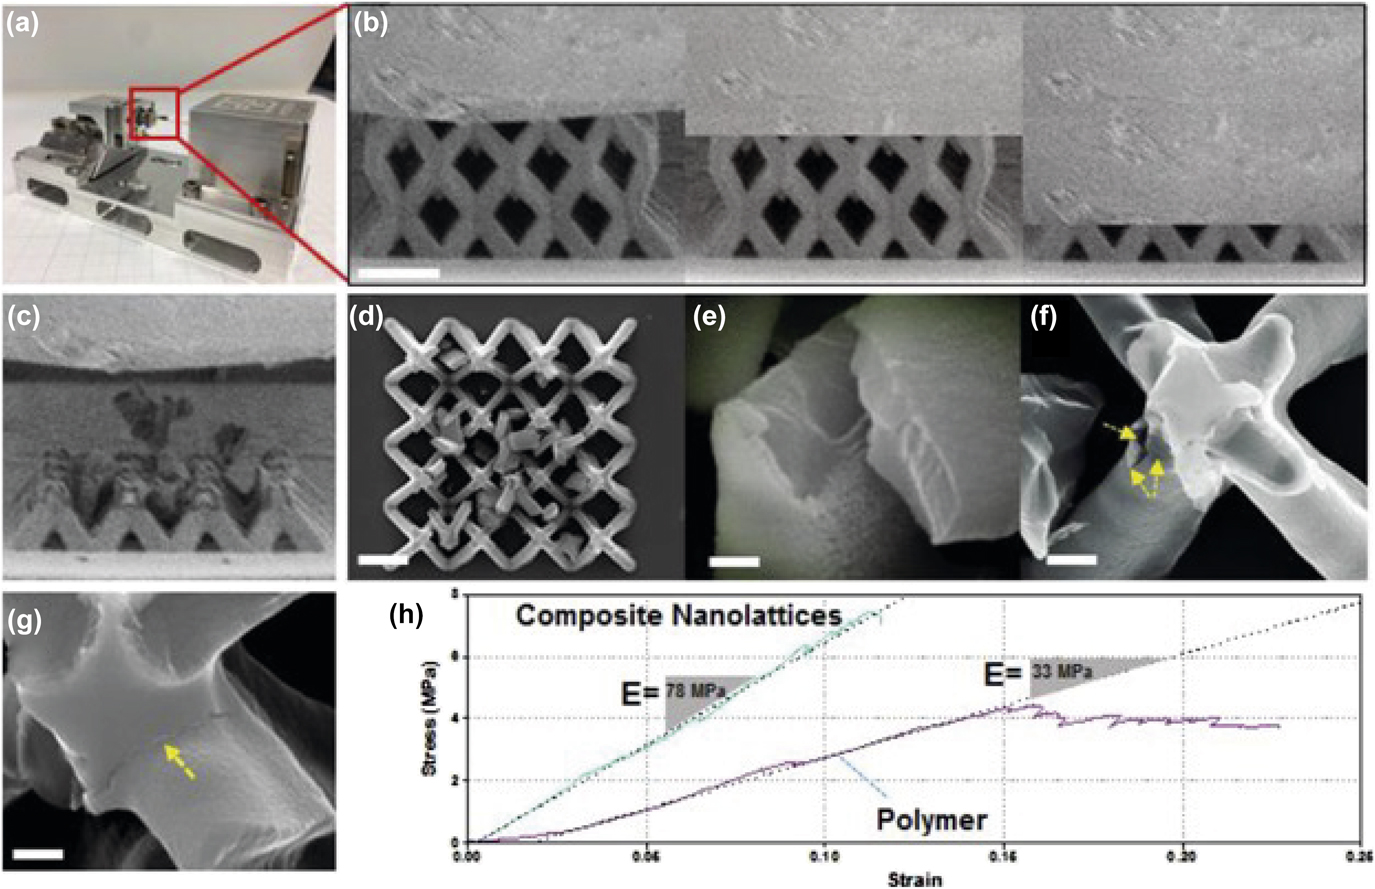
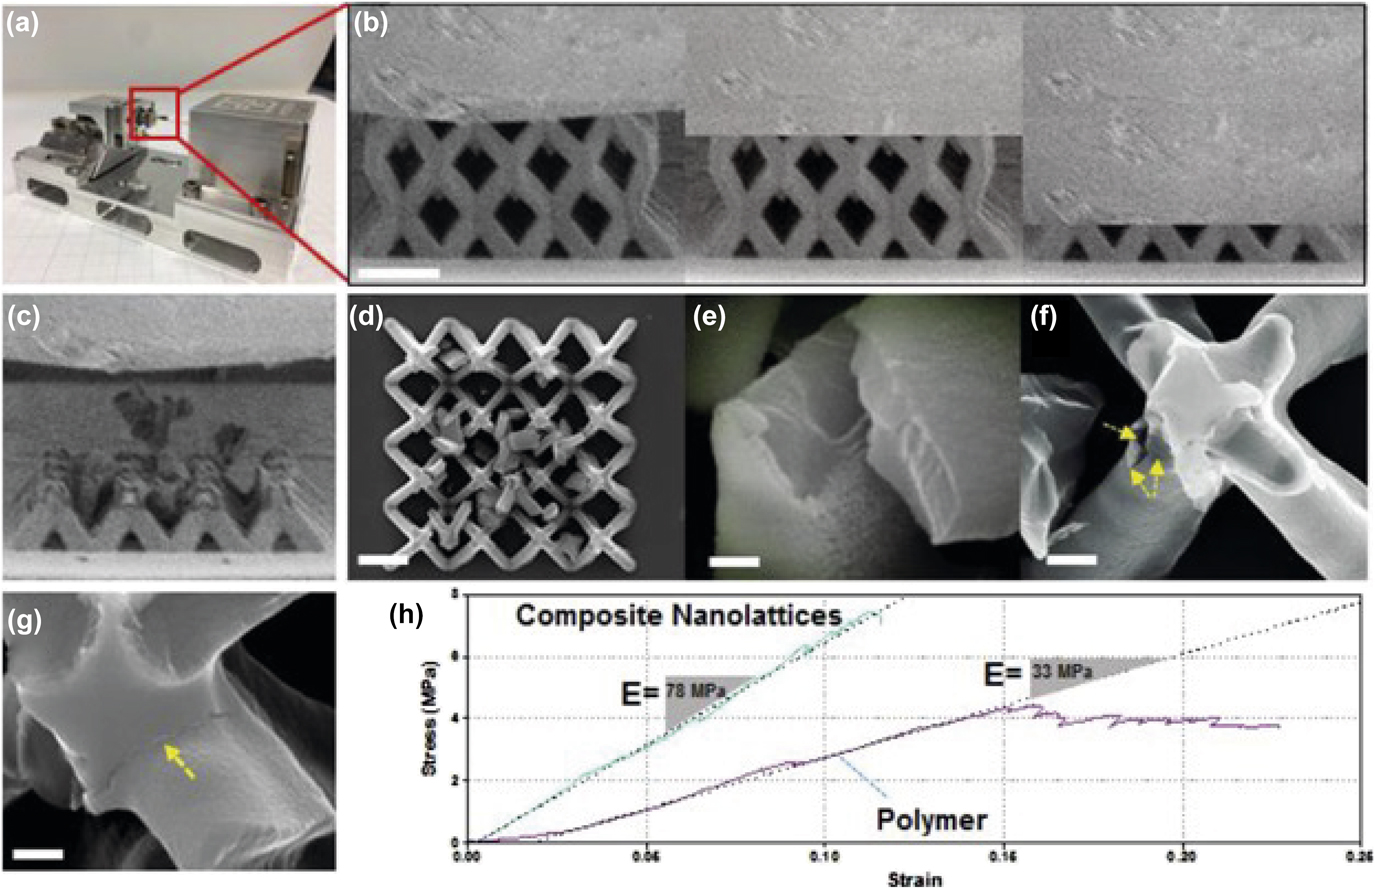
Using in situ SEM microcompression, Gao et al.Reference Gao, Song, Jiao, Liao, Luan, Surjadi, Li, Zhang, Sun and Liu95 studied mechanical properties and fracture behavior of an HEA-coated nanolattice structure, which was made by a polymetric lattice coated with an 80-nm thick HEA thin film [CoCrFeNiAl0.3) (Fig. 12]. In the composite nanolattice, they observed a linear region up to 11% strain at 7.76 MPa followed by a brittle failure at 12% strain, implying an improved toughness compared to that of the polymer nanolattice. Unfortunately, the authors did not give a further evaluation of the fracture toughness of such HEA-coated nanolattice. The stress–strain curve shows structural instabilities, which is caused by the fracture of individual struts driven by the brittle HEA layers near or at the junctions. Typically, failure in such structural materials is initiated at the weakest connection, which is determined by the competing effects of stress concentrators at surface imperfections and local stresses. The optimization of lattice structure and HEA coating thickness would be interesting for future study. This concept of combining HEA with polymer lattice structures demonstrates the potential of fabricating novel architected metamaterials with tunable mechanical properties.
Compression tests on an HEA-coated nanolattice structure. (a) In situ SEM compression test set up for testing the composite nanolattice. (b) Screenshot SEM images of the composite nanolattice during the compression test (side view). (c) and (d) Side and top view of crushed composite nanolattice structure after the compression test. (e)–(g) Close-up view of a shell fragment from (d). (h) Stress–strain plots of a polymer-only nanolattice and a composite nanolattice that were tested under the same condition. The scale bars in (b)–(d) is 5 mm, and 500 nm in (e)–(g), respectively.Reference Gao, Song, Jiao, Liao, Luan, Surjadi, Li, Zhang, Sun and Liu95 (Reproduced with permission from Ref. Reference Gao, Song, Jiao, Liao, Luan, Surjadi, Li, Zhang, Sun and Liu95.)
Compared to nanoindentation and microcompression studies of HEAs, fracture properties of HEAs at small length scales have been much less reported. It is mainly because the experimental setup for small-scale fracture testing is relatively complicated. With more nanomechanical tools becoming mature, particularly with in situ capacities, more sophisticated experiments can be carried out to investigate fracture behavior of a large variety of HEAs.
V. CONCLUSIONS AND OUTLOOK
This article reviews that nanomechanical techniques have become valuable tools to study the mechanical behavior of an emerging family of metallic systems—HEAs, offering many opportunities for scientific inquiry.
A large body of literature is concentrated on nanoindentation or microcompression of a few well-known HEAs, such as fcc FeCoCrMnNi and bcc NbMoTaW. A few interesting phenomena and useful properties have been reported, as summarized below:
(1) The activation volume for the onset of plasticity in HEAs is reported to be higher than that of regular metals, suggesting a complex cooperative motion of several atoms during the dislocation nucleation process in HEAs. But it is mainly reported by one research group and more investigations on other HEAs are needed to confirm this conclusion.
(2) Nanoindentation/micropillar strain-rate jump testing on both sx-HEAs and nc-HEAs reveals that there are competing mechanisms between dislocation mechanism (bulk behavior) and diffusion or grain-boundary sliding mechanism (nanocrystalline behavior) over a large temperature range. The fundamental difference of deformation mechanisms between HEAs and regular alloys are still not very clear.
(3) Nc-HEAs exhibit better creep resistant than pure fcc Ni, which might be attributed to the sluggish diffusion in HEAs, but further study is needed to confirm it.
(4) A study of wear and friction of a bcc HEA indicates enhanced wear resistance in HEAs, but nanoscale wear/friction of HEAs has been much less explored than other mechanical properties.
(5) The microcompression method has been used to study the size dependence of plasticity in fcc and bcc HEA pillars: Fcc HEA pillars exhibit the similar size effects with pure fcc metal pillars, while bcc HEA pillars show a slightly lower size effect than those of pure bcc metals, which could be due to higher lattice friction in HEAs.
(6) Bcc nc-HEA micropillars exhibit substantially better mechanical and thermal stability than any previously reported nanocrystalline metals over the same homologous temperature range.
(7) In situ SEM and TEM capacities have been used to study the fracture properties of HEAs in various forms, including single crystals, bicrystals, and HEA-coated nanolattices.
A. Challenges
Nanomechanical studies of HEAs are relatively new—much in contrast to the studies of regular metals, typical alloys, and metallic glasses. So far, only less than ten HEAs, among over 400 produced HEAs, have been studied using a limited number of nanomechanical methods. Sometimes, the reported results are not consistent, and many underlying mechanisms are still unknown As a consequence, very fundamental aspects of mechanical behavior remain unresolved for HEAs at small scales. Although molecular dynamics (MD) simulations have provided helpful insight into small-scale plasticity in pure metals, and even binary alloys, it is very challenging to use MD methods to simulate the plastic deformation of HEAs. HEAs exhibit an interesting atomic-level structure—various elements are randomly distributed in a simple lattice, but a key question is still not fully answered: What is fundamentally new in HEAs regarding their deformation mechanism?
B. Perspectives
It is worth learning from the recent literature on nanomechanics of HEAs and exploring for future studies on this topic. As many advanced nanomechanical techniques are becoming mature, they will provide new powerful tools to investigate a large variety of HEAs, both known and unknown. To conclude this article, a few unanswered questions and new directions, which would be interesting for future research, are pointed out:
(1) What is the deformation mechanism of HEAs at the nanometer regime of 100 nm and below? So far, the smallest HEA pillars reported are about 100 nm, mostly for the fcc FeCoCrMnNi. As critical stress increases as a sample dimension decreases, new deformation mechanisms might be activated.
(2) What are the nanomechanical behavior and size effects of other HEAs, except for typical fcc and bcc ones, for example, hcp HEAs, ordered HEAs, and multiple-phase HEAs?
(3) Compared to nanoindentation and microcompression studies of HEAs, their fracture, fatigue, and creep properties as well as relevant environmental effects, such as oxidation and irradiation, have been much less studied and will be interesting for future investigation.
(4) What is fundamentally new about atomic-level mechanical behavior in HEAs, compared to other alloys, especially stainless steels and superalloys? It is exciting to explore new mechanisms regarding dislocation nucleation, dislocation propagation, and diffusion-related deformation in HEAs.
(5) Testing of HEAs’ small features for understanding their bulk properties: HEAs do not necessarily possess single-phase or fully disordered structures. Their local structures may be dramatically changed by chemical compositions and thermal treatment, producing multiple phases as well as short- or medium-range ordering. Nanomechanical testing can provide details of mechanical properties and deformation mechanisms of each phase or nanoscale cluster, giving a better understanding of their bulk mechanical properties.
(6) High-throughput testing for new HEA design: The family of HEAs is enormous, 400 compositions have been produced and hundreds to be explored. Many HEAs contain rare or relatively rare elements, which means the process of developing HEAs is expensive. To save a significant amount of material and time, nanomechanical testing can be used as a high-throughput screening method to search the most optimized properties and compositions, paving the way in the design for new HEAs.
(7) High-entropy oxides and functional properties: the concept of “high entropy” is not only limited to metals, but it can also be applied to ceramics (e.g., high-entropy oxidesReference Rost, Sachet, Borman, Moballegh, Dickey, Hou, Jones, Curtarolo and Maria96). Moreover, rather than mechanical properties, many functional properties (e.g., superconductivityReference Koželj, Vrtnik, Jelen, Jazbec, Jagličić, Maiti, Feuerbacher, Steurer and Dolinšek97 and oxidation resistanceReference Gild, Zhang, Harrington, Jiang, Hu, Quinn, Mellor, Zhou, Vecchio and Luo98) have also been found in HEAs. Based on nanomechanical testing platforms, the multifield coupling of many properties of HEAs can also be measured and explored, including mechanical, thermal, photonic, electrical, and chemical-related properties.
ACKNOWLEDGMENTS
This work was developed with the financial support from the Discovery Grants Program (RGPIN-2018-05731) of the Natural Sciences and Engineering Research Council of Canada (NSERC) and Connaught New Researcher Award at University of Toronto.