Introduction
Soil organic carbon (SOC) plays a foundational role in sustaining key soil functions such as nutrient cycling, water retention and biomass production, while supporting broader ecosystem services including food security and carbon sequestration (Hasan et al., Reference Hasan, Zhen, Miah, Ahamed and Samie2020). However, SOC stocks have declined significantly with agricultural intensification, particularly in semi-arid regions where salinity and erosion further exacerbate degradation. Climate, land use and soil management are recognized as the principal drivers of SOC dynamics (Nunes et al., Reference Nunes, Veum, Parker, Holan, Karlen, Amsili and Moorman2021), and the European Commission’s Soil Monitoring Law now classifies SOC loss as a primary indicator of land degradation (Panagos et al., Reference Panagos, Montanarella, Barbero, Schneegans, Aguglia and Jones2022).
Accurate quantification of SOC and its vulnerability to degradation requires scalable tools capable of capturing spatial heterogeneity. Conventional soil monitoring methods remain constrained by cost and scale (Loria et al., Reference Loria, Lal and Chandra2024), while digital soil mapping (DSM) and machine learning (ML) offer new opportunities for high-resolution modelling of SOC-to-clay interactions (Pavlovic et al., Reference Pavlovic, Ilic, Ralevic, Antonic, Raffa, Bandecchi and Culibrk2024). These interactions are shaped by bioclimatic and topographic factors, as well as by vegetation inputs and microbial processes that influence mineral weathering and carbon stabilization (He et al., Reference He, Dai, Yi, Wang, Peng and Yan2023; Wiesmeier et al., Reference Wiesmeier, Urbanski, Hobley, Lang, von Lützow, Marin-Spiotta, Wesemael, Rabot, Ließ, Garcia-Franco, Wollschläger, Vogel and Kögel-Knabner2019).
The SOC-to-clay ratio has gained traction as a practical soil degradation metric, with <1:13 adopted as a threshold for degraded mineral soils (Johannes et al., Reference Johannes, Matter, Schulin, Weisskopf, Baveye and Boivin2017; European Commission, 2023). Yet, emerging research highlights its limitations: clay-rich soils may be misclassified as degraded due to their inherent SOC mineralization dynamics, while sandy soils may exhibit resilience despite low SOC-to-clay values (Poeplau and Don, Reference Poeplau and Don2023). Recent assessments from south-eastern Europe further show that SOC-to-clay thresholds vary with pedo-climatic context and that the ratio alone can misclassify contrasting soil types; these studies advocate combining SOC-to-clay with additional indicators (e.g., bulk density, texture, or ‘observed/typical’ SOC benchmarks) for more reliable appraisal (Paltineanu et al., Reference Paltineanu, Domnariu, Mocanu and Dumitru2025a; Paltineanu et al., Reference Paltineanu, Mocanu, Vizitiu, Domnariu and Dumitru2025b; Feeney et al., Reference Feeney, Bentley, De Rosa, Panagos, Emmett, Thomas and Robinson2024). Evidence from France likewise questions the universal applicability of SOC-to-clay as a soil-health index, showing weak relationships with bulk density and aggregate stability and strong modulation by soil type, pH and climate (Rabot et al., Reference Rabot, Saby, Martin, Barré, Chenu, Cousin, Arrouays, Angers and Bispo2024). At the European scale, climate has been identified as a dominant control on SOC, often overshadowing texture effects, underscoring that SOC-to-clay should be evaluated within climatic and edaphic contexts rather than applied as a one-size-fits-all indicator (Feeney et al., Reference Feeney, Bentley, De Rosa, Panagos, Emmett, Thomas and Robinson2024).
Despite the metric’s widespread use, its applicability in semi-arid environments remains underexamined. These landscapes pose unique challenges, with high temperatures and erratic precipitation accelerating SOC loss, yet their texture and mineralogy may defy conventional degradation indicators. Therefore, mapping SOC and validating the SOC-to-clay ratio in these systems is essential for effective soil conservation strategies.
The current study investigates SOC stocks and the SOC-to-clay ratio in the semi-arid croplands of Şanlıurfa, Türkiye, where pistachio cultivation dominates and soil degradation is intensifying. ML models (Random Forest, Gradient Boosting, CART, LightGBM) were applied to: i) predict spatial patterns of SOC and SOC-to-clay ratio; ii) assess the ratio’s reliability against a composite soil quality index (SQI); and iii) identify context-specific limitations to its interpretation. The findings offer practical insights for DSM and contribute to ongoing efforts under the EU Soil Strategy 2030 to preserve carbon stocks and enhance land sustainability (Lal, Reference Lal, Ersahin, Kapur, Akca, Namli and Erdogan2017; De Rosa et al., Reference De Rosa, Ballabio, Lugato, Fasiolo, Jones and Panagos2024).
Material and methods
Study area
The study was conducted in the agricultural heartland of Şanlıurfa Province, southeastern Türkiye, a region renowned for its pistachio and cotton production, located approximately between 39.014°–39.470° E longitudes and 38.065°-38.288° N latitudes (Figure 1).
Geographical location of the study area and soil sampling points.

Geologically, the area displays heterogeneity, with Cenozoic limestone, basalt and alluvial deposits shaping soil formation and land use (Figure 2). The Fatik Plateau, dominated by Eocene limestone with pronounced calcification, contrasts with the younger, less karstified Oligocene-Miocene limestone of the Tektek Mountains (Özcan, Reference Özcan1974). These lithological differences influence pedogenesis and agricultural suitability across the region.
Soil parent material map of the study area.

Şanlıurfa’s climate is classified as warm temperate (Köppen-Geiger: Csa), characterized by wet winters and dry summers. Annual precipitation averages 459.3 mm, concentrated between November and March, while summers are hot and arid. Temperatures range from 5.6°C in winter to 32°C in midsummer (MGM, 2025). The long-term mean annual reference evapotranspiration is 1445.5 mm, with peak values of 10 mm/day in July (Kum, Reference Kum2022). These climatic conditions strongly affect both natural vegetation and agricultural cycles, which often rely on supplemental irrigation during the dry season.
Due to its lithological and climatic conditions, Şanlıurfa hosts a range of soil types with varied weathering and carbonate content (Inci et al., Reference Inci, Gündoğan, Bilgili and Ramazanoğlu2023). According to Soil Taxonomy (Soil Survey Staff, 2022), dominant classes include Typic Calcixerepts, Calcic Haploxerepts, Vertic Haploxerepts, Typic Haplotorrerts and Chromic Haplotorrerts. The World Reference Base (WRB) classifies these as Calcisols, Vertisols and Cambisols, reflecting features such as calcic, vertic and cambic horizons (IUSS Working Group WRB, 2022). Soils are typically alkaline, with moderate to high calcium carbonate, high clay content and generally low organic matter, attributed to sparse vegetation and aridity. This pedological variability makes soil fertility indicators like the SOC-to-clay ratio valuable for assessing spatial patterns of degradation and land potential.
Soil sampling and laboratory analysis
The study area covers 143.637 ha and includes three dominant land-use systems: dry-farmed croplands, pasturelands and pistachio orchards. A total of 104 sampling locations were selected across these land-use types. Instead of purposeful selection, a probability-based, spatial coverage sampling design was adopted. First, a 4 km × 4 km grid was placed over the entire study area to create a systematic set of candidate nodes. In the field, each node was accepted if it fell within a homogeneous polygon of the target land use class; when access or security constrains arose, points were shifted a maximum of 200 m to maintain the original grid while ensuring adequate and balanced representation across agricultural land, pistachio orchards and pasture layers. These minor field adjustments ensure balanced representation across land use types while maintaining the grid’s neutral spatial coverage (Brus and de Gruijter, Reference Brus and de Gruijter1997; Figure 1). The sampling design included 65 locations in pistachio orchards of varying maturity stages, 14 in pasturelands, 8 in active cotton fields and 4 in olive groves. Additionally, 13 locations were from fallow fields previously used for cereal-legume rotations (barley, wheat, lentils and alfalfa) but left uncultivated during the sampling period. A high-precision handheld GPS receiver (Magellan eXplorist series (710), San Dimas, CA, USA) was used to record the geographic coordinates for all sampling locations.
At each sampling location, a soil core (5.0 × 5.1 cm diameter) was taken from the 0–20 cm depth. Samples were air-dried at room temperature and then passed through a 2 mm sieve. The mass of the >2 mm coarse-fragment fraction was recorded and used to adjust bulk-density measurements. The remaining fine-earth fraction (<2 mm) was retained for laboratory analysis of physical and chemical properties. Clay content was determined via sedimentation-based hydrometer analysis (Bouyoucos, Reference Bouyoucos1962), while SOC content was measured through modified Walkley-Black wet oxidation (Nelson and Sommers, Reference Nelson and Sommers1982). Soil calcium carbonate (CaCO3) content was determined using the Scheibler calcimeter method, which is based on the volumetric measurement of released CO2 gas when carbonates react with hydrochloric acid (Loeppert and Suarez, Reference Loeppert, Suarez and Sparks1996). Soil pH was determined in a 1:2.5 soil/water suspension (Thomas, Reference Thomas, Sparks, Page, Helmke, Loeppert, Soltanpour, Tabatabai, Johnston and Sumner1996). Electrical conductivity (EC) was measured in the same suspension using a conductivity meter (Rhoades, Reference Rhoades and Sparks1996). To determine bulk density (BD), undisturbed soil cores were sampled from 0–20 cm layers and analysed using the volumetric ring method (Blake and Hartge, Reference Blake, Hardge and Klute1986).
In the present study, land use was categorized into cotton croplands, other major croplands (wheat, barley, lentil, corn), pasturelands and pistachio orchards. Cotton was separated from the other annual croplands because it represents a specialized production system in Şanlıurfa Province, with distinctive management and very extensive cultivation area. Importantly, all cotton production in the region is carried out under irrigation, whereas some of the other annual crops are grown under rainfed conditions. These differences in water management, cropping intensity and cultivation practices strongly influence soil properties, SOC dynamics and degradation risks, justifying the treatment of cotton croplands as a distinct category. Pistachio orchards were likewise separated because, as a perennial system, they differ fundamentally from annual croplands in terms of rooting depth, management inputs and long-term impacts on SOC and soil structure.
SOC stocks were calculated for the 0–20 cm layer, which is consistent with many pedometric and soil quality studies (Feeney et al., Reference Feeney, Bentley, De Rosa, Panagos, Emmett, Thomas and Robinson2024; De Rosa et al., Reference De Rosa, Ballabio, Lugato, Fasiolo, Jones and Panagos2024). This depth corresponds to the conventional topsoil definition used in soil monitoring programmes and represents the layer most affected by management practices and root turnover. While deeper layers can also store significant carbon, especially in Vertisols and Calcisols, the 0–20 cm interval provides a standardized basis for comparison across land-use systems. The SOC stock at each sampling location (t C/ha) was calculated following standard pedometric protocols by combining bulk density (BD; Mg/m3), sampling depth (m), SOC content (g/kg) and coarse-fragment (CF, dimensionless) (Eq. (1)). The term (1-CF) ensures that only the fine-earth (<2 mm) portion of the soil volume is counted, and A is the area conversion factor (104 m2 ha−1), which correctly scales the per-square-metre result up to a per-ha basis.
 $${\rm{SOC}}\;{\rm{Stock}} = {\rm{BD}}\;{\rm{x}}\;{\rm{Depth}}\;{\rm{x}}\;{\rm{SOC}}\;{\rm{x}}\;\left( {1 - {\rm{CF}}} \right)\;x\;A$$
Soil quality ındex (SQI)
For each soil sample, an overall SQI was computed by applying the Soil Management Assessment Framework (SMAF; Andrews et al., Reference Andrews, Karlen and Cambardella2004). The indicators selected include clay content, SOC, BD, pH and EC, which collectively reflect a soil’s capacity to store carbon, sustain productivity and deliver ecosystem services. Clay content is an important factor influencing soil structure and water retention capacity, while bulk density reflects soil compaction and porosity. Soil pH is an indicator of acidity or alkalinity, affecting nutrient availability, and EC provides information about soil salinity, which can impact plant growth. SOC content is a critical indicator of soil fertility and microbial activity, influencing soil structure and nutrient cycling.
The SMAF methodology calculates an overall soil quality score by assigning weights and normalizing values for each indicator. Each indicator value is transformed to a standardized score in the range 0-1 using published SMAF scoring functions (Andrews et al., Reference Andrews, Karlen and Cambardella2004). The shapes of these non-linear curves reflect the expected relationship between each property and soil function (e.g., SOC follows a ‘more-is-better’ curve, BD and EC are ‘less-is-better’, and pH and clay have optimal ranges). A score of 0 corresponds to a severely limiting or poor condition, whereas a score of 1 indicates an optimal (non-limiting) condition (Andrews et al., Reference Andrews, Karlen and Cambardella2004).
After scoring, the five indicator scores were averaged (using the simple arithmetic mean) to compute the overall SQI. This yields a single dimensionless index between 0 and 1, as anticipated by the SMAF procedure. In practice, a higher SQI denotes better soil quality (fewer limitations on soil function), while a lower value denotes poorer soil quality. For example, an SQI near 1 implies that all indicators are at or near their ideal values, whereas an SQI near 0 implies that one or more indicators are at highly limiting values (Bünemann et al., Reference Bünemann, Bongiorno, Bai, Creamer, De Deyn, De Goede and Brussaard2018). This integrated SQI thus provides a transparent measure of soil quality across the selected indicators.
Environmental covariates
Hans Jenny’s foundational model of pedogenesis (CLORPT) revolutionized soil science by introducing five interdependent state factors, climate, topography (relief), parent material, organisms and time, that govern soil formation (Jenny, Reference Jenny1941). To ensure spatial representativeness and balanced comparison among land-use classes, an equal-allocation, lattice-based sampling design was adopted. Since the basaltic substrate comprises a small portion of the study area, including ‘parent material’ as a covariate would have led to class imbalance and unstable estimates. Therefore, this factor was excluded in the current phase, with the potential for future inclusion through targeted sampling once broader coverage is available (Figure 2). These CLORPT factors collectively influence the spatial and temporal distribution of soil properties, particularly clay minerals and organic matter. Guided by Jenny’s framework, environmental covariates representing climate and topography were selected for inclusion in the modelling process.
To characterize topographic variation, a high-resolution Digital Elevation Model (DEM) was obtained from the ASTER Global Digital Elevation Model V003 (NASA, 2022), originally at 30×30 m resolution. The data were clipped and georeferenced to match the study area. Elevation values were extracted to produce elevation maps (Figure 3), and slope values were derived using SAGA GIS (Version 9.0) terrain analysis tools (Abakay et al., Reference Abakay, Kılıç, Günal and Kılıç2024), allowing detailed representation of landform heterogeneity.
Elevation (left) and slope (right) maps of the study area. The elevation values range from 475 m to 952 m, while the slope ratios range from 0% to36%.

Climate data were sourced from the CHELSA (Climatologies at High Resolution for the Earth’s Land Surface Areas) dataset (Karger et al., Reference Karger, Schmatz, Dettling and Zimmermann2020), which provides globally recognized 1 km2 resolution climate variables for ecological applications. Annual mean temperature and cumulative precipitation from 1980-2023 were extracted. The raster datasets were clipped to the study area using the Extract by Mask tool and averaged using ArcMap 10.6 (ESRI, 2018), yielding temporally consistent, spatially explicit climate layers essential for analysing environmental gradients and their relationship with soil properties (Figure 4).
Mean annual temperature (˚C) and mean annual cumulative precipitation (mm) maps for the study area.

Statistical analysis and modelling approach
Descriptive statistics, including measures of central tendency (mean, median) and variability (range, standard deviation, coefficient of variation), were calculated for SOC stock, clay content, SOC-to-clay ratios and SQI across land-use types and textural classes to summarize baseline soil characteristics and assess heterogeneity within the dataset.
The statistical framework for this study integrated both inferential statistics and ML-based predictive modelling approaches to evaluate spatial and anthropogenic drivers of SOC-to-clay ratios. One-way analysis of variance (ANOVA) was employed to assess differences in mean SOC-to-clay ratios across distinct land-use types (dry farming, pasturelands and pistachio orchards). Prior to ANOVA, Levene’s test confirmed significant heterogeneity of variances (p < 0.05), necessitating the use of the Games–Howell post-hoc procedure, a non-parametric method robust to unequal group variances and sample sizes, for pairwise comparisons between agricultural systems. The relationship between SOC-to-clay ratios and SQI was examined via Pearson’s correlation coefficient (r), with significance thresholds set at α = 0.05.
To predict spatial variability in SOC-to-clay ratios, four ML algorithms were implemented: Random Forest (RF), Gradient Boosting (GBDT), Classification and Regression Trees (CART) and Light Gradient-Boosting Machine (LightGBM). The details are explained in section 2.6.
Implementation of ML algorithms
This study employed a suite of non-linear ML regression models to predict the SOC-to-clay ratio using a multidimensional dataset encompassing eight variables: land use type obtained from field observations, soil textural classes, calcium carbonate content, EC, elevation, slope and long-term annual mean temperature and precipitation. Ordinary kriging was performed in ArcGIS 10.8 to spatially predict soil texture classes, calcium carbonate content and electrical conductivity at a 30 m resolution in order to produce the predicted SOC-to-clay ratio map (Isaaks and Srivastava, Reference Isaaks and Srivastava1989). To optimize model compatibility with heterogeneous data types, categorical variables, specifically land use type and soil textural classes, were converted into binary representations via the One-Hot Encoding technique, thereby facilitating effective integration of qualitative information into the computational framework. Concurrently, continuous variables (calcium carbonate (lime) content, EC, elevation, slope and climatic parameters) underwent standardization using the StandardScaler algorithm to mitigate scaling disparities inherent in features with divergent measurement units. These preprocessing protocols were implemented to ensure equitable feature contribution during model training, minimize potential bias from variable magnitude discrepancies and optimize algorithmic performance. The methodological approach aligns with established best practices in ML pipelines, prioritizing robustness and reproducibility in predictive analytics (Diaz-Gonzalez et al., Reference Diaz-Gonzalez, Vallejo, Vuelvas and Patiño2023; Parewai and Köppen, Reference Parewai and Köppen2025).
Following data preprocessing, the dataset was split into training (80%) and test (20%) subsets using scikit-learn’s train_test_split function (random state = 42). The SOC-to-clay was stratified into quartiles to ensure representative sampling across the full distribution of the target variable. Four non-linear regression algorithms (RF, GBDT, CART, LightGBM) were subsequently trained on the partitioned data, with model development exclusively utilizing the training subset and performance evaluation reserved for the independent test subset. These algorithms were selected for their demonstrated efficacy in DSM applications, where their capacity to model complex, non-linear pedogenic relationships, computational scalability and interpretability align with the demands of high-dimensional environmental datasets (Jia et al., Reference Jia, Zhang, Liang, Zhang, Jia and Zhao2024; Lu et al., Reference Lu, Tian and Wei2023). Overfitting was mitigated through k-fold cross-validation (k = 10) for the training dataset, and variable importance was quantified using permutation-based feature ranking.
To calculate the importance values of the covariates, the permutation feature importance (PFI) method, which is a model-independent method that quantitatively determines the dependence between each predictor and the target variable by measuring the increase in prediction error after randomly shuffling the values of that predictor, was used (Breiman, Reference Breiman2001; Fisher, Rudin, and Dominici, Reference Fisher, Rudin and Dominici2019). The procedure was applied as follows: (I) For each algorithm (RF, GBDT, CART, LightGBM), a final model was trained on the full 80% training subset using the hyperparameters selected during 10-fold cross-validation. The baseline prediction error RMSE_0 was recorded on the 20% test subset. (II) The prediction variable x j was permuted 50 times. In each iteration, the values of x j were randomly shuffled among the observations, while all other prediction variables remained unchanged; the model then produced new predictions and the corresponding RMSE_{j,k} values were recorded. (III) The increase in the mean error relative to the base value was calculated for each predictor (Eq. (2)). (IV) The obtained PFI values were averaged across 10 cross-validation folds to minimize sampling variance, then rescaled so that the importance of each model would total 100%. These rescaled scores represent the effect of co-variates on the prediction variance, meaning the importance of the variables.
 $$PF{I_{{x_{\rm{j}}}}} = \,{{{1 \over K}{\sum ^{{\rm{k}} = 1{\rm{k}}}}\left( {RMS{E_j},k{\rm{\;}} - {\rm{\;}}RMS{E^0}} \right)} \over {RMS{E^0}}} \times \!{\rm}100{\rm{\;}}\left( {\rm{\% }} \right)$$
In the equation, K=50 was selected (Pedregosa et al., Reference Pedregosa, Varoquaux, Gramfort, Michel, Thirion, Grisel, Blondel, Prettenhofer, Weiss, Dubourg, Vanderplas, Passos, Cournapeau, Brucher, Perrot and Duchesnay2011). This normalized percentage facilitates comparison between algorithms with different absolute error levels.
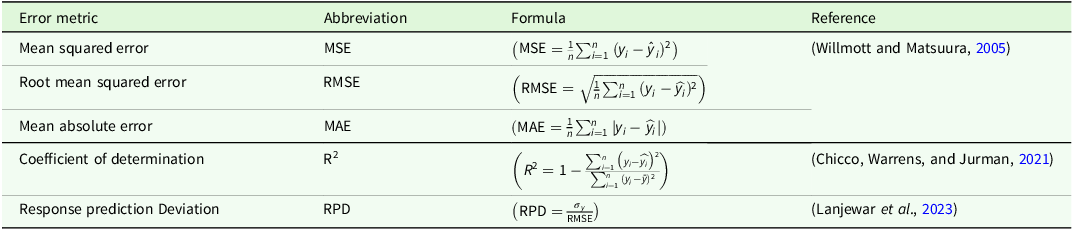
During the model evaluation phase, predictive performance was quantified using a multifaceted suite of statistical metrics: Mean Squared Error (MSE), Root Mean Squared Error (RMSE), Mean Absolute Error (MAE), coefficient of determination (R2) and Response Prediction Deviation (RPD) (Table 1). This rigorous multi-criteria framework, aligned with methodologies proposed by Trentin et al. (Reference Trentin, Ampatzidis, Lacerda and Shiratsuchi2024), ensured a robust evaluation of both model generalizability and fidelity to observed soil-clay dynamics. The algorithm demonstrating superior explanatory power, as evidenced by maximal R2 values across validation trials, was identified as the optimal candidate. The trained model derived from the training subset was applied to the full dataset to produce the final prediction map at 30 m resolution, thereby maximizing its utility for subsequent applications. This approach preserves model generalizability while minimizing the risk of overfitting and ensures reproducibility across different datasets.
Statistical error metrics for accuracy assessment in nonlinear regression-based machine learning models

 ${y_{\rm{i}}}:{\rm{\;}}Actual{\rm{\;}}\left( {measured} \right)values;$
 ${\hat y_{\rm{i}}}:{\rm{\;}}Predicted{\rm{\;}}values;{\rm{\;}}n:{\rm{\;}}Total{\rm{\;}}number{\rm{\;}}of{\rm{\;}}samples;{\rm{\;}}$
 $\hat y:{\rm{\;}}Mean{\rm{\;}}of{\rm{\;}}actual{\rm{\;}}values;$
 ${\sigma _\gamma }:{\rm{\;}}Standard{\rm{\;}}deviation{\rm{\;}}of{\rm{\;}}actual{\rm{\;}}values$
.
Results
Descriptive statistics of SOC-to-clay ratio, SOC stock, clay content and SQI
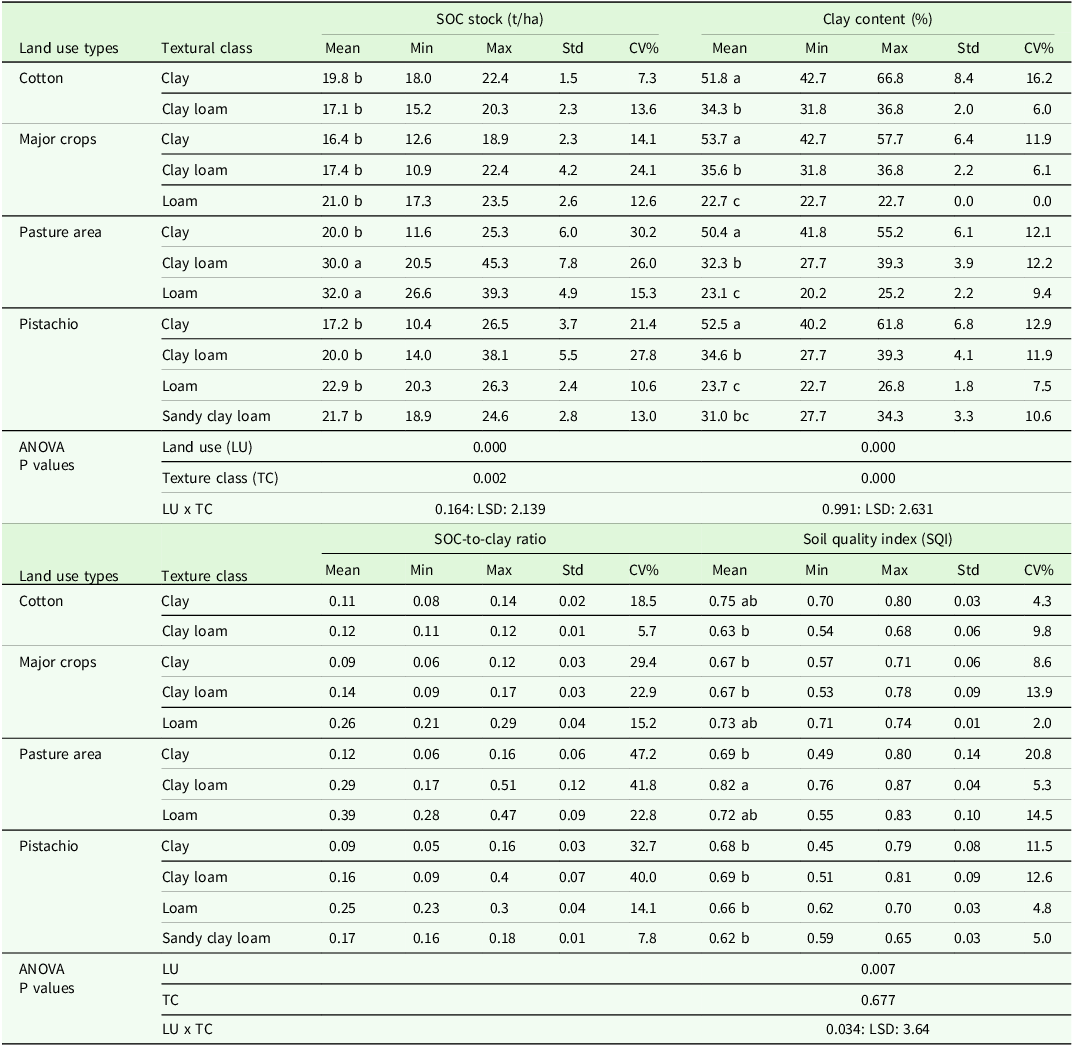
The SOC-to-clay ratio varied across land-use systems and texture classes, with differences in both mean values and variability (Table 2). For clay soils, mean SOC-to-clay ratios were 0.11 in cotton (CV = 18.5%), 0.09 in major crops (CV = 29.4%), 0.12 in pasturelands (CV = 47.2%) and 0.09 in pistachio orchards (CV = 32.7%). For clay loam soils, corresponding values were 0.12 in cotton (CV = 5.7%), 0.14 in major crops (CV = 22.9%), 0.29 in pasturelands (CV = 41.8%) and 0.16 in pistachio orchards (CV = 40.0%). These comparisons reveal that pasturelands consistently had the highest SOC-to-clay ratios in both clay and clay loam textures, although they also showed the greatest variability, whereas cotton croplands remained relatively uniform and low. Other texture classes, which were not present across all land uses, further illustrate the variability: loam soils exhibited high ratios in both pasture (0.39, CV = 22.8%) and pistachio (0.25, CV = 14.1%), while major crops showed intermediate values (0.26, CV = 15.2%). Pistachio orchards also included sandy clay loam soils (0.17, CV = 7.8%). These findings indicate that perennial systems such as pasturelands enhance SOC stabilization relative to annual croplands, particularly under clay and clay loam textures that were common to all land uses.
Descriptive statistics for soil organic carbon (SOC) stock, clay content, SOC-to-clay ratio and Soil Quality Index (SQI) values across different land use types and soil textural classes

SOC stock values significantly differed with texture and land use (p < 0.001), while SQI values significantly varied with land use (p < 0.001), but not with texture. In cotton cultivated soils, mean SOC stock was 19.8 t/ha in clay and 17.1 t/ha in clay loam, with corresponding SQI values of 0.75 and 0.63. Major crops showed the lowest SOC in clay soils (16.4 t/ha) and the highest in loam (21.0 t/ha), with SQI ranging from 0.67 in clay and clay loam to 0.73 in loam. Pasturelands exhibited elevated SOC stocks, particularly in loam (32.0 t/ha) and clay loam (30.0 t/ha), with the highest SQI observed in clay loam (0.82). Pistachio soils showed SOC stocks of 17.2 t/ha in clay, 20.0 t/ha in clay loam, 22.9 t/ha in loam and 21.7 t/ha in sandy clay loam, while SQI values remained relatively stable across textures, ranging from 0.62 to 0.69.
SOC-to-clay ratios differed significantly across land-use classes according to Welch’s ANOVA, F(3, 25.00) = 6.59, p = 0.00195. Games–Howell post hoc comparisons indicated that pasture exhibited higher SOC–clay ratios than cotton, pistachio and major crops (p < 0.05); most other pairwise contrasts were non-significant or marginal. In Figure 5a, bars denote group means and vertical lines the 95% confidence intervals; compact letter displays (CLD) above bars indicate statistically distinct groups. Full pairwise results are provided in Supplementary Table S1.
Soil organic carbon to clay (SOC:clay) ratio across (A) land-use types and (B) soil-texture classes. Bars show means; error bars denote 95 % confidence intervals. Due to heteroscedasticity, Welch’s analysis of variance with Games–Howell post-hoc test (α = 0.05) was applied; significant differences are indicated by compact letter display letters above bars. Dashed horizontal lines mark thresholds for ‘very good’ (≥ 1:8), ‘good’ (< 1:8 - ≥ 1:10) and ‘moderate’ (< 1:10 - ≥ 1:13) categories (Johannes et al., Reference Johannes, Matter, Schulin, Weisskopf, Baveye and Boivin2017).

SOC-to-clay ratios also differed significantly among texture classes (Welch’s ANOVA), F(3, 5.82) = 33.31, p = 0.00046. Games–Howell tests supported the ordering loam > clay loam > sandy clay loam > clay, with particularly strong differences for the loam-clay and loam-clay loam pairs (p < 0.05). Figure 5b reports group means with 95% confidence intervals, and CLD letters identify statistically homogeneous subsets. All pairwise comparisons are reported in Supplementary Table S1.
A moderate positive correlation (r = 0.48; p < 0.01) was observed between the SOC-to-clay ratio and the SQI, indicating a statistically significant relationship (Figs 6a and 6b). The trend in Figure 6c further supported this association, demonstrating a general positive trajectory between the SOC-to-clay ratio and SQI. According to logarithmic regression, each unit increase in the SOC-to-clay ratio was associated with an approximate 0.36-unit rise in SQI. The logarithmic regression fitted to the dataset (SQI = 0.0706 × ln(SOC-clay) + 0.9125; R2 = 0.30; p < 0.01) indicates that each unit increase in the natural logarithm of the SOC-to-clay ratio results in an average increase of 0.07 units in SQI. This relationship explains approximately 30% of the total variance, with the remaining variation attributed to additional factors such as land use history, management practices and site-specific characteristics. Figure 6c illustrates how these factors manifest across land use categories. Pasture samples cluster in the upper right corner of the graph, combining the highest SOC-to-clay ratios and the largest SQI values (approximately 0.75-0.90), while only a few degraded outliers are found in the SQI around 0.60. Pistachio orchards exhibit a broader distribution (SQI approximately 0.65–0.85) and slightly lower SOC-to-clay ratios, suggesting variable management intensity or orchard age. Cotton fields exhibit a narrow SQI band (approximately 0.75–0.85) despite moderate SOC-to-clay ratio values, suggesting that residue management or irrigation may balance low organic carbon stocks. Ultimately, these patterns confirm that the SOC-to-clay ratio has a nonlinear but moderate effect on soil quality.
Correlation matrix showing relationships among total carbon stocks (TCS), soil organic carbon to clay (SOC:clay) ratio and Soil Quality Index (SQI). Values represent Pearson correlation coefficients (r), with significance levels indicated (**p < 0.001). Values represent Pearson correlation coefficients (r), with significance levels indicated (**p < 0.001). (b) Regression analysis of the SQI versus SOC:clay ratio across land-use types.

Modelling approach: the influence of agricultural and climatic variables on the SOC-to-clay ratio
To better analyse the effects of land use types, soil textural classes, long-term annual temperature and precipitation, calcium carbonate content, soil salinity, slope and elevation on the SOC-to-clay ratio, nonlinear tree-based ML models were employed. The results (Figure 7) indicated that soil textural class emerged as the most important variable across all models, reinforcing the idea that textural properties significantly influence SOC dynamics. However, a more detailed analysis revealed variations in importance levels depending on the model used. Specifically, the loamy soil textural class was assigned an importance score of 36.3% in the RF model, 43.8% in the GBDT model and 44.9% in the CART model. These findings indicated the critical role of soil texture in determining SOC retention and stability and suggested that different tree-based models attributed slightly varying levels of importance to soil textural classes, reflecting differences in their algorithmic structures.
Feature importance heatmap across different machine learning models.

When the average importance scores of all soil textural classes were considered, similar values were observed across RF, GBDT and CART, with importance levels ranging between 64% and 65% (Figure 7). However, in LightGBM, this value was significantly lower, recorded at only 34%.
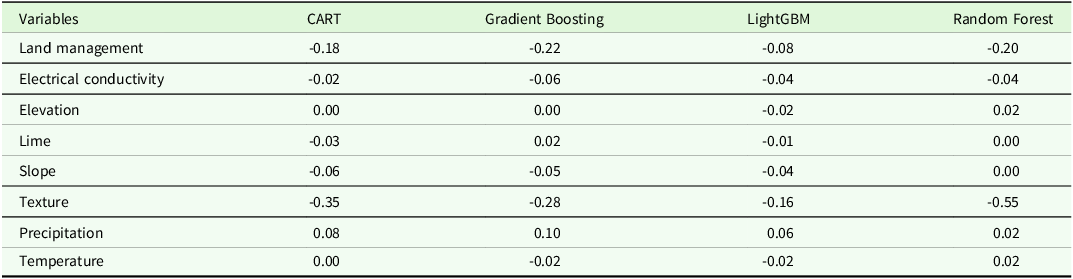
Table 3 summarizes model sensitivity to single-predictor removal for CART, GBDT, LightGBM and RF. Each cell reports ΔR2 (change in R2 after removing one predictor and refitting the model); negative values denote loss of predictive performance, positive values denote improvement. Across all four algorithms, removal of texture reduced test performance consistently (ΔR2 range -0.16 to -0.55). Removal of land management also decreased performance in every model (ΔR2 −0.08 to −0.22), but the magnitude of loss was smaller and more model-variable than for texture. Removals of EC and slope produced small performance losses, whereas lime, temperature and elevation had near-zero average effects. In contrast, removal of precipitation slightly increased test R2 slightly in all models (ΔR2 +0.02 to +0.10). Model-wise, the largest texture sensitivity occurred in RF (ΔR2 -0.55), followed by CART (−0.35), GBDT (-0.28) and LightGBM (−0.16).
Change in test R2 (ΔR2) after single-predictor removal (ablation) and model re-fitting for CART, gradient Boosting, LightGBM and random forest

Comparison of accuracy assessment of different ML models
The CART model exhibited significant overfitting, with an R2 of 1.00 on the training data compared to 0.67 on the test data (Table 4). Similarly, the GBDT model showed poor generalization (overfitting), yielding R2 values of 0.99 (training) and 0.58 (testing). In contrast, RF and LightGBM demonstrated more consistent performance, achieving R2 values of 0.92 (training) and 0.81 (testing) for RF, and 0.66 (training) and 0.65 (testing) for LightGBM. These findings suggested that both RF and LightGBM possessed superior generalization capabilities, with RF delivering robust predictive performance and LightGBM emerging as the second most effective model due to its balanced learning approach and reduced susceptibility to overfitting. RPD values indicated that the RF and LightGBM algorithms maintained reasonable consistency between training and test datasets. RF achieved the highest test RPD of 2.31, effectively capturing data variability at a ‘very good’ level (2.0–2.5). LightGBM, on the other hand, delivered predictions within the ‘good’ range (1.8–2.0) (Y. Yang et al., Reference Yang, Li, Sun, Liu and Cao2024).
Comparison of the model performance of different machine learning models for soil organic carbon-to-clay (SOC:clay) ratio

R2 – Coefficient of Determination; RMSE – Root Mean Square Error; MAE – Mean Absolute Error; MAPE – Mean Absolute Percentage Error; MSE – Mean Square Error; RPD – Ratio of Performance to Deviation; CART – Classification and Regression Tree; LightGBM – Light Gradient-Boosting Machine.
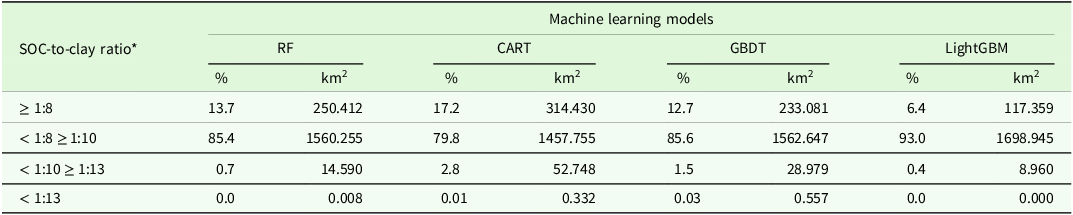
The spatial extents of the classes based on the SOC-to-clay ratio threshold values proposed by Johannes et al. (Reference Johannes, Matter, Schulin, Weisskopf, Baveye and Boivin2017) and the corresponding land degradation stages are presented in Table 5 and Figure 8. This classification was based on the predicted spatial distribution of the SOC-to-clay ratio as estimated by four distinct ML models employed in this study. A comparative analysis of model outputs revealed distinct spatial patterns in degradation stages. CART predicted the largest share of the study area as ‘very good’ (17.2%), followed by RF (13.7%), GBDT (12.7%) and LightGBM (6.4%). In contrast, RF allocated the greatest combined proportion of soils to the ‘good’ and ‘very good’ categories (99.1%), producing the most consistent classification of overall soil quality. Spatial distribution maps generated by the RF model (Figure 8a) exhibited smooth transitions between degradation classes and aligned well with known land-use and soil texture gradients, thereby supporting its performance in capturing realistic spatial patterns of SOC-to-clay ratios. By contrast, maps produced by CART and LightGBM showed more fragmented or less consistent spatial patterns, indicating reduced alignment with the underlying land features (Figure 8b-c).
Soil degradation classification and spatial distribution of model outputs across the study area based on the soil organic carbon to clay (SOC:clay) ratio

RF = Random Forest; CART = Classification and Regression Tree; GBDT = Gradient Boosting Decision Tree; LightGBM = Light Gradient Boosting Machine.* SOC-to-clay ratio threshold values: very good (≥1:8), good (<1:8-≥1:10), moderate (<1:10-≥1:13) and degraded (<1:13) (Johannes et al., Reference Johannes, Matter, Schulin, Weisskopf, Baveye and Boivin2017).
Soil carbon-to-clay ratio distributions obtained by (a) Random Forest (RF) Model, (b) Classification and Regression Tree (CART) Model, (c) Gradient Boosted Decision (GBD) Model and (d) Light Gradient Boosting Machine (LightGBM) Model. All maps were generated at a spatial resolution of 30 m.

Discussion
Dominance of soil texture in predictive modelling
This study evaluated the influence of key predictors, land use types, soil textural classes, soil properties and climatic variables (e.g., annual precipitation and temperature), on the prediction of the SOC-to-clay ratio. While all variables contributed heterogeneously to model performance, soil textural classes consistently dominated across ML algorithms (Figure 7). Feature importance analyses revealed that soil texture contributed 64–65% of explanatory power in the RF, CART and GBDT models, with LightGBM assigning a marginally lower value of 34%. In comparison, land use types demonstrated substantially reduced influence, with importance values fluctuating narrowly between 4% and 12% across all models. These patterns persisted under consistent variable inclusion conditions, with model performance metrics (R2 = 0.58–0.81) confirming predictive robustness. The RF model achieved the highest generalizability (R2 = 0.81) without signs of overfitting, solidifying its superiority in balancing accuracy and reliability. For example, in a variance-components analysis on New York soils, Amsili et al. (Reference Amsili, van Es and Schindelbeck2021) found that texture explained a large share of the variance in available water capacity (37.4%) and in the Protein/SOM ratio (37.5%), while cropping system explained higher fractions for labile biological indicators. Those findings and the findings of the current study suggest that texture can act as a dominant constraint on stabilization-linked metrics, whereas management more strongly influences labile pools; importantly, SOC:clay belongs to the former category (a stabilization-linked metric), which helps explain its stronger association with texture than with land use in the current dataset.
The single-predictor ablation pattern is consistent with the mechanistic understanding that texture constrains SOC stabilization via organo-mineral associations and carbon-saturation limits; accordingly, removing texture produced the largest and most consistent losses in predictive performance across algorithms (Hassink, Reference Hassink1997; Six et al., Reference Six, Conant, Paul and Paustian2002; Stewart et al., Reference Stewart, Paustian, Conant, Plante and Six2008). Land-use variables exerted a weaker, model-dependent effect, in line with reports that cropping system tends to more strongly modulate labile/biological indicators, whereas texture explains a larger share of stabilization-linked metrics (Amsili et al., Reference Amsili, van Es and Schindelbeck2021). Modest contributions from EC and slope are plausible in this context: salinity is broadly associated with lower SOC (El Hassani et al., Reference El Hassani, Masrour, Kourouma, Motte and Tavčar2024), while topographic influences can be attenuated where relief is limited or collinear with other covariates. The slight performance gains after removing precipitation further suggest redundancy of climate covariates in this dataset’s semi-arid envelope, echoing recent evaluations that emphasize the context-dependence of SOC:clay as an indicator and the need for region-specific benchmarking and/or corrections (Rabot et al., Reference Rabot, Saby, Martin, Barré, Chenu, Cousin, Arrouays, Angers and Bispo2024; Wenzel et al., Reference Wenzel, Golestanifard and Duboc2024). These results further illustrate that anthropogenic activities such as intensive tillage and monocropping destabilize soil carbon pools by disrupting texture-mediated stabilization mechanisms. Hence, management effects can exacerbate degradation even in texture-dominant systems.
The consistency across independent studies reinforced two critical insights: (1) soil texture operates as a master variable regulating SOC–clay interactions, likely through its control over physicochemical stabilization processes; and (2) predictive modelling of soil quality metrics benefits from prioritizing inherent soil properties over dynamic land use factors. Such hierarchical predictor importance highlighted the necessity of integrating pedogenic constraints into ML frameworks, particularly when modelling spatially heterogeneous systems like SOC dynamics.
These patterns indicate differences among algorithms in class distribution, with CART tending to overestimate the ‘very good’ category and RF providing a more balanced classification aligned with stronger generalization performance. Similar tendencies have been reported in DSM, where single-tree models (e.g., CART) can be sensitive to transitional classes yet less stable across scales (Taghizadeh-Mehrjardi et al., Reference Taghizadeh-Mehrjardi, Nabiollahi, Minasny and Triantafilis2015), whereas ensemble methods such as RF capture nonlinear interactions among soil, climate and topographic covariates and routinely outperform single-tree approaches while limiting overfitting (Wadoux et al., Reference Wadoux, Minasny and McBratney2020). LightGBM’s comparatively conservative allocation is consistent with its gradient-based optimization and built-in regularization aimed at reducing overestimation (Ke et al., Reference Ke, Meng, Finley, Wang, Chen, Ma, Ye and Liu2017). The results reveal that the choice of algorithm influences not only performance metrics (e.g., R2, RPD) but also the ecological narratives inferred from SOC-to-clay ratio maps, indicating the need for benchmarking against both statistical criteria and domain-specific plausibility.
By explicitly integrating climate and relief into the selection of DSM covariates (e.g., mean annual temperature, precipitation, slope), the current study enhanced both mechanistic rigour and spatial predictive reliability (Heung et al., Reference Heung, Saurette and Bulmer2021; Hounkpatin et al., Reference Hounkpatin, Stendahl, Lundblad and Karltun2021). Moreover, the findings echo evidence that biotic processes such as root exudation and microbial metabolite production accelerate primary mineral dissolution and secondary clay formation, reinforcing the coupled influence of climate and organisms on SOC and soil texture (Wiesmeier et al., Reference Wiesmeier, Urbanski, Hobley, Lang, von Lützow, Marin-Spiotta, Wesemael, Rabot, Ließ, Garcia-Franco, Wollschläger, Vogel and Kögel-Knabner2019).
Across land uses, pasturelands showed higher SOC-to-clay ratios than annual croplands and pistachio orchards, with most pasture pixels falling in the ‘very good’ class (Figure 8). This pattern accords with evidence that reduced disturbance and sustained biomass inputs in pasture systems enhance SOC retention relative to croplands-documented in field studies and syntheses (Sanchez, Reference Sanchez2019; Chahal et al., Reference Chahal, Amsili, Saurette, Bower, Gillespie, van Es and Van Eerd2024; Cuo et al., Reference Cuo, Xu, Yuan, Nie and Wei2025), supported by meta-analysis showing greater SOC stocks in pasture/forest than cropland (Mukherjee and Lal, Reference Mukherjee and Lal2014). In loamy contexts, cropland and pistachio areas clustered near the lower bound of the ‘very good’ bracket, whereas pasture occupied the upper end. The SOC-to-clay ratio-SQI correlation (Figure 6) indicates concordance between metrics; however, given partial input overlap, it should not be treated as independent validation. Consistent with these contrasts, all algorithms mapped pistachio- and crop-dominated zones predominantly as ‘moderate’ degradation (Figure 8). Indicator-specific caveats, including potential ratio inflation in low-clay soils, are addressed in Methodological and interpretative limitations.
Within the same texture classes, pasturelands exhibited markedly greater dispersion of SOC-to-clay ratios (CV = 47.2% in clay; 41.8% in clay loam) compared to croplands. This pattern is consistent with findings from southeastern Europe, where SOC–clay relationships were shown to be strongly influenced by environmental gradients such as altitude, climate, soil class, texture and pH (Paltineanu et al., Reference Paltineanu, Mocanu, Vizitiu, Domnariu and Dumitru2025b). Similar evidence from Romania indicated that nutrient and carbon stocks in grassland soils display high variability because of interactions between SOC, TN and soil fertility factors (Dumitru et al., Reference Dumitru, Paltineanu, Vizitiu and Domnariu2024). Broader assessments likewise confirm that grasslands and pastures are particularly prone to heterogeneity. Wenzel et al. (Reference Wenzel, Golestanifard and Duboc2024) reported large variations in SOC-to-clay ratios across agroecological regions even within the same texture classes, as SOC and clay are controlled by distinct ecological drivers. Prout et al. (Reference Prout, Shepherd, McGrath, Kirk, Hassall and Haefele2022) found that normalizing SOC by clay content amplifies variability among grassland soils, especially under semi-arid conditions. Barrena-González et al. (Reference Barrena-González, Antoneli, Contador and Fernández2024) further demonstrated that grazing intensity and patchy vegetation cover increase spatial variability of SOC stocks in pasture systems. Such variability, combined with uneven manure and urine deposition and microscale moisture differences (Galluzzi et al., Reference Galluzzi, Plaza, Priori, Giannetta and Zaccone2024), likely explains the relatively high coefficients of variation observed in pasture soils in the current study.
These results emphasized the dual utility and limitations of the SOC-to-clay ratio as a degradation indicator. While its strong association with established soil quality metrics supported its adoption, interpretation required rigorous contextualization of pedogenic factors, particularly textural variability and land management practices. The metric’s sensitivity to clay content variations indicated the necessity of complementary soil health assessments to mitigate misclassification risks in heterogeneous landscapes.
Texture-class contrasts and pedo-climatic context
The ANOVA revealed significant textural controls on SOC-to-clay ratios. Coarse-textured soils exhibited relatively higher SOC-to-clay ratios, while fine-textured soils showed systematically lower ratios. Among medium-textured classes, loamy and clay loam soils tended to exhibit intermediate to moderately elevated ratios, possibly due to balanced mineral protection and organic matter inputs, a pattern corroborated by sample-level SQI means derived from SMAF scoring functions (reported as unweighted averages across texture classes; see Supplementary Tables S1-S3 for details), with loamy soils exhibiting the highest mean SQI, followed by clay loam, clay and sandy clay loam soils. These findings aligned with mechanistic frameworks positing that moderate clay content optimizes the balance between organic carbon stabilization and nutrient retention. Although some studies report a clay–SQI relationship in surface soils (Choudhury and Mandal, Reference Choudhury and Mandal2021), our dataset did not show robust SQI dependence on texture; therefore, texture was interpreted primarily as a driver of SOC-stabilization metrics rather than of overall soil quality. Their work emphasized that clay content within optimal thresholds enhanced water holding capacity and cation exchange efficiency, key determinants of soil functionality. This aligned with the observed superiority of loamy textures in the current study, where intermediate clay levels likely prevented the onset of carbon saturation, a condition in heavy clays where mineral surfaces are already saturated with organic matter, limiting further SOC accumulation (Stewart et al., Reference Stewart, Paustian, Conant, Plante and Six2008). At the same time, loamy soils avoided the high leaching risks typical of sandy systems, thus offering a balanced environment for stable carbon retention. Complementary evidence emerged from comparative studies of soil orders. Qi et al. (Reference Qi, Darilek, Biao, YongCun, WeiXia and ZhiQuan2009) documented divergent SQI distributions in China’s Zhangjiagang region: loamy clay Anthrosols (southern region) exhibited lower soil quality (70% of areas with SQI = 0.25–0.50), whereas sandy loam Cambosols (northern region) demonstrated higher SQI values (80% of areas with SQI = 0.50–0.75). However, the classification of northern Cambosols as moderate-quality soils, despite their sandy loam textures often being considered favourable for root development and drainage, revealed functional limitations. Specifically, low SOC levels and elevated alkalinity undermined these textural benefits, reducing overall soil quality particularly in rice systems that demand both high water retention and balanced nutrient availability. Beyond these textural patterns, recent European assessments stress that SOC status and sequestration potential are region-specific and climate-dependent, and therefore soil health comparisons should be made within comparable pedo-climatic zones (Paltineanu et al., Reference Paltineanu, Domnariu, Mocanu and Dumitru2025a). Using a national network in Romania, Paltineanu et al. (Reference Paltineanu, Domnariu, Mocanu and Dumitru2025a) showed that SOC/clay and an observed-to-mean SOC metric together delineate reference SOC levels that decline from wetter to drier climates and argued explicitly that soil health should be benchmarked within regions sharing similar aridity and texture regimes. Building on a country-wide dataset in France, Rabot et al. (Reference Rabot, Saby, Martin, Barré, Chenu, Cousin, Arrouays, Angers and Bispo2024) found that SOC/clay is a poor predictor of bulk density and aggregate stability at national scale, is strongly modulated by soil pH and lacks explicit climate correction-hence its domain of applicability is limited outside contexts where clay-associated stabilization dominates. Complementary process evidence comes from climate chronosequences showing that, for a given soil age, climate governs SOC trajectories: in drier settings SOC stability increases with age and depth, while wetter climates accumulate more, but more labile, SOC, with 40% of stocks residing below 30 cm (Galluzzi et al., Reference Galluzzi, Plaza, Priori, Giannetta and Zaccone2024). Taken together, these studies support our interpretation that the semi-arid context of Şanlıurfa imposes climate constraints on SOC accumulation and stabilization that interact with texture, helping explain why texture dominates our models while the SOC-to-clay ratio explains only a modest share of SQI variance.
The loamy textural class demonstrated substantial predictive influence across ML models, with PFI analysis indicating relative contributions of 36.3% in the RF model, 43.8% in the GBDT model and 44.9% in the CART model. SOC-to-clay ratios in loamy soils spanned 0.21–0.47, and associated SOC stocks ranged from 17.32 to 39.33 t/ha, values that correspond to the thresholds for a ‘very good’ classification of soil quality. Soils with intermediate textural structure, characterized by balanced clay-sand fractions, exhibited moderate organic matter retention capacity, reflecting their transitional position between carbon-depleted sandy and carbon-rich clay-dominated systems (Sanchez-Navarro et al., Reference Sánchez-Navarro, Zornoza, Faz and Fernandez2019; J. Yang et al., Reference Yang, Li, Xu, Yu, Virk, Li, Yang and Kan2024). However, spatial and temporal variability in carbon dynamics is modulated by environmental drivers, including precipitation regimes, thermal gradients and land management intensity, which collectively regulate microbial activity and carbon stabilization pathways (Budak et al., Reference Budak, Günal, Kılıç, Çelik, Sırrı and Acir2023; X. Yang et al., Reference Yang, Bao, Li, Wang, Sun, Ma, Chen, Zou and Zhang2024). Within loamy soils, the ‘very good’ class spans a relatively wide ratio range, so detailed interpretation of threshold breadth is deferred to methodological and interpretative limitations.
The analysis indicated that soil textural classes were the dominant predictors of SOC-to-clay ratio. In contrast, SQI varied primarily by land use in this dataset. This finding indicated the necessity of incorporating non-linear ML algorithms, such as the RF and GBDT models employed here, to disentangle complex pedogenic interactions. Linear regression frameworks, as noted by Poeplau and Don (Reference Poeplau and Don2023), often failed to capture the hierarchical and interactive relationships governing soil quality metrics, a limitation that was starkly evident in the current dataset, where soil texture’s dominance emerged only through non-linear feature importance analyses. The superior predictive accuracy of the RF model (R2 = 0.81) over conventional linear approaches aligned with broader methodological advancements in DSM, where algorithms capable of modelling variable synergies (e.g., clay-content × precipitation interactions) are increasingly prioritized.
Loamy and clay-rich textures emerged as critical determinants of SOC-stabilization metrics (e.g., the SOC-to-clay ratio), likely due to their capacity to stabilize organic carbon through physicochemical interactions while maintaining favourable hydraulic properties (Hohenbrink et al., Reference Hohenbrink, Jackisch, Durner, Germer, Iden, Kreiselmeier, Leuther, Metzger, Naseri and Peters2023). However, the present findings contrasted with prior studies emphasizing very fine textures (e.g., high clay content) as optimal for carbon retention. For instance, Wang et al. (Reference Wang, Yu, Avirmed, Zhao, Sun, Liu and Bayanmunkh2025) demonstrated that clay-rich soils enhanced carbon stabilization via increased specific surface area and organo-mineral complexation, while the importance of clay and silt fractions in governing long-term carbon storage has long been recognized (Hassink, Reference Hassink1997; Six et al., Reference Six, Conant, Paul and Paustian2002) and has been reinforced by more recent evidence (Huang et al., Reference Huang, Wang, Yuan, Duan, Xia, Li and Zhao2025). These divergent conclusions may arise from methodological distinctions: whereas earlier work focuses on absolute carbon retention, the SOC-to-clay ratio metric inherently penalizes systems with disproportionately high clay content relative to SOC stocks. Specifically, ANOVA results revealed that fine-textured (clay) soils exhibited systematically lower SOC-to-clay ratios compared to coarser counterparts (e.g., sandy soils), despite their recognized capacity for organic matter stabilization (Maitry et al., Reference Maitry, Patil and Dubey2025). This suggests that while clay enhances carbon sequestration per unit mass, its dominance in the ratio’s denominator may obscure its protective role when SOC accumulation does not scale proportionally, a critical nuance for indicator interpretation. Moreover, recent work has shown that climate, particularly the aridity index, exerts a strong influence on SOC sequestration potential, with stocks decreasing from wetter to drier pedo-climatic regions as plant growth and root inputs diminish (Paltineanu et al., Reference Paltineanu, Domnariu, Mocanu and Dumitru2025a). Given semi-arid climate of the study area, the SOC-to-clay ratio may under-rate high-clay soils even when absolute SOC is substantial; accordingly, the index should be interpreted within its pedoclimatic context. Accordingly, interpretations of SOC-to-clay ratio in this semi-arid setting should be made within the appropriate pedoclimatic context. The moderate correlation observed between SOC-to-clay ratio and SQI shows the utility of the ratio as a degradation indicator while also revealing its partial scope. Incorporating biological indicators such as microbial activity or aggregate stability would provide a more holistic assessment of soil functionality.
Land use modulates soil carbon retention efficiency
Pasturelands, associated with minimal soil disturbance and sustained organic inputs, yielded the highest SOC-to-clay ratios, aligning with their documented resilience to degradation (Sanchez, Reference Sanchez2019; Chahal et al., Reference Chahal, Amsili, Saurette, Bower, Gillespie, van Es and Van Eerd2024). The elevated ratios in these systems (0.21–0.47) likely reflected synergistic effects of texture-mediated carbon stabilization and management practices that limit oxidative losses, as hypothesized by Cuo et al. (Reference Cuo, Xu, Yuan, Nie and Wei2025). This finding was further corroborated by Mukherjee and Lal (Reference Mukherjee and Lal2014), who demonstrated that SOC stock was more efficiently preserved in pasture and forest soils compared to croplands due to reduced decomposition rates, a mechanism consistent with the SQI disparities between pasture areas (mean SQI = 0.78) and intensively managed systems like pistachio fields and major croplands (mean SQI = 0.58–0.65). Conversely, intensively managed agricultural systems, particularly annual croplands and pistachio orchards, exhibited diminished ratios consistent with ‘moderate degradation’ thresholds, underscoring the destabilizing effects of tillage, monocropping and nutrient export on soil carbon pools. In practice, increasing residue return, integrating cover crops and adding organic amendments represent high-leverage options in loamy croplands where management can override otherwise favourable texture. These management-oriented insights offer direct relevance for policymaking, enabling texture-sensitive conservation strategies that align with sustainable land management frameworks such as the EU Soil Strategy 2030.
Methodological and interpretative limitations of the SO-to-clay ratio
The moderate correlation between SOC-to-clay ratio and SQI supported its utility as a degradation indicator, aligning with studies such as Mäkipää et al. (Reference Mäkipää, Menichetti, Martínez-García, Törmänen and Lehtonen2024), who identified the SOC-to-clay ratio as a robust proxy for soil health across diverse land-use systems. However, the low explanatory power observed in the current study (R2 = 0.26) underscores the limitations of relying solely on this metric. This discrepancy suggested that additional factors beyond SOC and clay content, such as microbial community structure, aggregate stability and redox dynamics, contribute to SQI variation. A comparison with recent European work indicates how depth and context re-order the hierarchy of drivers. In Swiss soils, Semeraro et al. (Reference Semeraro, Tuchschmid, Gobat, Rasmann and Le Bayon2025) re-analysed 28 profiles (256 horizons) over up to 37 years and found that surface horizons exhibited the clearest changes, with climate (warmer temperatures, more solar radiation, greater humidity) acting as a primary modulator of temporal shifts in physicochemical properties. By contrast, at 0–50 cm in Romania, Paltineanu et al. (Reference Paltineanu, Mocanu, Vizitiu, Domnariu and Dumitru2025b) reported land use as an essential determinant of SOC and TN stocks (forest > grassland > cropland, especially in mountain soils), alongside influential factors such as altitude, clay, pH and plant-available P and K; model performance reached R2 = 0.68/0.61/0.37 (forest/grassland/cropland) for multiple regression and 0.70/0.65/0.28 for Random Forest. Consistent with this, Dumitru et al. (Reference Dumitru, Paltineanu, Vizitiu and Domnariu2024) showed that available P and K stocks covary directly with SOC/TN and with temperature, clay, pH, base cations and inversely with altitude, slope and precipitation, with croplands showing the highest nutrient stocks. These findings consistent with Prout et al. (Reference Prout, Shepherd, McGrath, Kirk and Haefele2021) who reported that soil quality is governed by synergistic interactions among multiple physicochemical properties, including nutrient availability and pore architecture, which the SOC-to-clay ratio alone cannot encapsulate. Recent European assessments likewise question context-invariant applications of the SOC-to-clay ratio: in south-eastern Europe, Paltineanu et al. (Reference Paltineanu, Domnariu, Mocanu and Dumitru2025a, Reference Paltineanu, Mocanu, Vizitiu, Domnariu and Dumitru2025b) documented texture-related biases and poor alignment with independent soil quality indicators; Rabot et al. (Reference Rabot, Saby, Martin, Barré, Chenu, Cousin, Arrouays, Angers and Bispo2024) showed that climate and soil pH substantially modulate the ratio’s predictive value; and Feeney et al. (Reference Feeney, Bentley, De Rosa, Panagos, Emmett, Thomas and Robinson2024) emphasized climate as a dominant control on SOC stocks, often outweighing texture. These findings collectively suggest that the SOC-to-clay ratio, although useful as a first-order diagnostic, should not be applied in isolation. The current study contributes to this debate by testing the ratio under semi-arid Turkish conditions and by benchmarking it against a composite SQI, thereby demonstrating both the strengths and context-specific limitations of the index. Moving forward, refinement of the SOC:clay framework through the development of region-specific thresholds that incorporate climatic and management variability could improve its diagnostic precision and cross-regional applicability.
Two critical limitations warrant further emphasis. i.) Ratio Inflation in Low-Clay Soils: Reduced clay content artificially elevated SOC-to-clay ratios, potentially masking degradation in sandy systems, a limitation corroborated by Chahal et al. (Reference Chahal, Amsili, Saurette, Bower, Gillespie, van Es and Van Eerd2024). This contrasted with studies prioritizing absolute clay-associated carbon retention (Wang et al., Reference Wang, Yu, Avirmed, Zhao, Sun, Liu and Bayanmunkh2025; Huang et al., Reference Huang, Wang, Yuan, Duan, Xia, Li and Zhao2025), highlighting the need for complementary metrics (e.g., microbial activity indices) to disentangle textural biases. ii.) Threshold Ambiguity: The broad classification thresholds (e.g., ‘very good’ spanning 0.21-0.47) risked conflating functionally distinct soil states. For example, pasturelands with high clay content (41.8–55.2%) achieved superior ratios through balanced SOC–clay proportionality, whereas sandy systems may attain similar ratios through low clay denominators rather than robust carbon stocks. These constraints showed the necessity of integrating auxiliary metrics, such as microbial activity indices or aggregate stability, to contextualize ratio-based assessments.
Conclusion
This study confirms that the SOC:clay is a robust proxy for evaluating land degradation in semi-arid agricultural landscapes. Machine-learning algorithms effectively characterized the spatial variability of SOC:clay, emphasizing the controlling influence of soil texture and topography. The results emphasize the value of data-driven approaches for diagnosing soil degradation risks and informing sustainable land management in dryland systems. Future studies should integrate multi-temporal remote sensing and field observations to better capture SOC:clay dynamics under evolving climatic and management conditions.
Supplementary material
The supplementary material for this article can be found at https://doi.org/10.1017/S0021859625100415
Author contributions
MK conceived and designed the study, performed data curation, formal analysis, and visualization, and contributed to software development, validation and methodology. MK also prepared the original draft and participated in the review and editing of the manuscript. MÖ contributed to data curation, original draft preparation and manuscript review and editing. HG contributed to the conceptualization, formal analysis, investigation, methodology, supervision and validation of the study and participated in writing and editing the manuscript. YZ contributed to methodology, validation and writing of the original draft and its revision. MB contributed to validation, writing of the original draft and manuscript review and editing.
Funding statement
This research received no specific grant from any funding agency, commercial or not-for-profit sectors.
Competing interests
Authors declare no conflict of interest. All authors have read and agreed to the published version of the manuscript.
Ethical standards
Not applicable.
Declaration of generative AI in scientific writing
AI tools were used only to improve the English language and grammar of the manuscript; no part of the data analysis, interpretation, or scientific content was generated using AI.
Data availability statements
Data will be made available on request.