1. INTRODUCTION
There is an active literature in economics that studies the effect of culture on behavior. Cross-country studies are of little help as they do not allow disentangling the effect of culture and institutions. The leading approach is therefore to compare immigrants from different countries of origin in a common host country.Footnote 1 It has been shown that various outcomes in the host country are related to the corresponding measures in the home country, even when controlling for immigrants’ socio-economic characteristics.Footnote 2 The key identifying assumption is that all immigrants make their decisions in the same environment, and that all remaining differences can therefore be attributed to cultural influences from the countries of origin.
While sympathetic to the overall approach, this paper challenges the assumption of an identical environment. We argue that there are differences in the institutional rules and more generally in the way in which the host society reacts to the different immigrant groups. In the context of our empirical application for Germany, migrants from other EU countries have always had special rights compared to non-EU migrants, and a large share of migrants from Poland or the Soviet Union were entitled to German citizenship as so-called “ethnic Germans”. The possibility of return visits also differs systematically across countries of origin. Distance is one reason. In the period that we study (from the 1950s to the mid-1980s), political considerations played a role as well. For immigrants from Poland and the Soviet Union, migration to the West typically meant that a return to the home country was nearly impossible. These differences in distance and in the political circumstances matter for the epidemiological approach because the strength of the cultural effect likely increases in the number of return trips. These systematic and fairly time-persistent differences in the environment faced by different immigrant groups cannot be taken into account through controls at the individual level.
As a straightforward improvement, we propose to identify the cultural effect based on variation within countries of origin. We exploit the fact that immigrants have arrived in different years and were therefore exposed to different fertility environments prior to migration. In the second generation, longitudinal variation arises from different years of birth. Blau et al. (Reference Blau, Kahn, Liu and Papps2013) share the view that there may be a potential bias arising from unobserved factors at the country level. In their study of cultural influences on first- and second-generation immigrants in the United States, they try to mitigate these concerns through country-of-origin fixed effects, but find that there is insufficient variation left. Blau et al. therefore implement a within-strategy at a much broader regional level (e.g., grouping Europe, Canada, New Zealand, and Australia together). However, our discussion above (which centers on differences within European countries) suggests that the dummies for very broad geographical regions cannot filter out some of the key unobserved influences.
In our empirical application, we relate the total number of children of immigrant women in Germany to the fertility rates in the country of origin in the year of migration or, in the second generation, the year of birth. To study completed fertility, we restrict the sample to women aged 45 years and above.
Our estimations show that the cultural effect survives the more demanding specification, but that there is indeed a systematic and sizeable difference between the pooled and the within-country estimations. For the first generation, the within-country coefficient on home country fertility is only about half as large as the coefficient for the pooled model. In the second generation, the difference is even larger, but less precisely estimated. The results suggest that accounting for unobserved differences between immigrant groups is important in our present application, and possibly also in other studies based on the epidemiological approach.
We find a smaller cultural effect on fertility than another recent study for Germany that also includes country-of-origin fixed effects. According to the estimates of Cygan-Rehm (Reference Cygan-Rehm2014), a difference of one birth per woman in the fertility rate of the country of origin in the year of migration leads to an increase of nearly 0.5 children per woman among immigrants in Germany. In our study, the increase is only 0.15 children per woman, compared with a completed fertility rate of 2.2. The higher coefficient in the study by Cygan-Rehm is likely driven by the inclusion of all women regardless of their age at migration. Some of these women have spent almost their entire fertile years in the countries of origin, which means that the estimated coefficient reflects not only the influence of the culture, but also of the institutions of the home country. In our estimations, the sample is restricted to women who migrated before the age of 21 years.
The cultural effect is stronger (0.33) if home country influences are measured not by the total fertility rate (TFR) (i.e., by a snapshot in the year of migration), but by the completed fertility rates of people of the same age in the country of origin. This suggests that migrants are influenced by post-migration developments in their countries of origin. These contemporaneous influences have probably gained in importance with the advent of satellite TV, cheap air travel, and the Internet.
The cultural influence works mainly through the intensive margin and less through the probability of having children. It is strongest for women with low education and for women with a partner from the same country of origin. The last result should be interpreted as descriptive; however, because a stronger attachment to one’s origin will both affect partner choice and the degree to which own fertility choices are influenced by the fertility rates in the country of origin.
In the second generation, we find that the effect of home country TFR is reduced to 0.033. This is a very small (and statistically insignificant) effect compared to the average completed fertility of 1.9 children among second-generation immigrants in Germany. When cohort fertility rates (CFRs) are used as a proxy, the coefficient is 0.249 (significant at the 10% level). The comparison between the generations suggests that – conditional on socio-economic characteristic – the purely cultural effect on immigrant fertility diminishes considerably already in the second generation, a finding that is of interest in the current public policy debate about the long-run consequences of immigration.
2. CONTEXT AND DATA
2.1. Immigrants in Germany
Germany has been a country of large-scale immigration since the early 1960s. According to figures from the 2014 Mikrozensus, 16.4 million people (20.3% of the population) in Germany were born abroad or have at least one parent who was born abroad [Statistisches Bundesamt (2015a)]. Germany is among the countries with the lowest fertility rate worldwide, and the links between immigration and fertility are controversially discussed. While some see immigration as a remedy against the population decline resulting from below replacement fertility rates, others fear the political and cultural consequences of higher birth rates among immigrants and their descendants. The debate has resurfaced with the recent inflow of refugees to Germany.
Despite the importance of the question, there have been very few studies on the link between immigration and fertility in Germany. In particular, little is known about the second generation of immigrants. This is mainly due to data limitations. While household surveys contain the necessary information on the country of birth of respondents and their parents, sample sizes are too small for a detailed analysis of the second and, for some aspects, even the first generation of immigrants.
We use data from the 2008 and 2012 waves of the Mikrozensus, an annual survey carried out by the German Statistical Office on a representative 1% sample of German households. In addition to the large sample size, the Mikrozensus has the advantage that people are legally obliged to answer the core set of questions. Unit and item non-response is therefore less of an issue than in other surveys.
We distinguish between three generations of immigrants. The first generation comprises women who were born abroad and immigrated to Germany at the age of 15 years or above. “Generation 1.5” was also born abroad but immigrated before the age of 15 years. Distinguishing these two groups is common in the migration literature. Our choice of age 15 years follows Milewski (Reference Milewski2007) and Cygan-Rehm (Reference Cygan-Rehm2014), but our results still hold for cut-offs at the age of 6 years or 12 years. Finally, the second generation consists of women who were born in Germany as a foreigner or who were born with German nationality but have at least one parent who immigrated or who was born as a foreigner in Germany.
The identification of a person’s country of origin is based on a mix between country of birth and nationality. For members of the second generation who were born in Germany as a foreigner, the Mikrozensus uses nationality to define the origin (either current nationality or, if a person has acquired German nationality since, nationality prior to naturalization). The case is relatively frequent in Germany due to the German citizenship law which long favored the “right of the blood” (ius sanguinis) over the “right of the soil” (ius soli). Second-generation immigrants who had German nationality at birth are classified according to their parents’ origin. If only one parent is of immigrant background (i.e., is an immigrant or was born in Germany as a foreigner), then the country of origin of this parent is used. In the relatively rare cases in which the parents are from different backgrounds, the Mikrozensus bases its classification on the background of the father.Footnote 3
Our dependent variable is the total number of children a woman has given birth to.Footnote 4 This information is only available in the 2008 and 2012 waves of the Mikrozensus. All other waves only ask about the children living in the household at the time of the survey, a measure that is not well-suited for our purpose. Depending on the mother’s age, some children will likely have moved out, especially as we focus on respondents who have reached the end of their fertile years by the time of the survey. Relying on the number of children currently living in the household would therefore lead to a systematic underestimation of the completed fertility rate. The bias would be largest for mothers who had their children at a relatively young age.
Sample selection
To study completed fertility, we set the lower age limit to 45 years. Since our earliest country-level information is from 1950, we drop all women who were born before 1950 (second generation) or who migrated to Germany before that year (generations 1 and 1.5). We also drop observations with missing information on at least one of the variables used in our models. Finally, in our main specification, we include only those women from the first generation who arrived before the age of 21 years. Keeping all women regardless of their age at arrival would be inconsistent with the epidemiological approach because pre-migration differences will be the result of both the culture and the institutions of the countries of origin.Footnote 5 As a consequence of the two age restrictions, 1988 is the most recent year of arrival.
Including only woman aged 45 years and above results in a fairly small sample size in the second generation. We therefore combine generations 1.5 and generation 2 in most of our specifications. Women who arrived as children have little first-hand exposure to the fertility rates in the countries of origin. For them, the influence of the exposure effect is more likely to be indirect, via the cultural transmission by the parents, and hence akin to that of the second generation.
We include only migrants from countries of origin for which we have at least 10 observations in all of the specifications (including the robustness checks). These are Austria, Greece, Italy, Poland, Soviet Union, Turkey, Yugoslavia. This guarantees that differences between the specifications are not driven by changes in the set of countries.
Descriptive statistics
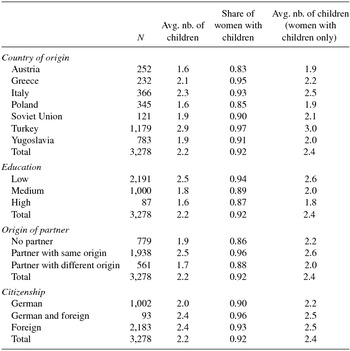
Our estimation sample consists of 3278 women from the first generation and 1,517 women from the second generation (including generation 1.5). Summary statistics by country of origin and generation are shown in the Appendix.
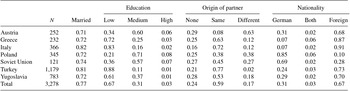
There is substantial variation in average completed fertility rates. In the first generation of immigrants (Table A.1), the average ranges between 1.6 (Austria) and 2.9 (Turkey) children per woman. Immigrant women who do not have German nationality have more children on average. Women who live with a partner from the same country of origin tend to have more children than those with a partner from a different origin (including Germany) and those who, at the time of the survey, do not live with a partner. There is a strong negative relationship between the level of education and completed fertility. At the same time, there are considerable differences in educational attainment by country of origin that need to be controlled for in the estimation (Table A.2).
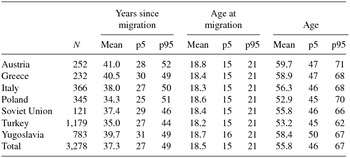
As Table A.3 shows, the first-generation women in our sample have lived in Germany for an average of 37 years. There is some variation across countries. Migrants from Greece, Italy, and Yugoslavia arrived earlier than migrants from Turkey, Poland, and the Soviet Union. Important for our empirical strategy, there is considerable variation in the time of arrival within countries of origin. For each country, there are some women who came in the 1950s and others who arrived only in the 1980s.
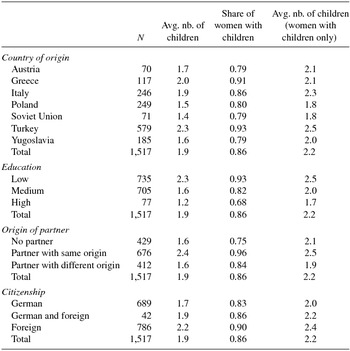
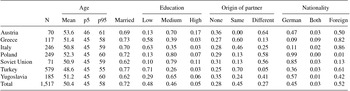
Table A.4 shows that completed fertility rates are lower in the second generation. Women of Turkish origin still have the highest fertility rates, but the mean number of children is only 2.3, well below the value of 2.9 in the first generation. The patterns with respect to marriage, origin of the partner, education, and citizenship persist in the second generation. Only 5% of second-generation migrants fall into the highest education category, and 52% do not have German nationality (Table A.5).
2.2. Country-Level Data
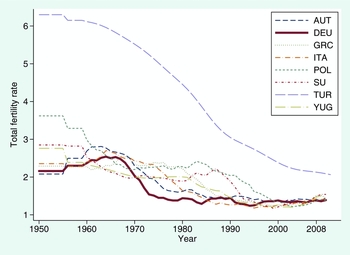
We merge the individual- and household-level data from the Mikrozensus with information at the country level from several data sources. TFRs are available on an annual basis from the World Bank’s database of World Development Indicators [World Bank (2012)]. The earliest TFR values are for 1960. We extend the data further back by adding observations for 1950–1955 and for 1955–1960 from the United Nations Population Division [United Nations Population Division (2011)]. Figure A.1 shows how fertility has evolved since 1950 for the countries of origin included in our estimations. There is considerable variation both across countries and, importantly for our strategy, across time. A majority of countries in most years exhibited higher TFRs than Germany. Turkey stands out for experiencing both by far the highest levels of TFR in the period considered and the largest absolute reduction, from about six children per woman in the 1950s and early 1960s down to about three children in the early 1990s.
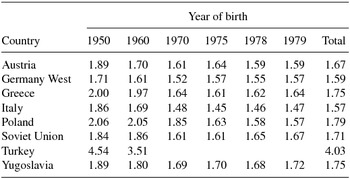
As noted in the introduction, the TFR may no longer be the most accurate proxy of country of origin influences for more recent immigrants. We therefore additionally test for a cultural effect using the completed CFRs recently compiled by Myrskylä et al. (Reference Myrskylä, Goldstein and Cheng2013). Table A.6 in the Appendix shows the CFRs for the countries in our sample. The completed fertility rates are for 2009 (hence very close to our survey years).Footnote 6 Unfortunately, Turkey, the most important country of origin, is not part of the compilation by Myrskylä et al. (Reference Myrskylä, Goldstein and Cheng2013), but we managed to construct values for two cohorts by going back to original Turkish sources.Footnote 7 As CFRs are available for only six (or, in the case of Turkey, two) birth cohorts, we linearly interpolate for the remaining years when merging these data with the Mikrozensus.
3. EMPIRICAL STRATEGY
The epidemiological approach studies the effect of culture on behavior by comparing immigrants from different countries in the same host country. This is an improvement over cross-country studies because the approach can hold the overall institutional setting constant.
However, the assumption that all immigrants truly face an identical environment is probably too strong. As noted in the introduction, we believe that there are systematic differences in the institutional rules and more generally in the way in which the host society reacts to the different groups of immigrants. These differences in the environment faced by different immigrant groups cannot be taken into account through controls at the individual level. They matter for fertility decisions because female immigrants who find it more difficult to integrate into the labor market of the host country will have lower opportunity costs of child-bearing, other things equal.
Including fixed effects for the countries of origin is a straightforward improvement over the existing approach. The identification then exploits variation within countries of origin over time. The simple strategy works well in the context of the epidemiological approach. The unobserved factors are either constant over time (geographic or linguistic distance) or at least nearly constant over the period that we study – until the late 1980s, return visits for immigrants from Poland and the Soviet Union were nearly impossible for political reasons, although there may have been some small changes over time. The same holds for the reaction of the host society toward the different groups of migrants, i.e., for the “cultural distance”. Turks were typically seen as “more foreign” than, say, Austrians or Italians, with little year-to-year variation.Footnote 8
The within-country approach is also useful in cases where individual controls are possible in principle, but not feasible in practice. For example, high-fertility countries may also be countries where women have low aspirations or low labor market abilities.Footnote 9 Education (especially in the first generation) may be an imperfect proxy for the latter, and aspirations are typically unobserved. The same holds for proficiency in the host country language and religion; these variables are part of surveys such as the German Socio-Economic Panel [cf. Cygan-Rehm (Reference Cygan-Rehm2014)], but are typically lacking in datasets that are large enough for a clean implementation of the epidemiological approach.
In the context of our application, most of the unobserved influences should lead to an upward bias in the estimate of the cultural effect. High-fertility countries tend to be poorer and more traditional; as noted, women from these countries are therefore likely to have lower labor market abilities and aspirations. They are also more likely to be from countries that are not in the European Union and for which the linguistic distance is greater. All these factors tend to decrease the opportunity cost of children.
However, there are also two countervailing effects that we can think of. First, culture changes slowly over time, so by relying exclusively on within-country variation, we remove not only the unwanted parts of the variation (i.e., unobserved cross-country differences that are correlated with differences in fertility norms), but also limit ourselves to only part of the relevant variation. Second, in the German context, the country of origin with the highest fertility (Turkey) is also among the countries with the greatest geographical distance among the countries considered in the estimation sample. Other things equal, the greater the distance, the fewer the number of return visits, which leads to a weaker effect of home country culture, especially at a time when communication was less easy and cheap than it is today. For these two reasons, the net effect of the bias is an empirical question.
We estimate the following model:
 $$\begin{eqnarray}
{\it Children_{icsty}} &=& \beta _0 + \mathbf {\beta _1^{\prime }x_{i}}\nonumber\\
&& +\, \beta _2{\it FertilityRate_{ct}} + f_c + f_s + f_y + \varepsilon _{\it icsty},
\end{eqnarray}$$
where Childrenicsty is the number of children (at the end of her fertile years) of woman i from country of origin c who arrived in Germany in year t and lives in federal state s in survey year y. Our regressor of interest is FertilityRatect , which measures the fertility rate in country c in the year of migration (generations 1 and 1.5) or the year of birth (generation 2).Footnote 10 Alternatively, we use the completed fertility rate of women from the same birth cohort in the country of origin.
fc is a country indicator that captures unobserved influences at the level of the country of origin that are constant across years of arrival. fs is an indicator for the federal state which attempts to control for the considerable regional differences in access to childcare. fy is a dummy variable for the year of the survey.
xi is a vector of control variables measured at the individual level. We control for age and age at migration as well as for the level of education which, as noted above, is strongly correlated both with fertility outcomes and with country of origin. In alternative specifications, we also control for whether the woman lives with a partner (and, if yes, whether the partner is from the same origin) as well as for marital status, nationality, labor market participation, and household income. We did not include these variables in our main specification as we believe that they are all, to varying degrees, jointly determined with a woman’s fertility choices. We acknowledge that the same is to some extent true for education (cf. the discussion in Chabé-Ferret, Reference Chabé-Ferret2013a). As a first step of the analysis, we therefore also report results from models with no controls at all.
ε icsty captures measurement error in the covariates as well as unobserved influences on the fertility outcome. We assume that the error terms are potentially correlated within cells formed by country of origin and year of arrival and uncorrelated otherwise. The model is estimated using Ordinary Least Squares. We also estimate probit models for the probability of having at least one child.
4. RESULTS
4.1. Main Results
Total fertility rates
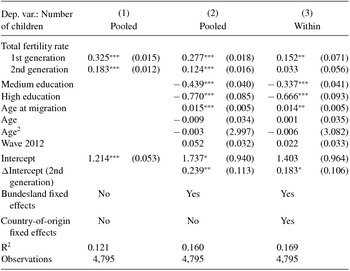
Table 1 reports our estimates for equation (1). We pool first-generation and second-generation immigrant women and allow the intercept and the coefficient on the TFR in the country of origin to differ.
Main specification – Country-of-origin fertility norms measured by TFR

Notes. Source: Mikrozensus 2008 and 2012. The dependent variable is the number of children a woman has given birth to. The models are estimated using Ordinary Least Squares. Standard errors (in parentheses) are clustered at the country-migration year level. Age2 rescaled by 100. Medium education: upper secondary degree or some professional training. High education: tertiary education. Omitted reference category: no degree or the equivalent of the German Hauptschule and Realschule. *p < 0.1, **p < 0.05, ***p < 0.01.
The first column reports the results for a model without any control variables. The higher the TFR in the country of origin, the higher the average completed fertility of immigrant women in Germany. In the first generation, a TFR difference of one child translates into a difference of about 0.33 children per woman. In the second generation, the cultural effect is weaker, with a coefficient of 0.18.
The coefficient on TFR is reduced when differences with respect to age, education, and age at migration are controlled for (column 2). The coefficients on education have the expected signs: Women with higher education tend to have fewer children. Reassuringly, age has no influence on the results, confirming that our cut-off at the age of 45 years allows us to measure completed fertility. Age at migration (within the age range of 15 years to 21 years) has a small positive effect on completed fertility. There is no difference in the intercept between the 2008 and 2012 waves of the survey.
Column (3) adds country of origin fixed effects to the model. The identification of the cultural effect is now based on differences in completed fertility between women from the same country of origin, but with different years of migration or years of birth. For the reasons outlined in Section 3, this is our preferred specification. We find that the cultural effect survives in this more demanding specification, but the coefficients on the TFR are considerably reduced in size. In the first generation, the cultural effect is equal to 0.15 children per woman, about half the size of the coefficient in the pooled OLS model but still significantly different from zero. In the second generation, the reduction is even bigger in percentage terms. The coefficient is only 0.03 now and statistically insignificant. The patterns with respect to age at migration and education survive in the within specification. In the case of education, the coefficients become slightly smaller.
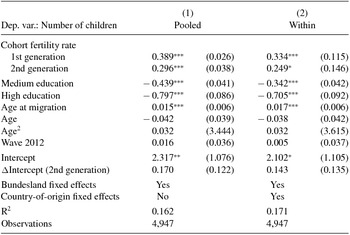
Cohort fertility rates
Table 2 shows that the within-strategy also leads to a smaller estimate of the cultural effect when home country influences are measured by the completed fertility rate of the corresponding birth cohort in the home country. In the within-model, the coefficient is 0.33 for the first generation and 0.25 for the second generation. Both coefficients are now significantly different from zero. The results for education and age at migration are almost unchanged.
Main specification – Country-of-origin fertility norms measured by CFR

Notes. Source: Mikrozensus 2008 and 2012. The dependent variable is the number of children a woman has given birth to. The models are estimated using Ordinary Least Squares. Standard errors (in parentheses) are clustered at the country-migration year level. Age2 rescaled by 100. Medium education: upper secondary degree or some professional training. High education: tertiary education. Omitted reference category: no degree or the equivalent of the German Hauptschule and Realschule. *p < 0.1, **p < 0.05, ***p < 0.01.
Whether TFRs or CFRs are the better measure probably depends on the decade in which the immigrants arrived. TFR is the more relevant measure for the earlier years: Satellite television was not yet available, the Internet did not exist, and people rarely if ever made return trips to their countries of origin. Present-day migrants find it much easier to keep in touch with developments in their countries of origin. This should make CFRs the more relevant measure today. For the years of migration in our analysis (1950s to mid-1980s), the truth is probably somewhere in-between. As our focus in this paper is on the importance of the within-strategy, we do not investigate this question further here, but rather leave it to future research. For our present purpose, the key message to take away from Table 2 is that when the cultural influence is measured through CFRs instead of TFRs, the main conclusions survive: The coefficients are smaller in the within-country specification than in the pooled model, and they are smaller in the second generation than in the first.
Comparison with existing studies
How do these results compare with existing studies? Fernández and Fogli (Reference Fernández and Fogli2009) estimate a cultural effect on fertility of about 0.2 children per women for second-generation immigrant women in the United States.Footnote 11 This is reasonably close to our own estimate of 0.12 in the pooled model. Our within-country estimates suggest that the true effect may be somewhat weaker, however. In other words, an important part of the difference in completed fertility across immigrant groups may not result from different fertility levels in the countries of origin, but from other time-constant influences that are specific to the group and that reduce the opportunity cost of children.Footnote 12 However, our within-country approach may exacerbate measurement error and may therefore bias the estimate downwards. Moreover, these results are derived for a particular country and period; the size and the sign of the bias (if any) may be different in other applications, and the same is true for the strength of the cultural effect.
Blau et al. (Reference Blau, Kahn and Papps2011) find pooled OLS effects for second-generation women that are fairly close to our within-country-of-origin estimate (0.046 for the country of the mother and 0.009 for the country of the father). Both Fernández and Fogli (Reference Fernández and Fogli2009) and Blau et al. (Reference Blau, Kahn and Papps2011) include in their estimation samples women who have not yet completed their fertile phase, so the results also reflect cultural influences on the timing of births.
The study that is most comparable to ours is by Cygan-Rehm (Reference Cygan-Rehm2014), who also uses data for Germany. In her estimations, the cultural effect of home country TFR on the completed fertility of first-generation immigrant women is around 0.5 children per woman in both the pooled OLS model and in a specification including country-of-origin dummies. We believe that the higher coefficient in the study by Cygan-Rehm is mainly driven by the inclusion of all women regardless of their age at migration. Some of these women have spent almost their entire fertile years in the countries-of-origin, which means that the estimated coefficient reflects not only the influence of the culture, but also of the institutions of the home country.
Magnitude of the effects
To put our estimates into perspective, first-generation immigrant women in our sample have 2.2 children on average; in the second generation, the mean number of children is 1.9. The TFR by country of origin and year of arrival varies between 1.25 and 6.10 for the countries in our sample, with a standard deviation close to 1. According to the point estimates from the within-country models in the last column of Table 1, a change in the TFR of one child per woman leads to an increase in completed fertility of 7% (= 0.15/2.2) in the first generation and 2% (= 0.033/1.9) in the second generation.
Completed CFR in the countries of origin vary between 1.45 and 4.54 children per woman, with a sample standard deviation of 0.53 (cf. Table A.6). Based on the estimation results in Table 2, the model predicts that a one standard deviation change in the CFR increases completed fertility of immigrant women in Germany by about 8% in the first generation (= (0.53 × 0.334)/2.2) and by about 7% in the second generation.
These results suggest that, in absolute terms, the cultural influence on immigrant fertility diminishes considerably already in the second generation – in fact, in the within-model using the TFR, the coefficient is no longer statistically significant. When measured in percentage terms, the picture is less clear-cut. Here, the TFR model again suggests a much smaller influence than in the first generation, while in the CFR model the influence is nearly the same in both generations.Footnote 13
4.2. Effect Heterogeneity
Education
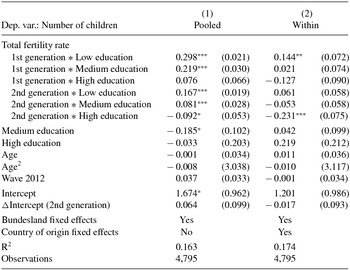
That the cultural effect is not reduced even more in the second generation may be due to the low level of educational attainment among second-generation immigrants in Germany. As noted above, only 5% of them fall into the highest education category; in the first generation, the share is even lower (3%).Footnote 14 Our estimates show that country-of-origin fertility increases own fertility most strongly for women in the lowest education category (Table A.7). In the medium category, the influence is already reduced (and statistically insignificant in the within-model), while we even find some evidence of a negative relationship for the few second-generation women who fall into the highest education category. Adsera and Ferrer (Reference Adsera and Ferrer2014) also find that the effect of age at migration on fertility assimilation in Canada is strongest for women with low education. A possible explanation for the pattern is that other things equal, better educated people should find it easier to integrate into the host country society, which is why home country culture matters less for them.
Origin of the partner
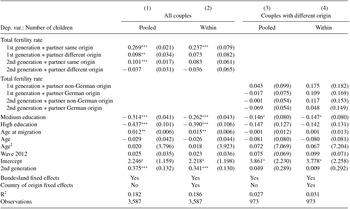
As Table A.8 shows, the cultural effect on fertility is stronger for women with a partner from the same country of origin.Footnote 15 This is consistent with a mutual reinforcement of cultural beliefs. The result does not necessarily reflect a causal effect; however, as women who are particularly attached to their cultural background are more likely to live with a partner from the same country of origin. When we further restrict the sample to those women with a partner from a different origin, we find that a partner with German origin reduces the coefficient on TFR more strongly than a partner from a different foreign background. However, the sample size is much smaller in this case and the coefficients are not significantly different from each other.
Neighborhood effects
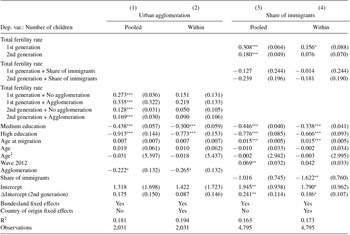
Following Fernández and Fogli (Reference Fernández and Fogli2009), we study whether the cultural effect is stronger for women who live in areas where there are many other immigrants. As we work with only a 1% sample of the population, the sample is too small to estimate shares of immigrants (let alone of immigrants from the same country of origin) in actual neighborhoods. We therefore calculate the overall immigrant share at the level of Germany’s 97 regional planning units (with an average population size of about 850,000). The interaction of this share with the TFR variable is found to be statistically insignificant (Table A.9). We do find that the TFR effect is bigger for immigrants who live in the 12 largest metropolitan areas, but the interaction is statistically significant only in the pooled OLS model. In any case, both measures are fairly imprecise proxies for true neighborhood influences, so these results should be interpreted with caution.
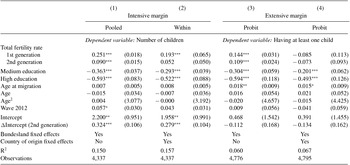
4.3. Extensive vs. Intensive Margin
When we decompose the fertility outcome into an extensive and intensive margin, we find that home country TFR is strongly associated with the number of children in the subsample of women who gave birth to at least one child (Table A.10). On the extensive margin, the results are less clear-cut. When using the entire variation across countries and across time, home country TFR is positively related to the probability of having at least one child. However, the coefficient becomes statistically insignificant when only the within-country variation is used.
The weaker effect on the extensive margin is plausible as the percentage of women with children is high among immigrant women from the countries considered here and varies less across time than the average number of children. Moreover, childlessness is not necessarily a voluntary phenomenon. Using data from the SOEP, Milewski (Reference Milewski2007, 887) also finds that “[t]he country of origin does not explain much of the first-birth behavior of immigrants in West Germany”. Likewise, Chabé-Ferret (Reference Chabé-Ferret2013a) shows that the TFR in the country of origin matters most for higher order births in France. He also proposes a plausible mechanism to explain this. The cost of complying with a norm about the extensive margin of fertility is larger than for higher parities, for which a large part of the child-related costs is already sunk.
However, whether fertility norms concerning the extensive margin can actually be measured using the TFR or, in our case, the TFR and the CFR, is open to discussion. Baudin et al. (Reference Baudin, de la Croix and Gobbi2015) argue that the relationship between the total number of children and the share of childless women may be non-monotonic, so using the TFR or the CFR in a model to explain childlessness among immigrant women may be a mis-specification.Footnote 16
4.4. Robustness Checks
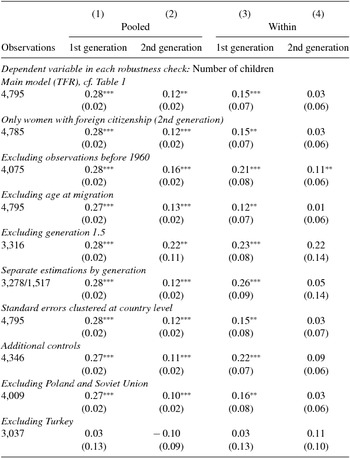
Our two main results – pooled OLS overestimates the cultural effect, and the latter becomes weaker in the second generation – are robust to various alternative specifications (Table 3). We excluded generation 1.5 from the model and allowed all coefficients to differ between the generations (now again with generation 1.5 included). We also estimated the model without controlling for age at migration, clustered the standard errors at the country level (as opposed to country-year cells), estimated a model without second-generation women with German nationality, and dropped women who arrived or were born before 1960.Footnote 17 The only noteworthy changes in these robustness checks are that (1) in the separate estimation for the first generation, the within-country estimate is closer to (but still smaller than) the pooled OLS coefficient, and that (2) excluding generation 1.5 results in a very small sample and a highly imprecise within-country estimate for the second generation.
Summary of robustness checks

Notes. Source: Mikrozensus 2008 and 2012. The dependent variable is the number of children a woman has given birth to. The models are estimated using Ordinary Least Squares. Standard errors (in parentheses) are clustered at the country-migration year level. *p < 0.1, **p < 0.05, ***p < 0.01.
Our main specification contains only a small set of control variables. This is partly due to the nature of the data set: Participation in the Mikrozensus is mandatory, but the number of questions is relatively limited. A second reason for not including more variables is that many individual or household variables lie on the causal pathway from country-of-origin culture to fertility outcomes. Since we are interested in the total effect of culture, we choose not to condition on them in our main specification. As a robustness check, we nevertheless estimated the model with controls for marital status, labor force participation, foreign nationality, and household income, as well as GDP per capita in the country of origin.Footnote 18 Pooled and within-estimates are closer together in this model, but the within-estimate is still smaller (cf. the row “Additional Controls” in Table 3). The result that the coefficients are smaller in the second generation is also preserved.
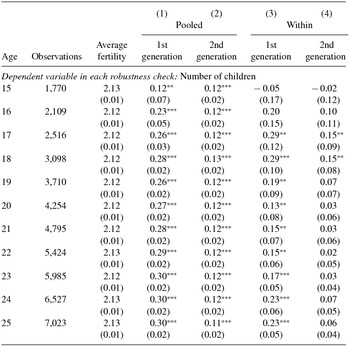
In our main specification, we include only first-generation women who arrived until the age of 21 years. As a robustness check, we vary the upper age limit from 15 years to 25 years, the limit chosen by Adsera and Ferrer (Reference Adsera and Ferrer2014). The results are reported in Table A.11. We find that the two main results are preserved and that the age limit (at least within this range) generally does not make much of a difference, with the exception perhaps of migrants who arrived at a very young age (15–18 years). These are probably a special group and most likely arrived with their parents, given that the age of majority was 21 years for most countries of origin in the years that we study. At the upper end of the age range, the coefficient on the TFR increases slightly. These women spent more years in the country of origin and may have had their first child there. The identification of a purely cultural effect is less clear in these cases as fertility choices prior to migration reflect both the culture and the institutions of the home country.
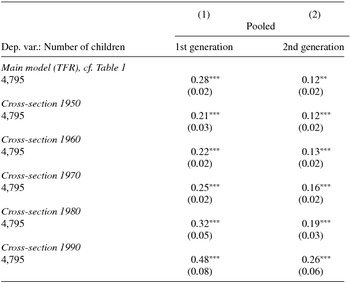
For comparison with earlier studies which use cross-sectional variation only (e.g., Fernández and Fogli, Reference Fernández and Fogli2006, Reference Fernández and Fogli2009; Gevrek et al., Reference Gevrek, Gevrek and Gupta2013), we re-estimate equation (1) using the TFR from single years, irrespective of the year of migration. The results for the cross-sectional models are summarized in Table A.12 and are relatively close to the pooled models when single TFR values from 1950, 1960, 1970, or 1980 are used. Only when the value from 1990 is used are the coefficients much bigger than in the baseline specification. This is due to the relatively small TFR differences across countries in later years, which are then used to explain fertility differences among immigrant groups that arrived earlier, at a time when fertility differences were much greater.
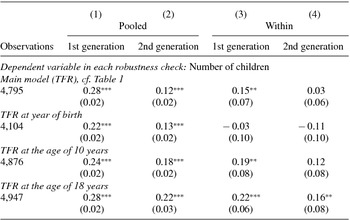
In another robustness check, we returned to the familiar pooled and within specifications, but measured the TFR at different years. While in the main specification, we assign first-generation immigrants the TFR in the year of migration and second-generation immigrants the TFR in their year of birth (as we do not observe the year in which their parents immigrated), we experimented with measuring the TFR at birth for both generations, and additionally estimated models in which the TFR is measured at age 10 years or age 18 years. As Table A.13 shows, the two main conclusions (the coefficient on TFR is larger in the pooled model than in the within-model, and it is larger for the first than for the second generation) survive in these specifications.
The only alternative specification in which the results do differ markedly is the model in which we omit immigrant women of Turkish origin (last row of Table 3).Footnote 19 We find almost no TFR effect on immigrant fertility in this case. In our view, it is not surprising that the size of the pooled OLS coefficient is reduced. After all, many of the factors that bias the cultural effect upwards in the pooled OLS estimation are particularly pronounced in Turkey. More importantly, in our sample, Turkey is the country that exhibits by far the most variation in fertility rates over time (cf. Figure A.1 in the Appendix). By excluding it from the sample, there may not be enough variation left for identifying the cultural effect in the within-model.
5. CONCLUSION
In this paper, we argue that the conventional strategy in the epidemiological approach of identifying a cultural effect using variation across countries of origin may be biased because the assumption that all immigrants make their choices in an identical environment in the host country is unlikely to hold true, even when controlling for individual characteristics. In our application based on data from the 2008 and 2012 waves of the Mikrozensus, a representative 1% sample of the German population, there is a substantial upward bias in the pooled OLS estimate. A plausible mechanism behind this bias is that women from high fertility countries face more adverse conditions on the German labor market for various reasons (EU vs. non-EU, language, more or less welcoming reception by natives). Part of the higher fertility that we observe for immigrants from these countries is therefore not a true cultural effect, but the result of lower opportunity costs of children. In our particular application, another reason is related to politics. In the period that we study, immigrants from Poland and the Soviet Union found it almost impossible to return to their countries, which means that, other things equal, the cultural influence should have been weaker for them. These are two countries with a low-fertility rate, which is another reason for an upward bias in the pooled OLS estimates. Since these unobserved influences are fairly constant over time, a simple way to eliminate the bias is to exploit only the variation within countries of origin, resulting from people who arrived or, in the second generation, were born in different years. Of course, our conclusions about the sign and the size of the bias hold only for our particular application (fertility of immigrants in Germany). Future research will show if it can be generalized. It should also be noted that the cultural effect still survives in the more demanding within-country specification, even though a large part of the cultural differences may indeed be fairly time-invariant, which means that the within-country model may remove a substantial part of the relevant variation.
In addition to these methodological points, we also make a contribution to the public policy debate by showing that in both pooled OLS and within-country models, the cultural effect is already much reduced in the second generation. This suggests that parents vertically transmit the culture of their country of origin, but that horizontal and oblique influences in the host country play a role as well (see the survey by Bisin and Verdier, Reference Bisin, Verdier, Benhabib, Jackson and Bisin2011). According to our results, there is little empirical evidence for the claim that cultural differences in fertility norms will persist forever and that immigration will lead to a dramatic change in the ethnic composition of the German population. Yet by the same token, the results suggest that low fertility rates and their demographic consequences cannot be addressed through immigration alone.
A. APPENDIX
A.1. Summary Statistics
A.1.1. First generation
First generation – Number of children

First generation – Socio-economic characteristics

First generation – Arrival history

A.1.2. Second generation
Second generation – Number of children

Second generation – Control variables

A.1.3. Country-level variables
Completed cohort fertility rates

Total fertility rates (TFR).

A.2. Additional Estimation Results
Interaction with education

Interaction with the origin of the partner

Peer effects

Intensive and extensive margin

Robustness: Main results with varying age limits

Robustness: Cross-sectional variation

Robustness: Different reference years for TFR