
Introduction
HANS Morgenthau famously wrote, “No man who has taken such a stand before the attentive eyes and ears of the world can in full public view agree to a compromise without looking like a fool and a knave.” Footnote 1 Yet even as he noted the risks of public compromise—when a state or leader agrees to concessions that are less than they previously threatened or promised not to accept, but are short of backing down entirely—Morgenthau recognized that in the age of “new” diplomacy, compromise is essential to the maintenance of peace and order in international relations (ir).Footnote 2 Seventy years after the publication of Politics Among Nations, politicians and scholars continue to fear the effects of public compromises. Scholars have written extensively on the costs of inconsistent rhetoric and the effects of changing policies on public opinion,Footnote 3 and Shiping Tang notes that politicians succumb to a “cult of reputation” that shapes their views on negotiations “so they are even more reluctant to compromise.” Footnote 4 Although research shows that leaders are generally punished for acting inconsistently,Footnote 5 existing work fails to examine how public opinion reacts to compromises and the consequences of those reactions for international negotiations. Because theories of political positioning,Footnote 6 diplomacy,Footnote 7 and international bargainingFootnote 8 rely on assumptions about how domestic public opinion responds to leaders’ strategies, scholarship should now directly examine how the public thinks about compromise in international negotiations.
Rather than assuming that the public opposes compromise, this article systematically examines public attitudes toward compromise and makes three main contributions. First, I show that compromises can generate broad support from domestic audiences, reducing the likelihood that a leader would become locked-in to a threat or promise. Second, I show that leaders can enhance public support when conducting international negotiations by exercising proposal power, whereby they are perceived as initiating a compromise as opposed to accepting one. Third, I show that the composition of the leaders’ audiences shapes leaders’ incentives, with liberal constituents being more supportive of compromise than conservatives and conservatives being more discerning in their response to proposal power. In survey experiments fielded in the United States, conservatives only respond favorably to Republican leaders’ proposals, whereas liberals respond favorably when either a Democrat or a Republican exercises proposal power.
The primary implications of domestic attitudes toward compromise and reputation costs for international diplomacy and bargaining are twofold. First, as Morgenthau pointed out, international diplomacy requires compromise, and subjecting international negotiations to the whim of public opinion jeopardizes international peace and security by undermining the potential for compromise.Footnote 9 The importance of compromise for peace and security is emphasized by Paul Huth and Russell Leng, who find that reciprocating firm-but-flexible strategies with which leaders pursue diplomatic compromises are the most effective bargaining strategies for deterrence and avoiding war.Footnote 10 Pursuing a compromise strategy can also provide the time needed to break a diplomatic stalemateFootnote 11 and may be viewed as an act of restraint, which can lead to a downward spiral of conflict and to more peaceful outcomes.Footnote 12 For such compromise strategies to succeed, leaders must have the capacity to give ground in negotiations, and therefore they need to believe that the costs of compromising and the likelihood of their domestic constituents retaliating against them are relatively small or nonexistent.
Second, domestic constraints can serve a useful role in international bargaining by signaling information and acting as a credible signal of leaders’ resolve.Footnote 13 Yet even though domestic constraints can enhance bargaining leverage at times, they can also reduce the potential winset, or bargaining range, of agreements, which can undermine international cooperation and prospects for peace.Footnote 14 An examination of how the domestic public assesses international compromises is therefore a critical component to understanding how domestic win-sets are shaped and when leaders’ strategies are constrained by domestic support versus when they have room to compromise.
To illustrate the important role of compromise in international negotiations, I consider the Syrian crisis, during which President Barack Obama made a public threat to the Syrian leadership in 2012, but later chose to back down from it and to accept a compromise. The president’s threat was made when he announced that the use of chemical weapons would cross a “red line,” which was broadly publicized by major media outlets as a threat to use military force. The New York Times ran the headline, “Obama Threatens Force Against Syria,”Footnote 15 for example, and a Wall Street Journal headline read, “President Threatens Military Response Against Any Use of the Banned Arms.”Footnote 16 Yet even after the administration reported “definitive proof” that the Syrian regime had used chemical weapons,Footnote 17 Obama chose to move forward with a compromise to place Syria’s chemical weapons under international control.Footnote 18
Especially notable in the Syrian crisis is that although Obama was criticized by elites for his failure to follow through with military action and for the perception that he undermined the nation’s credibility,Footnote 19 the general public was supportive of the compromise and the president’s foreign policy approval did not falter.Footnote 20 According to CBS and NBC/ Wall Street Journal polls, the president’s foreign policy approval ratings were 43 and 46 percent, respectively, in the months before Syria used chemical weapons, and stayed relatively consistent at 45 and 46 percent, respectively, following its use of chemical weapons.Footnote 21 When specifically asked about Obama’s handling of foreign policy toward Syria, 56 percent of Republicans and 80 percent of Democrats supported the decision not to engage in airstrikes and to instead pursue a compromise strategy.Footnote 22 Although we will never know what support for Obama and his foreign policy would have been had he followed through on his threat to use force, it is clear that reaching a compromise received a generally positive reaction from the American public, especially among Democrats.
Public compromises have also played a critical role in historical international negotiations, for example, in the 1911 Agadir Crisis, in which tensions escalated when Germany sent a gunboat to Morocco and the British responded with escalatory threats. During this crisis—a case that is regularly discussed in the literature and is cited by James Fearon as a “prominent example”Footnote 23 of inducing audience costs—British statesman David Lloyd George’s famous Mansion House speech acted as a clear and public threat.Footnote 24 The day after the speech, the London Times published it in its entirety and endorsed its message as speaking on behalf of the nation and the Daily Chronicle, in its coverage, ran the headline, “England’s Warning to Germany.”Footnote 25 But when the crisis came to a close, a compromise was reached in which the British backed away from their hardline stance and Germany was granted lands in the Congo in exchange for the French establishing a protectorate in Morocco.Footnote 26 Although none of the major players completely backed down, none received its most preferred outcome. It is notable that after Britain moved away from its threat in favor of a compromise, the British public chose not to punish its leaders.Footnote 27 In his analysis of the case, Marc Trachtenburg finds that the British government did not experience an audience cost for this shift and “would have paid a price if it had not done so.”Footnote 28
As the preceding examples demonstrate, leaders often make public commitments in international negotiations in an attempt to achieve their preferred outcome, but they are also responsive to incentives to avoid the risks of war or the breakdown of cooperation. Although compromises are regularly reached in international politics, international relations scholars have predominately focused on the risks of backing down from public threats and promises.Footnote 29 Yet even the foundational literature on audience costs recognizes that the microfoundations explaining when and why audiences punish inconsistency are uncertain, with Fearon noting, “audiences need not and do not always have this pattern of perceptions and reactions”Footnote 30 and Thomas Schelling writing, “it is by no means easy to establish the [public] commitment.”Footnote 31 Today, the risks of backing down should be particularly salient because the media provides the public greater access to information about their leader’s diplomatic positions,Footnote 32 therefore subjecting diplomacy to the “vice of publicity,”Footnote 33 and yet, many international negotiations do indeed end in compromise.
Moving away from the assumption that the public opposes compromise, this article systematically examines public attitudes toward compromise. I begin by theorizing about the microfoundations of public preferences in international bargaining. The theory builds from the social values and psychological processes citizens draw upon when forming opinions about foreign policy and helps to explain why compromise is viewed as a unique political strategy. I draw on literature that shows how values sort along politically salient divisions that correspond with ideology and, in the United States, with partisanship. The partisan sorting of values interacts with partisan cues, including what I call proposal power—whereby leaders are perceived as initiating compromises as opposed to accepting them—which heightens public support among particular partisans within the public. Rather than politics stopping at the water’s edge, partisanship plays a critical role in shaping how audiences react to foreign policy compromises and structures the diplomatic incentives leaders face at home. I show that leaders have significant flexibility to negotiate compromise settlements on the international stage and, contrary to prevailing wisdom, public compromises do not necessarily jeopardize the respect of the public or the leader’s reputation.
Reconsidering Theories of Compromise
To understand why and how audiences react to leaders’ compromise strategies, I first revisit the most prominent explanations for why audiences punish leaders who act inconsistently on the international stage. Building upon insights from political psychology and theories of partisanship, I then develop a new foundation from which to understand public attitudes toward compromise—a unique type of inconsistency in which a state or leader agrees to concessions that are less than they previously threatened or promised not to accept, but are short of backing down entirely.
The most prominent theory of public opinion and international bargaining is audience cost theory. Early conceptions of audience costs highlight the importance of public opinion in international bargaining, but leave open the specifics regarding why audiences punish their leaders for backing down from public commitments. Schelling notes that negotiators engaged in international bargaining often use public statements to arouse public opinion in an attempt to create credible commitments,Footnote 34 but when the commitment is generated remains an open question. Fearon goes a step farther in formalizing the logic of audience costs, but even he recognizes that audiences do not always punish inconsistency,Footnote 35 a point emphasized by Joshua Kertzer and Ryan Brutger, who find that hawks are more likely to punish inconsistency, while doves are more likely to punish leaders who make threats in the first place.Footnote 36 Although some members of the public may be concerned with the instrumental consequences of generating a poor reputation by backing down, Fearon writes that audiences might punish their leader for backing down for other reasons, noting “political audiences evaluat[e] skill and performance of the leadership” and that a leader who backs down may suffer a “diplomatic humiliation” and jeopardize “the national honor.”Footnote 37
Given that Fearon devotes relatively little attention to why audiences punish their leaders for backing down, scholars have drawn different conclusions about the microfoundations of audience cost theory. On the one hand, Fearon’s equilibrium is sustained if one assumes that voters are aware of the reputational consequences of backing down and they choose to punish their leader to sustain the credibility of their country’s threats in the long run. This logic implies that citizens would sometimes punish their leaders for acting inconsistently, potentially bearing short-term costs, with the goal of maintaining the country’s reputation for the future. But this is a demanding assumption that requires a level of sophistication and strategic calculation on the part of the domestic audience that is unlikely to be present for a broad spectrum of the public, given the significant heterogeneity in its epistemic motivation.Footnote 38 On the other hand, Fearon also proposes that the public may be concerned with maintaining honor and not being humiliated, which draw from emotional concerns as opposed to instrumental considerations. If a large enough portion of the public is concerned with standing firm to preserve its country’s honor or to avoid humiliation, then the audience cost equilibrium could be supported. The fact that such divergent individual-level mechanisms—one a purely calculating instrumental process and the other a purely emotional process—could be responsible for audience costs highlights the need for a theory of the microfoundations of why audiences punish leaders and how those microfoundations shape attitudes toward compromise.Footnote 39
Microfoundations of Attitudes toward Compromise
To develop a deeper understanding of the microfoundations of public reactions to international bargaining, particularly to compromise, I propose an individual-level theory of public opinion toward international compromise. I begin by recognizing that international relations is replete with what decision theorists and ir scholars call ill-structured problems.Footnote 40 Unlike many models of international bargaining that assume common knowledge, international negotiations often involve problems that the public finds complex, where there may be disagreement over what’s at stake, the rules of the game, or even the situation it is facing. In such ill-defined strategic situations, citizens draw upon their core predispositions to form opinions and to evaluate their leaders’ foreign policies.Footnote 41 I argue that citizens react to such situations by using predictable cognitive processes and drawing on their core value orientations, which tends to result in liberals and conservatives having divergent reactions to compromise. These orientations then interact with cues from the negotiation process, such as who proposes a compromise, and therefore the theory connects bottom-up theories of public opinion of foreign policyFootnote 42 with those that focus on elite-driven opinion formation.Footnote 43
Although international relations scholarship views compromise as a politically risky strategy, nascent research in American politics suggests that people value compromise as a means of settling disputes. Jennifer Wolak argues that people are socialized, especially in democracies, to value compromise not only as a process for settling political disputes, but also in social settings.Footnote 44 Whether to resolve a childhood disagreement, a marital dispute, or an international negotiation, people pursue and value compromises “because we believe we should.”Footnote 45 The value placed on compromise is widespread, with the “vast majority” of Americans saying they prefer leaders who are willing to compromise, even though a significant portion of the population also has a preference for leaders who will stand firm.Footnote 46 The value placed on compromise suggests that not all members of the public are predisposed to punish leaders who back down from threats or promises in favor of compromise. This implies that leaders who compromise should receive higher approval in international negotiations than leaders who back down and choose not to engage.
—Hypothesis 1a (H1a). Ceteris paribus, leaders who back down from threats and reach compromises will have higher public approval than those who back down from threats and choose not to engage.Footnote 47
Although existing analysis of compromise primarily focuses on domestic issues, there is a broad body of literature that argues that individuals’ values not only shape their attitudes toward domestic politics, but that those same values also play a prominent role in helping them to interpret and evaluate international affairs. It is well documented that Americans have foreign policy orientations that shape their attitudes toward specific policiesFootnote 48 and that these orientations are based on individuals’ core values.Footnote 49 When facing complex problems, such as the ill-structured situations in international negotiations, individuals often employ heuristics: cognitive shortcuts that allow them to interpret complex phenomena through simplifying lenses.Footnote 50 In the case of international negotiations, I argue that members of the public will generally turn to two types of shortcuts to process these ill-structured problems. First, they interpret negotiations through their own preexisting values, evaluating whether the negotiations were handled in a manner consistent with their core values. Second, they will look to political elites to make inferences about the negotiations. In the case of international negotiations, whether an agreement is proposed by the home country’s leader as opposed to the foreign leader, and the partisanship of the domestic leader, can provide a salient cue that shapes public attitudes toward the negotiation. Although these mental shortcuts are quite distinct from each other (one being bottom-up and the other top-down), they should function as complements given that the persuasion literature shows that cues are most likely to resonate with the public when they tap into individuals’ underlying orientations or beliefs.Footnote 51
The core values that are likely to shape attitudes toward international negotiations and foreign policy orientations are the same values that shape attitudes and political coalitions in domestic politics. Recent studies emphasize that “domestic and foreign policy [attitudes] share a very similar if not identical structure, suggesting that both emerge from common core values”Footnote 52 and that “the same fundamental values that shape our beliefs and behavior in our daily lives also predict our foreign-policy preferences.”Footnote 53 One dimension of these values contrasts self-transcendence values, which emphasize concern for the welfare and interests of others, including the global community, with self-enhancement values, which emphasize relative success and dominance over others.Footnote 54 ir scholars have found that the self-transcendence values strongly predict foreign policy orientations and policies.Footnote 55 With regard to international negotiations, those high in self-transcendence should exhibit heightened concern for the other party in the negotiations and, through universalism, should perceive less of a gap between the in-group and out-group, making such individuals more likely to support compromises that reflect the interests of all parties. By contrast, those who value relative success and dominance should place a higher value on seeing their in-group dominate the negotiation and should be less supportive of their leader accepting a compromise, as opposed to standing firm or seeing their leader propose a compromise. A second dimension of core values contrasts conservation values, which emphasize order, resistance to change, and security, with openness to change.Footnote 56 This dimension should also shape attitudes toward compromise, given that being open to change is critical to accepting a leader’s change in position, whereas individuals who are resistant to change should be most likely to punish leaders for backing down on their commitment. These core values provide the microfoundations for understanding why some people are more likely to support compromise than others.
Individuals’ core values not only shape attitudes toward foreign policy, but are also distributed along the ideological spectrum such that we should expect liberals to be more supportive of compromise than conservatives. A large literature on the psychological foundations of political ideology finds that across countries conservatives are more resistant to change, oppose ambiguity, and prefer definitive outcomes that provide closure,Footnote 57 which suggest that conservatives should be more likely than liberals to disapprove of leaders who change their minds or shift strategies. For example, in a meta-analysis of individuals’ epistemic motivations covering fifty studies in seven different countries, John Jost finds that conservatives exhibit significantly higher dogmatism, which entails “the conviction that ‘To compromise with one’s political opponents is dangerous'….”Footnote 58 Similar ideological differences are found across countries and studies, showing that conservatives are less tolerant of ambiguity and have greater cognitive rigidity,Footnote 59 which contribute to conservatives’ opposition to leaders who change their bargaining position and compromise in international negotiations. By contrast, liberals are more accepting of uncertainty,Footnote 60 more likely to be accommodationist and to support cooperative internationalism,Footnote 61 and more likely to embrace egalitarian values that emphasize community and a broad concern for others.Footnote 62 Each of these components make it more likely that liberals will value leaders who pursue compromises and that they will be more supportive of flexibility and recognition of other actors’ interests in negotiations. Given the general differences in core values and the divergent manner in which people across the ideological spectrum respond to ambiguity, uncertainty, and flexibility, on average we should expect that liberals will have a higher baseline level of support for compromise than conservatives.
In the United States, ideology and partisanship have increasingly aligned, meaning that the preceding analysis can be extended by integrating partisanship into a theory of attitudes toward compromise. As Lilliana Mason emphasizes, changes in partisan and ideological alignment have “brought our ideological and partisan identities into agreement, and this new alignment has increased the strength of those identities.”Footnote 63 This alignment implies that Republicans should be more skeptical of compromises in international negotiations than Democrats, and that the magnitude of these differences should have increased over time as ideology and partisanship have increasingly aligned and reinforced the importance of partisan identities.Footnote 64
—Hypothesis 1b (H1b). Liberals (Democrats) will have higher approval for compromise than conservatives (Republicans).
Proposal Power
Although individuals’ core values contribute to how they interpret and respond to international negotiations, I argue that these values and associated political and ideological identities also interact with cues provided by the negotiation process, most notably proposal power and partisanship. The cues provided by the negotiation process shape attitudes in a number of ways, and one of the most important of these is an elite in-group endorsement. Because international negotiations are ill-structured problems, the public looks for and responds to cues about how the in-group is affected by the negotiation. But how the in-group is defined and the salience of the in-group cue will vary based on individuals’ core values.
The importance of in-group cues will be moderated by how salient the in-group is to an individual and how restrictively the in-group is defined. For conservatives and Republicans, who are high in self-enhancement values, in-group cues will be highly salient and the in-group will be narrowly defined. By contrast, liberals and Democrats, who are high in self-transcendence values and universalism, will place less emphasis on the in-group and will have a broader conception of what defines that group. Therefore, we should expect Republicans will react more strongly to in-group cues provided by the negotiation process, whereas Democrats will be relatively less focused on in-group cues.
In the context of international negotiations, I focus on two salient forms of elite in-group cues: proposal power and partisanship. Proposal power, the framing of a negotiated settlement such that the leader is viewed as initiating the agreement as opposed to accepting it, shapes audiences’ perceptions of leaders’ handling of negotiations in numerous ways. First, proposal power functions as an elite in-group cue with the in-group defined at the national level. Since in-group favoritism and out-group anxiety play an important role in shaping foreign policy attitudes,Footnote 65 the domestic leader proposing an agreement provides a strong cue that the leader of the national in-group endorses the agreement. When the leader exercises proposal power, those who identify with the national in-group are likely to rally behind the leader and to infer that the agreement is in their interest. Indeed, in an unpublished study, Constance Stillinger and colleagues test support for a US-USSR nuclear disarmament dealFootnote 66 that was attributed to either Mikhail Gorbachev or Ronald Reagan. As expected, the US respondents who believed Reagan initiated the deal thought it was good for the United States and those who thought it was Gorbachev’s deal thought it was bad for the United States.Footnote 67 Furthermore, individuals (conservatives) who perceive a greater divide between themselves and the out-group are likely to view it as more concerning when a foreign leader proposes an agreement, whereas those concerns should be allayed when the agreement is proposed by a domestic leader, who is more likely to be seen as a part of the in-group and more likely to be perceived as acting in the interest of the nation.
Proposal power also has the potential to affect perceptions of the negotiation and outcome through a psychological process known as reactive devaluation. Reactive devaluation, the fact that an offer’s perceived value may be diminished, is especially strong when “the offer comes from an adversary.”Footnote 68 In a series of studies on the Israeli-Palestinian peace process, Ifat Maoz and colleagues find that proposals are viewed as much worse if they are attributed to the other side.Footnote 69 A similar process was recently documented in ethnic-civil conflict, in which public support for a peace deal declined when the deal was endorsed by an ethnic out-group leader.Footnote 70 By triggering reactive devaluation among some members of the public, especially those who perceive a strong in-group–out-group divide, proposal power results in the devaluation of compromises proposed by foreign leaders.
When the domestic leader exercises proposal power, it also shapes the public’s perception of the negotiator’s leadership qualities and the public’s feelings toward the agreement. For individuals who value hierarchy and enhancing one’s position over others (conservatives), proposal power will help the leader gain support among this portion of the public. This increase in support stems from exercising proposal power and having that proposal accepted, which suggests that the in-group’s leader achieved what she wanted, at least in part, and exercised some power or authority in the negotiation. Exercising authority is consistent with the core values of many conservatives and helps to demonstrate that the leader is seeking “success for oneself [which] tends to strengthen and to be strengthened by actions aimed at enhancing one’s own social position and authority over other[s].”Footnote 71 This logic implies that a leader exercising proposal power will be viewed as a strong leader by those who value authority and hierarchy, and that this may help preserve the leader’s reputation while also enhancing support for the negotiated outcome.
Although the importance of proposal power is new to international negotiations, it has been shown to be an effective strategy in other areas of social and economic life. For example, leadership studies find that when leaders take initiative, audiences and followers tend to give them higher ratings.Footnote 72 Experimental studies of leadership show that those who take initiative, such as exercising proposal power, are more likely to be nominated as leaders in the future,Footnote 73 suggesting that voters are more likely to support and reelect politicians who take the initiative and propose agreements. Although these results are drawn from different fields of research, we should expect proposal power to play a similar role in international negotiations given that “the same fundamental values that shape our beliefs and behavior in our daily lives also predict our foreign-policy preferences.”Footnote 74
—Hypothesis 2a (H2a). Leaders who propose compromises will have greater public approval than those who accept foreign leaders’ compromise proposals.
In the political realm, we should expect partisanship to play an important role in shaping how audiences respond to compromise proposals. Similar to proposal power, partisanship is a salient reference point for domestic audiences that allows people to seek out cues from like-minded elites.Footnote 75 Much like proposal power’s cue to audiences, partisanship provides an even more specific cue about the negotiation. If the leader who initiates the proposal is a member of a constituent’s party, then the value of proposal power is likely to be amplified because the audience sees a member of their own party initiating the agreement. The in-group leader’s proposal sends a powerful cue to party followers that the compromise agreement is supported by the leader of the country and party, which should generate strong support among those who identify with the party.
The effect of partisan proposers should also vary depending on how narrowly audience members define their in-group. Conservatives, who view the world as more threatening and have a narrower sense of their in-group than liberals, ought to be more discerning when it comes to following elite cues. Conservatives and Republicans are most likely to need strong reassuring cues about the negotiation, and are most likely to support the outcome when their party leader proposes a compromise because it shows their own party leader initiating an agreement that ought to benefit the party and the country. By contrast, liberals and Democrats are more likely to be supportive of compromise in general, and to be influenced by a broader range of cues. Since liberals are more likely to embrace universalism, we should expect them to be more likely to respond favorably when either a national leader proposes a compromise or when a Democrat is involved in proposing or accepting a compromise. In the former case, a national leader proposing a compromise sends a signal that the national in-group is being represented, and in the latter case, a party leader accepting a compromise sends a more specific cue that liberal values are represented in the agreement. In both cases, Democrats should be reassured that the compromise is something they can support.
—Hypothesis 2b (H2b). Republicans are most likely to respond favorably to proposal power when a Republican initiates a proposal, whereas Democrats are likely to respond favorably to proposals from Democrats or Republicans.
Experimental Methods
To analyze how the public responds to leaders’ strategies in international negotiations, I analyze a series of four experiments. The first three build on experiments that use the classic repel-an-invader scenario, while the fourth employs an economic scenario (an investment dispute) to test whether the theory has support across issue areas. I employ four distinct studies to address potential inferential concerns and to test the theories in a variety of realms, including hypothetical versus real leaders, security versus economic issues, and fixed versus varied outcomes, and find that the results are remarkably consistent across design variations, sample populations, and time. Experimental studies are particularly well suited to isolate changes in public approval in negotiation scenarios, given that they allow the researcher to hold the context constant across a range of strategies and outcomes, ensuring internal validity of the study. Recent experiments have found domestic reputation and approval costs to be present across a range of contexts and countries, providing a robust literature on which I build.Footnote 76 But no experiment has examined how the public reacts when a leader escalates an international negotiation, fails to follow through on a threat or promise, and then negotiates a compromise.
Using a framework similar to previous studies, I fielded a series of online survey experiments. Experiment 1 was fielded in the summer of 2014 on a sample of 604 American respondents. Experiment 2 was fielded in spring of 2013 on a sample of 1,204 American respondents. Both studies recruited respondents using Amazon’s Mechanical Turk (MTurk). A discussion of the demographics of the samples and the limitations and advantages of them is provided in section 1 of the supplementary material.Footnote 77 Although Adam Berinsky, Gregory Huber, and Gabe Lenz have shown the reliability of MTurk results in many areas,Footnote 78 Experiment 3 fielded a truncated version of the experiment on a more representative sample of 613 American respondents administered by Survey Sampling International (ssi) in the spring of 2016.Footnote 79 The three experiments find consistent results across four years of study, different sample populations, and variations of the treatments designed to test the robustness of the results (discussed below), showing that the results are not a function of time or sample method.
Experiment 4 was fielded by ssi on a sample of 543 registered US voters in the spring of 2016. This experiment was designed to test the theories of compromise and proposal power in a different issue area— international economics. Because the public’s perception of the high politics of national security may differ from how it views the low politics of international economics, it is important to test whether the theory explains perceptions of negotiation strategies and foreign policy across issue areas. The results of Experiment 4 provide further support for the theory of proposal power and the partisan nature of public opinion toward compromise. I return to Experiment 4 after a discussion of the three security-focused experiments.
The first three experiments began with a script that read:
The following questions are about US relations with other countries around the world. You will read about a situation our country has faced many times in the past and will probably face again. Different leaders have handled the situation in different ways. We will describe one approach US leaders have taken, and ask whether you approve or disapprove.
Respondents next read about a crisis in which a country sent its military to take over a territorial region in a neighboring country. To avoid country-specific confounders and to maintain comparability with previous studies, the scenarios deliberately avoided using any country names for the foreign parties. After reading the background on the crisis, respondents were randomly assigned one of the president’s strategies.
I begin by introducing the text from Experiment 1 and then progress through a discussion of the modifications made to the treatments in experiments 2 and 3. In the baseline condition, labeled “stay out,” the president does not engage in the crisis.
—Stay Out. The US president, who was a Democrat (Republican), said the United States would stay out of the conflict. The attacking country continued to invade and the conflict ended with the attacking country taking control of 20 percent of the contested territory.
In each of the remaining treatment conditions, the US escalated with a threat and then the respondent was randomly assigned to either the compromise or not-engage condition.
—Threat. The US president, who was a Democrat (or Republican), said that if the attacking country continued to invade, the United States military would immediately engage and attempt to push out the attacking country. The president sent troops to the region.
—Compromise. The attacking country continued to invade, but the president did not immediately engage. The president, and all of the parties, agreed to a compromise settlement and the conflict ended with the attacking country taking control of 20 percent of the contested territory.Footnote 80
—Not Engage. The attacking country continued to invade. The US president ordered the military not to engage. The attacking country continued to invade and the conflict ended with the attacking country taking control of 20 percent of the contested territory.
After reading the president’s choice of action, respondents were provided a summary of the events. They were then asked whether they “approve, disapprove, or neither approve nor disapprove of the way the US president handled the situation” and how strongly they felt that way. These responses generated the dependent variable, which is an approval score on a seven-point scale ranging from –3 (strongly disapprove) to 3 (strongly approve).
A challenge of evaluating public approval for leaders’ strategies in actual negotiations is that audiences are likely to have preferences about both the strategy used by the leader and the policy outcomes of the crisis.Footnote 81 Although disaggregating the audience’s preference for outcomes and strategies is challenging in observational studies, using an experimental scenario allows the magnitude of the domestic cost to be measured while holding policy outcomes constant. To isolate the cost across all strategies, as noted in the treatments above, I hold the outcomes constant across all conditions in Experiment 1 by following the method used by Kertzer and Brutger, who held outcomes constant with the attacking country gaining 20 percent of the territory.Footnote 82 Doing so allows me to first test how the president’s strategy alone affects the magnitude of public opinion costs.
Experiment 2 uses the same framework as the first experiment while also testing how proposal power and variation in outcomes affect public approval. To test the effect of proposal power, Experiment 2 randomizes whether the “US president proposed a settlement” or the “leader of the attacking country proposed a settlement” in the compromise condition. Experiment 2 also randomizes the amount of territory gained by the attacking country, randomly assigning whether the attacking country gained the same 20 percent of the contested territory as in Experiment 1, or if the attacking country received an additional 30 percent. This randomization allows me to jointly test how different strategies and outcomes affect public support and what the strategic incentives for leaders are based on different outcomes.Footnote 83
Experiment 3 is a modified version of the first two experiments and repeats the tests of proposal power and partisanship on a national sample fielded by ssi. Experiment 3 also modifies the language of the compromise treatment to address potential concerns regarding the lexical equivalence of the compromise and not-engage treatments in the first two experiments. In the first two experiments, the compromise treatment included language that the president “did not immediately engage.” This language was chosen to emphasize the inconsistency of the president failing to follow through on the threat to “immediately engage,” and it differs from the not-engage treatment that says “the president ordered the military not to engage.” Although the treatments across the experiments all emphasize the same general strategic choices, Experiment 3 shows that the results are consistent when the language is modified to “the president ordered the military not to engage” in the compromise condition, which is identical to the corresponding language of the not-engage treatment of experiments 1 and 2. The exact wording for Experiment 3 is:
—Compromise. The attacking country continued to invade, but the US president ordered the military not to engage. The US president (or leader of the attacking country) proposed a settlement, which was agreed to by the parties, and the conflict ended with the attacking country taking control of 20 percent of the contested territory.
Results
Security Experiments
Although not the focus of this study, it is notable that the experiments find that significant audience costs exist for leaders in the not-engage condition in which the leader makes a threat, does not follow through on it, and has no further involvement in the crisis. In experiments 1 and 2, the change in the seven-point approval score between the stay-out and not-engage treatments was –2.03 and –1.76, respectively. These effects are slightly larger than the total audience cost found in Kertzer and Brutger, suggesting that the experiments capture the baseline audience cost effect found in previous studies,Footnote 84 which is a useful starting point because the following results focus on how compromise mitigates or eliminates approval and reputation costs.
The Effect of Compromise
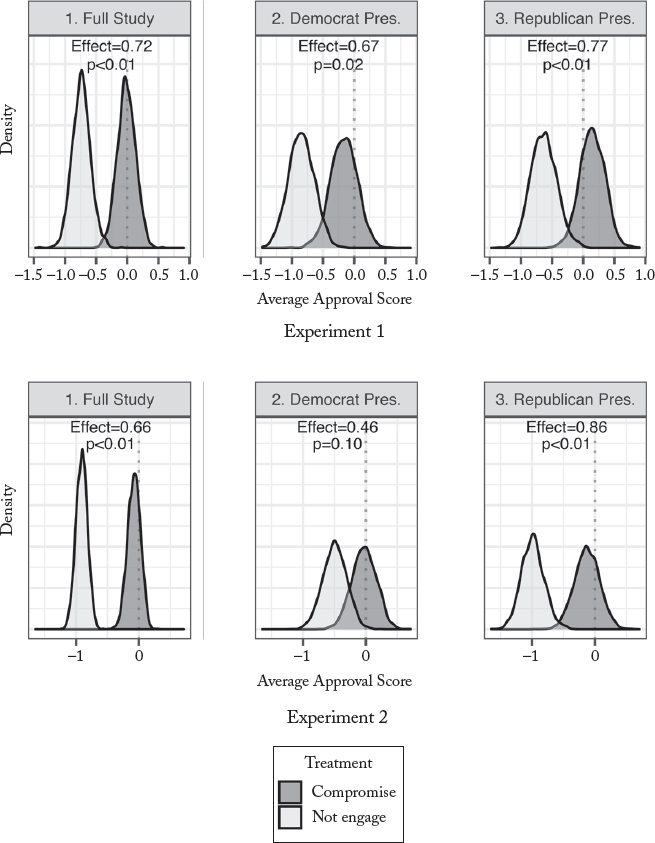
To assess H1a and the effect of compromise, Figure 1 displays the distribution of average approval scores for the compromise and not-engage treatments with outcomes held constant for the full study and broken down by the party of the president for experiments 1 and 2. The results show that although the president acts inconsistently in both the not-engage and compromise conditions, audiences prefer leaders who back down and negotiate compromises, even when holding outcomes constant. The effect of shifting from the not-engage condition to the compromise condition is even more pronounced when analyzing the percent of respondents who approve of the president’s handling of the situation. In experiments 1 and 2, the percent of respondents approving is 14.9 (p < 0.01) and 14.4 (p < 0.01) percentage points higher, respectively, when the president compromises than when the president chooses not to engage.Footnote 85 These results demonstrate strong support for H1a, showing that compromise is evaluated in a distinct manner than other forms of inconsistency and that the results are robust regardless of whether the president is a Democrat or Republican.
Average Approval Score for Compromise vs. Not Engagea
aFigure shows the distributions of average approval scores drawn from 2,000 bootstraps for experiments 1 and 2 aggregated across presidents’ parties and broken down by party of the president. The effects are the change in the approval scores moving from the not-engage to the compromise condition; p-values are calculated using a t-test. Outcomes are held constant with 20 percent territory gained by the attacking country. The approval score is measured on a scale from –3 (strongly disapprove) to 3 (strongly approve).

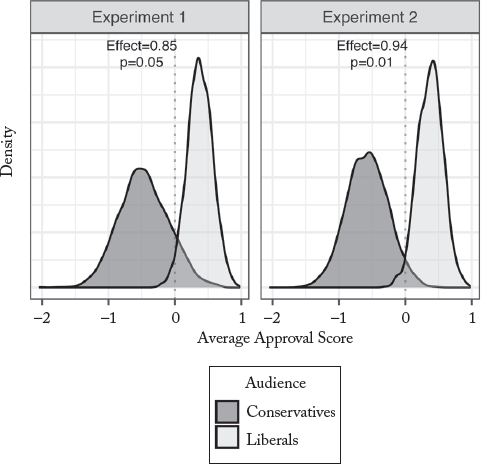
I next test H1b, which argues that liberals (Democrats) should have higher levels of support for compromise than conservatives (Republicans). Figure 2 presents the approval for compromise broken down by ideology of the respondent, clearly showing that liberals have significantly higher approval of compromise than do conservatives. The magnitude of the difference is highlighted when considering the percent of respondents approving of compromise, which in Experiment 1 is 20.9 percentage points higher for liberals than for conservatives (p = 0.03), and in Experiment 2 is 22.4 percentage points higher for liberals than for conservatives (p = 0.01). H1b also finds support when comparing Democrats to Republicans, which is shown in section 2 of the supplementary material.Footnote 86 The differences in the percent of Democrats and Republicans approving of compromises are 29.6 (p < 0.01) and 19.1 (p = 0.06), respectively, for experiments 1 and 2. These results demonstrate that compromise in international negotiations is viewed in a distinct manner by liberals and conservatives, with liberals generally approving of it and conservatives generally disapproving of it, as the theory predicts.
Average Approval Score for Compromise by Ideologya
aFigure shows the distributions of average approval scores in the compromise condition drawn from 2,000 bootstraps based on the ideology of the respondents from experiments 1 and 2. Ideology is measured from 1 (very liberal) to 5 (very conservative), with those selecting 1 and 2 counted as liberals and those selecting 4 and 5 counted as conservatives. The effects are the difference in approval scores moving from conservatives to liberals; p-values are calculated using a t-test. Outcomes are held constant with 20 percent territory gained by the attacking country. The approval score is measured on a scale from -3 (strongly disapprove) to 3 (strongly approve).

Sensitivity to Outcomes
Although the preceding results provide strong support for H1a and H1b, the question remains whether these results are robust to variation in outcomes. Jack Snyder and Erica Borghard argue that the substantive policy outcomes of a crisis play a significant role in determining public approval, which could undermine the positive effect of compromise on approval and reputation if leaders are punished for making additional concessions.Footnote 87 We might imagine that when a leader backs down and acquiesces to the attacking country, the outcomes would shift in favor of the attacking country, but the compromise ought to yield a better outcome for the home country than completely backing down. This last point suggests that the earlier results are a conservative test of the effect of compromise because the only difference in scenarios is the strategy used to reach the outcome, as opposed to the compromise condition also yielding a more favorable outcome. To evaluate the effect of outcomes on public attitudes toward international negotiations, Experiment 2 tests the sensitivity of audiences’ approval to randomly varied crisis outcomes.
I begin by considering whether a compromise that gives more to the foreign country receives lower approval from the domestic audience, comparing negotiated settlements that led to the foreign country gaining a baseline of 20 percent of the contested territory or an additional 30 percent.Footnote 88 The shift in average approval between the attacking country receiving 20 versus 50 percent in the compromise treatment is only –0.01 (p = 0.95), showing that when compromise results in a worse policy outcome, the public is willing to accept the concessions and support the leader. This result reinforces the finding that leaders can maintain significant domestic support for their foreign policy when negotiating compromises.
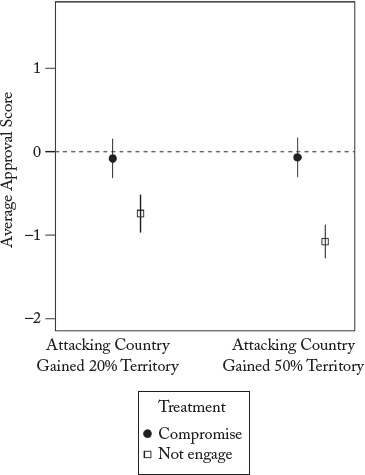
I next consider approval for compromise compared to the not-engage condition. For all comparisons, the compromise treatment results in a significantly higher approval than the not engage, as is shown in Figure 3. But when the leader backs down, chooses not to engage, and that results in the attacking country taking over more territory, approval drops even lower (–0.34, p = 0.06). Although approval for compromise remains stable across territorial outcomes, the drop in approval for the not-engage treatment when the attacking country gains more territory demonstrates that the results discussed above are indeed conservative when comparing compromise to not engage. The conservative estimates presented in Figure 1 (holding outcomes constant at 20 percent) result in compromise having a 0.66 (p < 0.01) higher approval than not engage, but when the acquiescence in the not-engage condition results in the attacking country gaining more territory, the difference in approval between compromise and not engage is about 50 percent larger at 1.00 (p < 0.01). These results demonstrate that audiences appear more sensitive to changes in outcomes in the not-engage condition than in the compromise condition, giving leaders greater flexibility to reach compromises in international negotiations.
Average Approval Score for Compromise by Ideologya
a Figure shows the average approval score and 95 percent confidence intervals for the compromise and not-engage treatments conditional on whether the attacking country gained 20 or 50 percent of the contested territory. The approval score is measured on a scale from —3 (strongly disapprove) to 3 (strongly approve).

Proposal Power
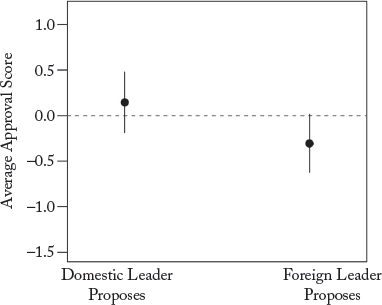
A final component of compromises that is likely to affect audiences’ approval is the perception of the leader’s role in reaching a settlement, specifically whether the leader exercises proposal power. To test the effect of proposal power, Experiment 2 randomly assigns whether a compromise is proposed by the president or the foreign leader. As shown in Figure 4, the average support score for a compromise proposed by the domestic leader is positive, whereas approval when the foreign leader proposes a compromise is negative. This result provides cautious support for H2a, although the difference does not reach traditional levels of significance (p = 0.11). In substantive terms, 12 percent more respondents approve when the domestic leader proposes the compromise than when the foreign leader proposes it (p = 0.08). Although these results shed light on H2a, the full effect of proposal power hinges on the partisan interaction of the audience and the leader.
Approval Score for Compromise Based on Proposal Powera
a Figure shows the average approval score and 95 percent confidence intervals for domestic leaders who propose compromises and domestic leaders who accept compromises proposed by foreign leaders. Outcomes are held constant with 20 percent territory gained by the attacking country. The approval score is measured on a scale from —3 (strongly disapprove) to 3 (strongly approve).

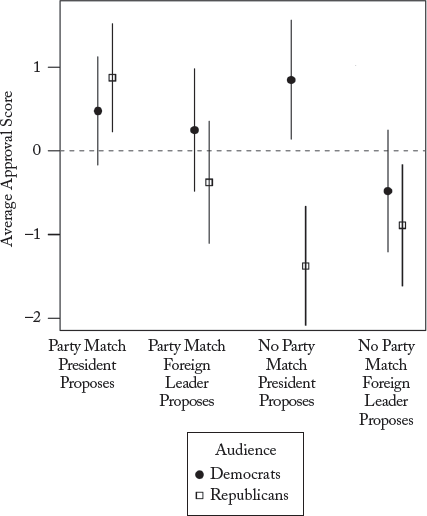
To assess how partisanship and proposal power interact, I analyze proposal power across different combinations of the president’s party and the audience’s party. I use a party match variable that indicates whether the respondent and president are from the same party. As shown in Figure 5, Democrats consistently have favorable opinions of presidents who are Democrat and they agree to compromises regardless of whether the president proposes or accepts the compromise.
Average Approval Score for Compromise Based on Party Match and Proposal Powera
a Figure shows the average approval score and 95 percent confidence intervals for audiences of Democrats and Republicans based on whether the respondent and president are from the same party (party match) interacted with whether the US president or the foreign leader proposed the negotiated settlement; outcomes are held constant with 20 percent territory gained by the attacking country. The approval score is measured on a scale from —3 (strongly disapprove) to 3 (strongly approve).

The only situation in which Democrats look unfavorably on compromise is when the president is a Republican and the compromise is initiated by the foreign leader. By contrast, and consistent with H2b, Republican audiences are more selective when supporting compromise. Republicans strongly support a Republican president when she proposes the compromise, but not when the president accepts a compromise initiated by the foreign country. Consistent with H2a and H2b, these findings support the idea that audiences take cues from their leaders in international negotiations, resulting in greater support for the leader when that leader is a member of their party and when the domestic leader initiates the compromise. The results also support a long-held idea that “only Nixon could go to China,” meaning that Republican presidents, who are more likely to be viewed as hawks, actually have an easier time making peace.Footnote 89 A Republican president who proposes a compromise receives strong support from audiences of both parties, with support at 70 percent among Democrats and 63 percent among Republicans. By contrast, a Democrat who proposes a compromise receives strong support from her own party, 61 percent, but only 13 percent support from Republicans, which highlights the partisan nature of compromise.Footnote 90
The results from the national ssi sample in Experiment 3 add further support to the influence of partisanship and proposal power on public opinion toward international compromises.Footnote 91 Among Democrats and Republicans, leaders always received high approval scores from members of their own party when they exercise proposal power and initiate the compromise. Additionally, the results demonstrate that differences in language across the experiments do not alter the underlying treatment effects. Consistent with the results in Experiment 2, Experiment 3 finds that the average approval score among Democrats is always positive when a compromise is reached by the Democratic leader or a compromise was proposed by the domestic leader. Across comparable conditions in experiments 2 and 3, the difference in average approval scores was essentially zero (0.13, p = 0.65), highlighting that the national SSI and MTurk samples generated remarkably consistent results. Republicans have a somewhat lower average baseline approval in Experiment 3, but the comparable treatment effect of switching from a Democrat to Republican president proposing the compromise remains positive and significant (0.90, p = 0.04) among Republicans. The robustness of the results across samples, experiment wording, and time demonstrate that proposal power and partisanship play critical roles in shaping public support for international negotiations and compromise.
Economic Negotiations
To examine whether partisanship and proposal power affect perceptions of compromise across issue areas, Experiment 4 tests attitudes toward compromise in an international investment dispute. The experiment was fielded in the spring of 2016 by ssi on a national sample of 543 American respondents. The experiment presented respondents with a hypothetical investment dispute in which a foreign firm sued the United States using investor-state dispute settlement. Rather than duplicating all the conditions from the three prior studies, Experiment 4 limits its focus to proposal power, randomizing whether the US leader or the foreign leader proposes a compromise. The experiment also differs in that it specifies Obama as the US leader, which means the party of the president is not varied. Doing so has the added advantage of allowing us to see how the audience’s partisanship interacts with a known president and the effect of that interaction on public approval.
The respondents read about an investment dispute in which Trans-Corp, a hypothetical company from a neighboring country, sued the United States and the Obama administration for $15 billion.Footnote 92 Similar to the security experiments, the situation involved the United States escalating the dispute with a clear promise to fight the challenge, specifying that the Obama administration would “fight the challenge until the arbitration panel made its decision.” After reading the president’s commitment, they read that either the Obama administration or TransCorp “proposed a settlement granting TransCorp twenty percent of the value of the suit,” and that the settlement was accepted by the other party. Respondents were then asked the same approval question as in the earlier experiments.
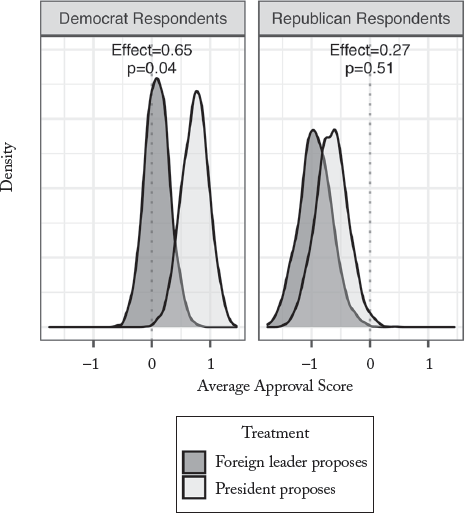
The results, which are displayed in Figure 6, show that exercising proposal power works to the advantage of the leader even in economic negotiations. For the full sample, when the US leader proposes the settlement, the leader’s approval score goes up by 0.4 on a seven-point scale (p = 0.05). The effect of proposal power based on the partisanship of the audience when Obama proposes a compromise shows that the Democrats’ approval score increases by 0.65 (p = 0.04), whereas Republicans do not have a significant change in approval, with a shift in approval score of just 0.27 (p = 0.51). To highlight the magnitude of these effects, consider the change in the percent of Democrats and Republicans who support the settlement based on proposal power. Only 32 percent of Democrats support the settlement when the foreign leader proposes it, but support jumps to 63 percent when the US leader proposes the agreement (p < 0.01). By contrast, 24 percent of Republicans support the agreement when the foreign leader proposes, and 27 percent support when the US leader proposes it (p = 0.70).Footnote 93 These results add additional support to the findings that Republicans do not support international compromises proposed by Democrats and they have a lower baseline level of support for compromise as well.
Average Approval Score for Compromisea
a Figure shows the distributions of average approval scores from Experiment 4 drawn from 2,000 bootstraps based on the party of the respondent and the proposer. The effects are the average treatment effects; and p-values are calculated using a t-test. The approval score is measured on a scale from -3 (strongly disapprove) to 3 (strongly approve).

The results of the investment experiment provide the first analysis of how public opinion toward compromise and proposal power translate across issue areas. Although the investment experiment does not include every potential treatment condition to test each hypothesis, the results support H1b, H2a, and H2b, showing that proposal power and partisanship have a significant effect on support for negotiated outcomes and compromise. The evidence presents a strong case that opinions toward compromise and the ideological and partisan foundations that influence them apply to both the high politics of security issues and the low politics of international economics.
Testing Theoretical Extensions
The main findings of this work demonstrate that the public often supports compromise and that proposal power and partisanship play a major role in shaping public opinion about international negotiations. The results also inspire a number of important and theoretically interesting questions, two of which I address in this section. The first is whether leaders would be better off avoiding making a threat or a promise in the first place, and the second is whether they would be better off following through on their threat as opposed to proposing a compromise. These questions go beyond the main research agenda of this article, but they have important implications for international bargaining, so each is briefly addressed and experimentally tested. I also ask what drives support for compromise. Using causal mediation analysis, I show that the most important factor influencing support for compromise is the strength of the leader’s reputation and that negotiating compromises strengthens the domestic audiences’ perception of the leader’s reputation.
When to Threaten? When to Follow Through?
One criticism that could be raised against the scenarios of the experiments is that each includes an ultimatum threat or promise prior to the leader reaching a compromise. This sequence of negotiation events was chosen to explicitly show that the leader was reaching a compromise in which she clearly backed down from her earlier bargaining position. But because political negotiations are inherently strategic, I now consider whether the leader would have been better off choosing a different path through the bargaining process. I first ask whether the leader would have been better off never making a threat or promise, and then I assess whether the leader would have been better off making the threat and following through on it.
To test the first of these questions, Experiment 4 includes an additional treatment condition in which Obama never issues a threat or a promise, but the same agreement is reached. In this final scenario, respondents read, “The Obama administration proposed a settlement granting TransCorp twenty percent of the value of the suit, and TransCorp accepted the settlement.” This condition is identical to the condition in which Obama proposes the settlement, with the exception that it does not include the threat to fight the dispute to the end. The expectation among scholars who assume compromise is punished is that approval would be lower for a leader who makes a threat and then backs down from it to reach a compromise than for a leader who reaches the same agreement without the threat. But the results show that there is not a significant difference between making the threat and then reaching a compromise and reaching the same agreement without the threat. The difference in approval scores between the two conditions among the full sample is 0.14 higher on a seven-point scale when the leader compromises after the threat (p = 0.50). Breaking down the results by respondents’ party shows that the approval score among Democrats is 0.38 higher (p = 0.25) and among Republicans is 0.17 lower (p = 0.69) when the leader first makes a threat. These findings show that once compromise is factored in, domestic public opinion does not provide an incentive for the leader to refrain from making a threat in the economic scenario—a finding that deserves further attention in future research.
In the negotiation process, leaders also have the option to follow through on their threat, which is what the audience-cost literature argues will occur if a leader becomes locked in and the adversary does not acquiesce.Footnote 94 Although I have shown that the public supports the leader’s decision to compromise, especially when that leader proposes the compromise, a remaining question is whether the leader would have been better off following through on her threat. To test this question, Experiment 2 includes an additional treatment condition in which the leader follows through on the threat to engage militarily, which follows Kertzer and Brutger’s experimental design.Footnote 95 If approval of the leader’s handling of the situation is higher in the engage treatment, then the leader is locked in. But if approval is higher when the leader proposes a compromise, it suggests that the leader is better off reaching a compromise and that the initial threat or promise was not a credible commitment.
To evaluate the incentives of the leader, I compare the approval score of the leader’s handling of the situation when she proposes the compromise versus approval when she follows through on the threat and engages. As with the earlier analysis, the policy outcome is held constant across comparisons. The results show that approval levels are statistically indistinguishable across the compromise and engage treatments, with the difference being –0.12 for the full sample (p = 0.67). Consistent with the full sample, the approval scores are indistinguishable across treatment conditions for Democrat and Republican presidents, with the differences being –0.27 (p = 0.52) and 0.04 (p = 0.92), respectively. These results indicate that the leader does not receive significantly greater support for following through on her threat. These findings highlight the public’s support for compromise and demonstrate the challenge of using public rhetoric to send credible signals of resolve in international relations.
Analyzing the Mechanisms
To understand why audiences tend to favor compromise, Experiment 2 tests what factors are responsible for peoples’ reactions to compromise. The study includes a measure of the most prominent explanation for why audiences may punish leaders’ inconsistency—reputational concernsFootnote 96—and also includes other potential mediators, such as whether the respondent was proud, angry, hopeful, worried, or frightened. To measure concerns about reputation, each respondent was asked, “On a scale of 1–5, how much damage do you think there would be to the president’s reputation as a result of the president’s handling of the situation?” For the other mediators, respondents were asked to indicate whether any of the options describe their feelings about the president’s handling of the situation.Footnote 97 When leaders choose to reach a compromise after backing down from a threat as opposed to not engaging, they receive a significant improvement in their perceived reputation (0.51, p < 0.01). The importance of reputation is highlighted in mediation analysis,Footnote 98 which tests how the potential mediators affect approval of the president’s handling of the situation. When examining the increase in approval from the not-engage to the compromise condition, the mediating effect of reputation is responsible for 58 percent of the increase in approval (p < 0.01). Although many of the mediators had a significant effect on approval, reputation had the strongest effect and was responsible for the greatest proportion of the total effect of com-promise.Footnote 99 The next most important mediator was whether or not people were proud of how the president handled the negotiation, with 12 percent more of the respondents being proud of how the president handled the negotiation when a compromise was reached (p < 0.01). These findings demonstrate that leaders who are concerned about their reputations among domestic audiences can preserve or enhance their reputations by reaching diplomatic compromises.
Conclusion
The evidence in this article builds a case for a reformulation of how we think about public opinion and commitments in international bargaining. Three critical points emerge for understanding the role of the domestic public in international negotiations. First, leaders can influence the level of public approval when negotiating a compromise by exercising proposal power. When leaders negotiate settlements and are perceived as the proposer, they are able to protect their reputations, which allows them to mitigate or eliminate public disapproval. Proposal power introduces to the bargaining dynamic a new component that allows leaders to frame the bargaining outcome for their home audience and provides greater flexibility for the leader to negotiate concessions.
Second, the composition of a leader’s audience is of vital importance when evaluating whether publics constrain leaders’ behavior and create costly signals on the international stage. Whereas prior studies find that audience costs are nonpartisan,Footnote 100 I find that ideology and partisanship significantly affect approval for compromise when both the audience and the leader’s partisanship are taken into account.Footnote 101 Given how individuals’ core values and ideology interact with proposal power in international negotiations, Republican presidents have greater leeway to negotiate compromise settlements and receive strong support from Democratic and Republican voters when they propose them. By contrast, presidents who are Democrats are more constrained, and receive support only from their own party when they propose compromises. The role of partisanship in shaping public approval of foreign policy strategies adds further support to a growing literature that argues that increasingly, politics does not stop at the water’s edge.Footnote 102
Third, when the possibility of compromise is included, audiences rarely lock in leaders in international negotiations and domestic approval concerns are at best, inconsistent signals of leaders’ resolve. Rather than assume publics disapprove of compromise as Morgenthau argues,Footnote 103 these results fundamentally change how we think domestic audiences respond to international diplomacy. The results presented in this article suggest that many leaders can pursue foreign policy compromises without jeopardizing their domestic support or reputations. For example, in the Agadir Crisis, Britain made a clear and public threat, but then chose to embrace a diplomatic compromise that was supported by the domestic audience. The public’s propensity to support compromise, and the ideological divide of that support, was also evident in its reaction to President Obama’s compromise in the Syrian crisis, during which Democrats strongly supported the compromise and even Republicans viewed it relatively favorably, although significantly less so than Democrats. These examples and the experimental evidence highlight the need to reevaluate the theories connecting public opinion to diplomatic compromise and the role of the public in constraining leaders’ negotiating strategies.
Supplementary Material
Supplementary material for this article can be found at https://www.doi.org/10.1017/S0043887120000192.
Data
Replication files for this article can be found at https://www.doi.org/10.7910/DVN/SYH7UN.
Acknowledgements
I thank Omar Bashir, Thomas Christensen, Richard Clark, Christina Davis, Alexandra Guisinger, Joshua Kertzer, In Song Kim, Marika Landau-Wells, Yonatan Lupu, Helen Milner, Cecilia Mo, Julia Morse, Tyler Pratt, Thomas Scherer, Kris-topher Ramsay, Brian Rathbun, Elizabeth Saunders, Jacob Shapiro, Yuki Shiraito, Jessica Weeks, Alex Weisiger, and participants of workshops for valuable feedback on earlier drafts of this project.
Funding
I thank Princeton’s Center for International Security Studies, the Fund for Experimental Social Sciences, the Neihaus Center for Globalization and Governance, and the Mamdouha S. Bobst Center for Peace and Justice for financial support for this research.
Author
Ryan Brutger is an assistant professor in the Department of Political Science at the University of California, Berkeley. His research interests include international political economy, international relations, and political psychology, with a focus on the domestic politics of international negotiations and cooperation. He be reached at brutger@berkeley.edu.