


Introduction
The mass balance of Antarctica and the future rate of contributions to sea level from both the East and West Antarctic ice sheets (EAIS and WAIS) are still among the major unknowns in climate science (Reference RignotSolomon and others, 2007). While a clear signal has not yet been determined for the EAIS, recent satellite observations have shown that the WAIS is losing mass at a rate of ~100 Gt a–1 (Reference Price, Bindschadle, Hulb and JoughinRignot and others, 2008), largely due to outfluxes from the Pine Island and Thwaites Glacier systems. Negative mass balance has also been suggested for the WAIS by gravity surveys (Reference Smith, Bentle and RaymondVelicogna and Wahr, 2006). While the total mass balance of the WAIS is decreasing, Joughin and Tulaczyk (2002) found a net positive mass balance of 28.8 Gt a–1 for the Siple Coast ice streams in the Ross embayment. Recent interferometric synthetic aperture radar (InSAR) measurements by Reference Price, Bindschadle, Hulb and JoughinRignot and others (2008) show a slightly more positive value of 34.8±8Gt a–1 for the period 1992–2006. Most of this mass gain (80%) is due to Kamb Ice Stream (KIS), which recently stagnated and is now thickening at a rate similar to the mean accumulation rate of ~20 cma–1. The future behavior of KIS will therefore substantially impact the mass balance of the WAIS. If it were to reactivate, for example, without any other substantial changes, the mass balance of the WAIS would become more negative by about 20%.
Radar observations of KIS in the late 1980s showed that it stagnated ~160 years ago, based on the burial depth of crevasses in the margins (Reference Peters, Blankenshi and MorseRetzlaff and Bentley, 1993). However, the stagnation is not uniform over the whole length of KIS. The InSAR-derived surface-speed pattern on KIS (Reference Joughin and TulaczykJoughin and others, 1999) shows that surface speeds in the upper tributaries and upper trunk remain greater than 100ma–1, while the lower trunk has nearly stagnated (Fig. 1). In the lower trunk, satellite imagery shows that flow diverges around an essentially stationary central island, i.e. a ‘sticky spot’ that corresponds to a 300 m bedrock rise previously identified by ground-based and airborne radar (Reference Jacobel and WelchJacobel and others, 1993; Reference Peters, Blankenshi and MorseRetzlaff and Bentley, 1993). The difference in velocity between the upper trunk and the lower trunk causes converging flow in the area just above the sticky spot, where surface elevations are now rising (Reference MacGregor, Winebrenne, Conwa, Matsuok, Mayewsk and ClowPrice and others, 2001).
Color map of InSAR-derived surface speeds in the lower half of KIS (note the non-linear color table) (Reference Joughin and TulaczykJoughin and others, 1999) overlain on a grayscale MODIS (moderate-resolution imaging spectroradiometer) image of this region. Locations of camps and radar profiles described in this study are shown. Inset map shows the ‘sticky spot’, a region of near-zero surface speeds coincident with the UpC camp and two boreholes (Reference Corr, Moor and NichollsEngelhardt, 2004). Radar profiles shown in white rather than yellow are the subset of profiles used to estimate the depth-averaged attenuation rate in this region.

Reference Anandakrishnan, Alle, Jacobe, Conway, R.B and BindschadleAnandakrishnan and others (2001) discussed various possibilities for the shutdown of KIS. Their preferred hypothesis is that dewatering of the thin, or nearly absent, till over elevated regions of the bed such as the sticky spot increased the effective normal stresses there and the ice became frozen to the bed, leading to the shutdown. Boreholes drilled to the bed in the vicinity of the sticky spot (Reference Corr, Moor and NichollsEngelhardt, 2004) show that dry conditions exist over the elevated topography, while water is present in marginal areas directly to the south and out into the south trunk of KIS. Whatever the cause of the shutdown, the basal hydrology of KIS is key to understanding its past and future dynamics (Reference SolomonVogel and others, 2005). Here we investigate the basal hydrology of KIS using new radar data and estimates of englacial attenuation that allow us to further constrain the basal water distribution.
Data and Methods
During two field seasons in 2004–06 we conducted ground-based ice-penetrating radar surveys on KIS to detect regions of wet and dry bed conditions based on differences in the radar reflectivity. These surveys included two spatially dense grids over features of interest and a longer radar profile through the trunk. One of the dense grids was located in the vicinity of the sticky spot, and another in a region of the main trunk of KIS ~80km upstream at the ‘Lake Camp’ location (Fig. 1). The long profile extended 280 km from the Lake Camp through the north branch of the trunk of KIS and on to Siple Dome, ending at the site of the deep ice core collected there (Reference Gades, Raymon, Conwa and JacobelGow and Engelhardt, 2000). Altogether we acquired more than 1600 km of radar profiles using an impulse system with a center frequency of 3MHz (Reference VogelWelch and Jacobel, 2003). Individual stacked traces were recorded at an average spacing of 18 m, with trace locations and surface elevations determined by continuously recorded high-precision global positioning system (GPS) measurements.
The radar system records the echo intensity of the bed reflection, which depends on the radar system characteristics, the various losses within the ice and the basal reflectivity. The basal reflectivity depends solely on the dielectric contrast present at the bed and the radar frequency. Ground-based impulse radar can be used to estimate the bed reflectivity, from which basal conditions (wet vs dry) may then be inferred (e.g. Reference Filina, Blankenshi and YoungGades and others, 2000). However, because the recorded basal echo intensities also depend on losses within the ice, which are often poorly known, these losses must be estimated prior to the interpretation of basal conditions from radar data. Apart from geometric spreading, the dominant loss, which is also typically the least well known, is the dielectric attenuation (hereafter simply attenuation) (e.g. Reference Joughin, Tulaczy, MacAyea and EngelhardtMacGregor and others, 2007).
Equation (1) is a simplified version of the radar equation showing the power received by the radar, P r, as a function of the transmitted power, losses due to wave propagation through the ice and the reflectivity of the interface:

where P t is the transmitted power, A is the antenna gain function, h is the one-way path length, R is the reflectivity of the target interface (an internal layer or the bed) and L a is the mean attenuation length. For near-normal incidence, where the transmitter/receiver antenna spacing is much less than the ice thickness, h is effectively the ice thickness when considering bed echoes. P r is subject to both inverse-square losses from geometric spreading of the radar energy (1/(2h)2) and exponential losses due to attenuation ( exp ð -2h=La Þ).
Taking the log10 of both sides of Equation (1), the more commonly used attenuation rate (N a) in dBkm–1 is simply related to L a in m by:

A recent survey of attenuation measurements (Reference Joughin, Tulaczy, MacAyea and EngelhardtMacGregor and others, 2007) found that the few reported values of depth-averaged attenuation rates in West Antarctica vary by a factor of 3, presumably due to spatial variations in the chemistry and temperature profiles of the ice (Table 1). Thus, a single value for depth-averaged ice-sheet attenuation cannot be assumed, even over a relatively small region.
Previously observed values of depth-averaged ice-sheet radar attenuation rates in West Antarctica
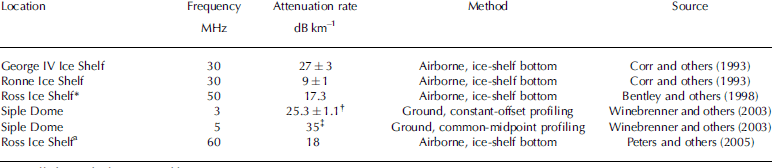
Note: All observed values reported here were measured to the bed/bottom of the ice sheet/shelf.
*Measured near the grounding line of KIS. †Revised by Reference Joughin, Tulaczy, MacAyea and EngelhardtMacGregor and others (2007). ‡Not corrected for antenna beam pattern.
At first glance, it appears that the problem of extracting values of the bed reflectivity R from Equation (1) requires simultaneous knowledge of the attenuation rate through the ice and the received power from the bed, i.e. one equation and two unknowns. In order to estimate R we initially assume that it is constant along part of the radar profile where the bed conditions are not expected to vary and where ice thickness varies significantly. We can then estimate the attenuation rate from a plot of power returned versus the ice thickness, following Reference VogelWinebrenner and others (2003).
Measured and Modeled Attenuation Rates
Siple Dome
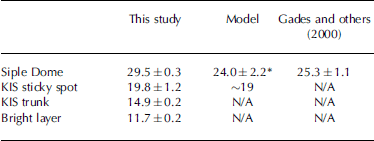
The portion of our long profile that crosses Siple Dome (A–A0 in Fig. 1) provides just such a sub-profile where the bed is relatively uniform and dry (Reference Filina, Blankenshi and YoungGades and others, 2000) and where ice thickness varies by 25%. Figure 2 shows a plot of power returned from the bed as a function of ice thickness for the subset of data from Siple Dome. The received power has been normalized to a constant depth by multiplying by the square of the ratio of depth to the shallowest depth observed, effectively removing the inverse-square losses due to geometric spreading. When plotted on a log scale, the values of normalized power returned from an interface of constant reflectivity should lie along a straight line whose slope is proportional to the depth-averaged attenuation rate. At Siple Dome, the data are fit well by a straight line corresponding to a depth-averaged attenuation rate of 29.5±0.3 dBkm–1 (Table 2). For comparison, Reference Joughin, Tulaczy, MacAyea and EngelhardtMacGregor and others (2007) updated previous estimates of the attenuation rate for a nearby profile on Siple Dome made by Gades and others (2000) and Reference VogelWinebrenner and others (2003), and they calculated a value of 25.3±1.1 dBkm–1 (Table 2). The smaller uncertainty in the present study results from the large number of observations in the dataset (5409) but is not necessarily any more accurate than the lower value. Small-scale variations in the bed reflectivity can still be large (r2 = 0:89), suggesting that there is some variability in the bed reflectivity along the profile.
Values of depth-averaged dielectric attenuation of areas within this study
Log of normalized power received from the bed echo for the profile A–A′ (Fig. 1) as a function of depth to the bed. The best-fit line corresponds to a depth-averaged attenuation rate of 29.5±0.3 dBkm–1. The r2 value for the fit is 0.89.
Reference Joughin, Tulaczy, MacAyea and EngelhardtMacGregor and others (2007) modeled the depth-averaged attenuation rate at Siple Dome using data from the deep core drilled there. This model uses temperature, density and the concentrations of two impurities, acid and sea-salt chloride, to calculate attenuation rates. Higher temperatures, densities and impurity concentrations all result in higher attenuation rates. Using this model, they calculated a depth-averaged value of dielectric attenuation of 24.0±2.2 dBkm–1 at the ice-core site (Table 2). The agreement between the modeled value and the two studies is good considering local variations in the bed reflectivity.
Note: N/A: not applicable.
MacGregor and others (2007).
KIS sticky spot
To estimate the depth-averaged attenuation rate within KIS, we next apply this method to a subset of the bed-reflection data corresponding to the sticky spot (profiles colored in white in Fig. 1 inset). We have chosen this site because we expect the bed reflectivity to be roughly constant over this bedrock rise and because of existing borehole-temperature data. However, we also note that the bed roughness here is greater than anywhere else in the study and should be expected to increase the variability of the returned power. We calculate a depth-averaged attenuation rate of 19.8±1.2 dBkm–1 for the sticky spot (Table 2). The r 2 value for this fit is lower than for the Siple Dome data because of the increased bed roughness, but the error bounds on the attenuation rate are still relatively small because of the large number of observations (5641).
Several boreholes have been drilled in the vicinity of the sticky spot by the California Institute of Technology (CalTech) group (Reference Corr, Moor and NichollsEngelhardt, 2004). Temperature data from two of these boreholes on or near the sticky spot enable us to model attenuation rates there, following Reference Joughin, Tulaczy, MacAyea and EngelhardtMacGregor and others (2007), and thus to better evaluate the accuracy of our radar-derived attenuation rates. Borehole 2000-1 is directly atop the sticky spot, and borehole 2000-9 is on its southern margin (Fig. 1b). We assume that the ice density is constant with depth, which is acceptable because the depth-averaged attenuation rate at large depths is only weakly dependent on the density profile. No ice core exists at either borehole site, so we use the mean impurity concentrations from Siple Dome ((H+) = 1.3 μm, (ssCl–) = 4.2 μm), which is the nearest ice core that has chemistry data through the entire ice thickness. The pure ice component of the attenuation model used here has been modified to use only values of the pure ice component from Reference Jacobel, Scambo, Nereso and RaymondJohari and Charette (1975), which is a preferred source for these values. The formal uncertainty of this modified attenuation model is ~10%, although its true uncertainty is likely larger.
Because density and impurity concentrations are kept constant, the modeled attenuation rates depend only on temperature. The depth-averaged modeled attenuation rates at the bed are virtually identical for both borehole sites (19 dBkm–1), but the values at any given depth differ by several dB km–1. This result is in very good agreement with the radar-derived value. Attenuation rates are lower at KIS than at Siple Dome because of the colder ice advected into KIS from the interior of the WAIS.
KIS trunk
Next, we selected a subset of data corresponding to bed echoes from the 180 km long profile (B–B0) in the KIS trunk (Fig. 1). Again, we initially assume that the bed reflectivity is constant in this section of the ice-stream trunk. The best-fit depth-averaged attenuation rate in the KIS trunk is 14.9±0.2 dBkm–1 (Table 2). The reason this value is lower than that for ice over the sticky spot is probably the presence of yet colder ice that has more recently entered the trunk of KIS from higher elevations inland.
The bright layer
Figure 3 shows the long radar profile that extends from the upstream Lake Camp on KIS to the lower flank of Siple Dome. The bed and several internal reflectors are well depicted throughout this profile, including a prominent internal reflector present at depths equivalent to 50–70% of the ice thickness. This reflector is the ‘bright layer’ detected in many radar profiles across a large portion (>250 000 km2) of the WAIS (Reference Hammer, Clause and LangwaJacobel and Welch, 2005). The bright layer was traced to the Byrd Station ice core, where it coincides in depth with a layer of extremely high acid concentration at 17.5 ka BP (Reference Gow and EngelhardtHammer and others, 1997), which likely resulted from a volcanic eruption of unknown origin. Again, we assume that the reflectivity of the bright layer is constant and obtain a best-fit depth-averaged attenuation rate to this layer of 11.7±0.2 dBkm–1 (Table 2). The lower value than that for the full ice thickness is consistent with expectation that the colder ice in the upper part of the ice sheet will have a lower depth-averaged attenuation rate.
3 MHz radar profile (B–B′–A in Fig. 1) through the KIS trunk from Lake Camp across the margin of Siple Dome. The prominent internal reflector dated at 17.5 ka BP is discussed in the text.
Relative bed reflectivity
We next use the measured values of depth-averaged attenuation rate to examine the variation of relative bed reflectivity throughout our entire KIS radar survey. We plot the normalized values of received power from the bed versus depth for the entire KIS dataset (Fig. 4), instead of a subset focused on a specific region. The slope of constant color in this plot corresponds to a depth-averaged attenuation rate of 15 dB km–1. Change in color in the direction orthogonal to this slope is used here as a relative measure of the basal reflectivity: cool colors represent high bed reflectivities, and warm colors represent low bed reflectivities. Our conclusions from this division into high and low bed reflectivities are insensitive to the depth-averaged attenuation rate, i.e. the constant-color slope, for a reasonable range of values (15–20 dBkm–1).
Normalized received power from the bed vs depth for all KIS radar data collected for this study. The slope of constant color corresponds to a depth-averaged attenuation rate of 15 dBkm–1. Changes in color perpendicular to this slope indicate the relative strength of the basal reflectivity.
Discussion
Figure 5 shows the normalized values of basal reflectivity plotted along the radar profiles using the same color scale as in Figure 4. InSAR-derived surface speeds (Reference Joughin and TulaczykJoughin and others, 1999) are also overlain in color for comparison. As expected, areas of low reflectivity cluster over the sticky spot. Low values also occur in the margins of KIS, where surface speeds drop below 20ma–1. In contrast, the bed under the upstream Lake Camp location is the most highly reflective area in the study. Other areas in the trunk to the north and south of the sticky spot also have high reflectivity values. In general, areas with the highest bed reflectivities correspond to locations with high velocity; conversely, areas with the lowest bed reflectivity have low velocity. However, there are locations, such as the lower trunk of the ice stream on either side of the sticky spot, where reflectivity is relatively high and yet velocity is less than 15 ma–1.
Color map of basal reflectivity along KIS radar profiles using Figure 4 color scale overlain on the map of InSAR velocities (Reference Joughin and TulaczykJoughin and others, 1999) (separate color scale). The highest values of basal reflectivity generally coincide with areas of fast ice flow, whereas the stationary sticky spot has the lowest values of bed reflectivity.
As noted above, borehole 2000-1 is located directly over the sticky spot (Fig. 5). This borehole penetrated to the bed and encountered dry conditions (Reference Corr, Moor and NichollsEngelhardt, 2004) as discussed further by Reference Velicogna and WahrVogel and others (2005). On the other hand, borehole 2000-9, drilled on the southern margin on the sticky spot, intersected more than 1 m of water at the bed (Reference Corr, Moor and NichollsEngelhardt, 2004). This difference in bed conditions between these boreholes is captured by the 20 dB difference in the received power at the bed over a distance of only 3 km (Fig. 5). Based on this ground truth from the boreholes, we interpret low values of bed reflectivity found over the sticky spot and elsewhere as indicative of dry bed conditions similar to those found in borehole 2000-1. Conversely, we interpret areas of high bed reflectivity found in the ice-stream trunk as corresponding to areas where the bed is wet.
It is noteworthy that the region of highest basal reflectivity, the upstream camp site in the northern branch of the KIS trunk, corresponds to both the thickest ice and the highest surface speeds of any location in the study area (>50ma–1; Fig. 5). However, as noted above, we also find moderately high bed reflectivities in areas of the KIS trunk further downstream on both sides of the sticky spot where the ice flows less than 15 ma–1. Even the southern margin of the sticky spot, where water was found in borehole 2000-9, is currently only flowing at speeds of a few ma–1. Clearly, some areas of the trunk that have stagnated have basal conditions conducive to fast ice flow.
These relationships between radar-derived basal conditions and current surface speeds suggest that wet bed is a necessary condition for fast ice flow but that by itself it is not sufficient to cause high ice-flow velocities. This suggests that the primary controls on fast ice flow within KIS may be confined to a few locations, such as the sticky spot. The lower trunk in the vicinity of the sticky spot is currently stagnated (surface speeds <2ma–1), but flowlines in the ice-surface topography visible in satellite imagery (Reference Joughin and TulaczykJoughin and others, 1999) diverge around the sticky spot, suggesting that the KIS stagnation may have begun at this location or, at least, that flow around it continued for some time after ice there had stagnated. Satellite imagery shows other locations where flow appears to diverge around similar features, although they are not as prominent (e.g. Fig. 1).
One hypothesis for KIS stagnation is that loss of water from thin or absent till over bedrock bumps caused freeze-on in one or more locations, and that the ice subsequently stagnated (Reference Anandakrishnan, Alle, Jacobe, Conway, R.B and BindschadleAnandakrishnan and others, 2001). Related hypotheses involve control at the margins and/or changes in the ice-stream configuration, possibly acting together with sticky-spot mechanics (e.g. Reference Jacobel, Gade, Gottschlin, Hodg and WrightJacobel and others, 1996, Reference Jacobel, Scambo, Raymon and Gades2000; Reference Conway, Catani, Raymon, Scambo, Engelhard and GadesConway and others, 2002). Our results are consistent with these hypotheses. High basal reflectivities throughout the stagnated lower trunk of KIS likely indicate that the till there is still wet and thus that motion is controlled by resistive stresses elsewhere.
Because surface speeds in the upper part of KIS are still in excess of 100ma–1, ice is thickening at the head of the section of locked trunk directly upstream from the sticky spot (Reference MacGregor, Winebrenne, Conwa, Matsuok, Mayewsk and ClowPrice and others, 2001; Reference Retzlaff and BentleySmith and others, 2005). A possible outcome of the greater insulation as the ice thickens is increased basal temperatures. This could lead to the bed thawing and reactivation of KIS (e.g. Reference Bougamont, Tulaczy and JoughinBougamont and others, 2003; Reference JoughinJoughin and others, 2004; Reference Velicogna and WahrVogel and others, 2005). A variant on this idea is changes in basal hydrology that are not due to ice thickening, one possibility being enhanced geothermal flux (e.g. Reference EngelhardtFilina and others, 2006; Reference Velicogna and WahrVogel, 2008).
Conclusions
To better constrain basal conditions on KIS, we calculated the depth-averaged attenuation rate in ice at 3MHz at several locations on KIS and Siple Dome (Table 2). These values agree well with temperature-dependent attenuation models for these locations. Differences are primarily due to the source region of the ice and the current dynamic conditions. Using our measured attenuation-rate values, we estimated the relative basal reflectivity of portions of KIS. Areas with the highest bed reflectivities, corresponding to wet basal conditions, also have the highest surface speeds (>100ma–1). The converse situation applies to the region of lowest bed reflectivity, which coincides with a prominent sticky spot. Wet basal conditions are also found throughout much of the stagnated lower trunk of KIS (surface speeds <15ma–1), suggesting that a well-lubricated bed by itself is not sufficient to sustain fast ice flow. These results are consistent with the hypothesis of control on fast motion by one or a few locations, i.e. sticky spots where the ice has become frozen to the bed. These results also raise the possibility that reactivation could occur if thickening ice over the sticky spots enables the bed to warm. Reactivation of KIS would have significant implications for the mass balance of the WAIS, potentially making it more negative by an additional 20 Gt a–1.
Acknowledgements
We thank colleagues from the University of California, Santa Cruz, for assistance in the field, and acknowledge the support of those from Raytheon Polar Support Corporation. Undergraduate students at St Olaf College assisted with parts of the radar data processing and development of the radar system software. This work was supported by US National Science Foundation grant No. 0337567 to St Olaf College.



