Highlights
• P50 gating shows a progressive reduction in EP patients.
• P50 indices are related to real-life functioning in EP cross-sectionally.
• P50 gating is predictive of future functioning at a trend level.
Introduction
Sensory gating (SG) reflects the ability to automatically filter out repetitive or irrelevant sensory stimuli, which is a protective mechanism to screen out flooding of information into higher brain functions (Adler et al., Reference Adler, Pachtman, Franks, Pecevich, Waldo and Freedman1982; Boutros & Belger, Reference Boutros and Belger1999). In auditory event-related potential (ERP) studies, P50 is a typical neurophysiological measure of SG function and can be elicited by a dual-click [conditioning (S1)-testing (S2)] paradigm (Freedman et al., Reference Freedman, Adler, Gerhardt, Waldo, Baker, Rose and Franks1987). Compared with the response to the first stimulus (S1), a diminished response to an identical second stimulus (S2) is indicative of the SG function, which can be quantified by either the S2/S1 ratio or S1-S2 amplitude difference (Smith, Boutros, & Schwarzkopf, Reference Smith, Boutros and Schwarzkopf1994). P50 SG deficits have been widely demonstrated in patients with psychosis, such as schizophrenia (SZ) and bipolar disorder (BP) (Hall et al., Reference Hall, Rijsdijk, Picchioni, Schulze, Ettinger, Toulopoulou and Sham2007, Reference Hall, Chen, Cohen, Spencer, Levy, Ongur and Smoller2015; Hamilton et al., Reference Hamilton, Williams, Ventura, Jasperse, Owens, Miller and Yee2018; Potter, Summerfelt, Gold, & Buchanan, Reference Potter, Summerfelt, Gold and Buchanan2006), as well as in ultra-high risk individuals for psychosis (Chang et al., Reference Chang, Liu, Tian, Wang, Luo, Zhang and Wang2019). A recent meta-analysis reported a significantly diminished P50 SG in both SZ and BP patients and their relatives, compared with healthy controls (HCs) (Atagun et al., Reference Atagun, Drukker, Hall, Altun, Tatli, Guloksuz and van Amelsvoort2020). However, most studies were conducted in chronic patients with psychosis. Literature on the P50 SG in early-stage or first-episode psychosis is sparse (Brockhaus-Dumke et al., Reference Brockhaus-Dumke, Schultze-Lutter, Mueller, Tendolkar, Bechdolf, Pukrop and Ruhrmann2008; Oranje, Aggernaes, Rasmussen, Ebdrup, & Glenthoj, Reference Oranje, Aggernaes, Rasmussen, Ebdrup and Glenthoj2013; Xia et al., Reference Xia, Wang, Wei, Wang, Zhou, Xu and Zhang2021). Despite considerable efforts, inconsistent findings were reported (Arnfred, Chen, Glenthoj, & Hemmingsen, Reference Arnfred, Chen, Glenthoj and Hemmingsen2003; de Wilde, Bour, Dingemans, Koelman, & Linszen, Reference de Wilde, Bour, Dingemans, Koelman and Linszen2007), likely due to heterogeneity in patients and relatively insubstantial samples. Early-stage psychosis, including SZ, BP, schizoaffective disorder, schizophreniform disorder and psychotic disorder not otherwise specified, is typically defined as the first five years of psychosis (Crocker & Tibbo, Reference Crocker and Tibbo2018; Welch & Welch, Reference Welch and Welch2007). Therefore, P50 SG in early psychosis (EP) patients warrants further study.
It is well established that cognitive dysfunction is a critical and enduring feature of psychosis (Kahn & Keefe, Reference Kahn and Keefe2013). Cognitive impairments have already occurred prior to the onset of psychosis (Bora & Murray, Reference Bora and Murray2014), and continued to deteriorate with a long-term progression of the disease (Bora et al., Reference Bora, Lin, Wood, Yung, McGorry and Pantelis2014; Kenney et al., Reference Kenney, Anderson-Schmidt, Scanlon, Arndt, Scherz, McInerney and Cannon2015; Sanchez-Torres et al., Reference Sanchez-Torres, Moreno-Izco, Lorente-Omenaca, Cabrera, Lobo, Gonzalez-Pinto and Group2018). EP patients showed a broad range of cognitive abnormalities, including impairments in working memory, attention, visual memory, verbal learning, and executive functions (Keefe, Reference Keefe2014). SG abnormalities have been hypothesized to be associated with various cognitive impairments. Some have suggested that impaired P50 gating may indicate an overload of the perceptual sensory process leading to cognitive distortion (Greenwood et al., Reference Greenwood, Light, Swerdlow, Calkins, Green, Gur and Braff2016; Postmes et al., Reference Postmes, Sno, Goedhart, van der Stel, Heering and de Haan2014). The critical areas for cognitive performance, such as the hippocampus, prefrontal cortex and thalamus, are involved in the generation of P50 SG (Mayer et al., Reference Mayer, Hanlon, Franco, Teshiba, Thoma, Clark and Canive2009; Williams, Nuechterlein, Subotnik, & Yee, Reference Williams, Nuechterlein, Subotnik and Yee2011). Studies have reported that P50 gating is associated with attention and working memory (Dalecki, Green, Johnstone, & Croft, Reference Dalecki, Green, Johnstone and Croft2016; Hamilton et al., Reference Hamilton, Williams, Ventura, Jasperse, Owens, Miller and Yee2018), but others failed to find a link between P50 suppression and neurocognition (Sanchez-Morla et al., Reference Sanchez-Morla, Santos, Aparicio, Garcia-Jimenez, Soria and Arango2013; Thoma et al., Reference Thoma, Hanlon, Moses, Edgar, Huang, Weisend and Canive2003). Thus, whether SG is associated with domains of neurocognition in EP patients and whether such a relationship, if exists, is stable over time, remains to be resolved.
Social cognition, a multifactorial capacity to understand the context of social interactions (Adolphs, Reference Adolphs2009), may be impaired before the onset of psychosis and throughout the progression of psychosis (Phillips & Seidman, Reference Phillips and Seidman2008; Pinkham et al., Reference Pinkham, Penn, Green, Buck, Healey and Harvey2014). Studies on social cognition, encompassing theory of mind (ToM)/emotions recognition, emotion processing, emotional intelligence and social metacognition, have shown a strong relationship with the functional outcome (Green, Reference Green2016; Javed & Charles, Reference Javed and Charles2018). Both social cognition and neurocognition are independently predictive of functional outcomes in patients with psychosis (Kurtz, Mueser, Thime, Corbera, & Wexler, Reference Kurtz, Mueser, Thime, Corbera and Wexler2015; Santesteban-Echarri et al., Reference Santesteban-Echarri, Paino, Rice, Gonzalez-Blanch, McGorry, Gleeson and Alvarez-Jimenez2017; Sheffield, Karcher, & Barch, Reference Sheffield, Karcher and Barch2018). In first-episode psychosis, social cognition may better predict functioning than neurocognition (Ohmuro et al., Reference Ohmuro, Katsura, Obara, Kikuchi, Sakuma, Iizuka and Matsumoto2016). Moreover, social cognition may mediate the relationship between neurocognition and functional outcome in psychosis (Gonzalez-Ortega et al., Reference Gonzalez-Ortega, Gonzalez-Pinto, Alberich, Echeburua, Bernardo, Cabrera and Selva2020). However, the relationships amongst neurocognition, social cognition and real-life functioning in EP are understudied. To our knowledge, no study has examined the relationships amongst P50 gating, neurocognition, social cognition, and real-life functioning in the same cohort of EP patients.
Longitudinal studies of EP patients provide an important insight into the change of P50 dysfunction over time. During the past two decades, only three longitudinal studies have examined the alterations of P50 SG in EP patients, with inconsistent findings. Oranje et al. (Oranje et al. Reference Oranje, Aggernaes, Rasmussen, Ebdrup and Glenthoj2013) found that deficient P50 gating was already present at baseline in 34 first-episode drug-naive SZ patients. Deficits were significantly improved under a 6-month treatment of Quetiapine (QUE). However, the same research group (During, Glenthoj, Andersen, & Oranje, Reference During, Glenthoj, Andersen and Oranje2014) reported conflicting results in another independent cohort of first-episode drug-naive SZ patients using the same paradigm for a 6-week follow-up. They found that patients had neither P50 gating deficits at baseline nor at follow-up. Hong et al. (Hong et al. Reference Hong, Chan, Zhuang, Jiang, Wan, Wang and Weng2009) reported impaired P50 SG in first-episode drug-naïve SZ patients. However, treatment with typical or atypical antipsychotics had no significant impact on gating over a 6-week observation period. All of these prior studies involved short-term follow-up periods (<6 months) and were designed for evaluating the effects of antipsychotics on P50 SG. Therefore, there is a gap in the literature on naturalistic longitudinal studies in EP patients with follow-up over a longer period, which would provide important insights for understanding the progressive alterations of P50 inhibition.
To the best of our knowledge, no study has comprehensively explored the relationships between P50 SG, neurocognition, social cognition, clinical symptoms, and real-world functioning in EP patients from cross-sectional and longitudinal aspects. In this study, we recruited a unique cohort of transdiagnostic EP patients, with either schizophrenia-spectrum or psychotic bipolar diagnoses, and followed them over a 2-year period. We aimed to: (1) compare P50 ERP indices between EP patients and HCs, as well as different diagnostic groups at baseline and follow-up timepoints; (2) examine the relationships between P50 indices, domains of cognition (neurocognition and social cognition) and real-life functioning at each timepoint; and (3) explore the predictors of the follow-up functional outcomes from baseline variables. Our prior work and others have shown that SG deficit is a useful biomarker (endophenotype) of psychosis (Hall et al., Reference Hall, Schulze, Rijsdijk, Picchioni, Ettinger, Bramon and Sham2006, Reference Hall, Chen, Cohen, Spencer, Levy, Ongur and Smoller2015; Hall, Taylor, Salisbury, & Levy, Reference Hall, Taylor, Salisbury and Levy2011). We hypothesized that P50 gating would be impaired at baseline in both SZ and BP patients and that impairments would be stable over time. In addition, we hypothesized that P50 gating would be significantly associated with psychosocial cognition and real-world functioning at each timepoint. Finally, baseline P50 gating would be predictive of real-world functioning at follow-up.
Methods
Participants
A total of 167 individuals (79 EP patients and 88 age- and sex-matched HCs) were recruited at baseline. Among patients, eight were treated with Clozapine at baseline and were excluded (Micoulaud-Franchi et al., Reference Micoulaud-Franchi, Aramaki, Geoffroy, Richieri, Cermolacce, Faget and Vion-Dury2015; Nagamoto et al., Reference Nagamoto, Adler, Hea, Griffith, McRae and Freedman1996), leaving a final sample of 71 EP patients (25 SZ spectrum disorder and 46 BP patients). Thirty-three and 20 EP patients completed a 12-month and 24-month follow-up session, respectively. EP subjects met the criteria for diagnoses according to the Structured Clinical Interview for DSM-IV (SCID). The inclusion criteria were as follows: (1) aged from 18–45 years old; (2) diagnosed with SZ, schizoaffective disorder, schizophreniform disorder, psychotic disorder NOS, psychotic depression, or psychotic BP; (3) confirmed within the first 3 years of the illness onset; (4) Intelligence quotient (IQ) >70; (5) fluency in English. Exclusion criteria included: (1) organic brain diseases; (2) brain injury; (3) severe physical diseases; (4) hearing impairments; (5) electroconvulsive therapy (ECT) in the past 6 months; (6) pregnant women. None of the HCs had a personal or family history of psychotic disorders, substance abuse or previous chronic dependence.
All EP patients came from outpatient clinics and inpatients units at Mclean Hospital by posted flyers or physician referrals. Patients were clinically stable at the time of assessments. HCs were recruited from the Partners Research Portal. The research protocol was approved by the Institutional Ethical Review Board of Mclean Hospital. Informed consent was obtained from all participants.
Study design
This is a 2-year longitudinal and naturalistic study. All the assessments and P50 sensory recordings from patients were performed at three timepoints: baseline, 12 months and 24 months. All HCs were evaluated at baseline. To ensure no major changes in HCs over time, a sub-sample (N = 22) was re-evaluated at 12 months. There were no significant changes between the baseline and 12 months of HCs (online Supplementary Table S1). Thus, baseline data (N = 88) was used for the analyses to optimize statistical power.
Clinical assessments
Medication and clinical measures, consisting of the Montgomery-Asberg Depression Rating Scale (MADRS) (Montgomery & Asberg, Reference Montgomery and Asberg1979), the Young Mania Rating Scale (YMRS) (Young, Biggs, Ziegler, & Meyer, Reference Young, Biggs, Ziegler and Meyer1978) and the Positive and Negative Syndrome Scale (PANSS) (Kay, Fiszbein, & Opler, Reference Kay, Fiszbein and Opler1987), were obtained at each assessment timepoint. Intellectual abilities were estimated using the North American Adult Reading Test (NAART) (Blair & Spreen, Reference Blair and Spreen1989). The antipsychotic dosage was converted into chlorpromazine (CPZ) equivalences (Gardner, Murphy, O'Donnell, Centorrino, & Baldessarini, Reference Gardner, Murphy, O'Donnell, Centorrino and Baldessarini2010).
Real-life functional assessments
An abbreviated version of the Multnomah Community Ability Scale (MCAS) (Barker, Barron, McFarland, Bigelow, & Carnahan, Reference Barker, Barron, McFarland, Bigelow and Carnahan1994) was administered to assess community functioning. MCAS evaluates various aspects of community functioning in patients with psychosis, such as independence in daily living, or social involvement and interest (Lewandowski, Cohen, Keshavan, Sperry, & Ongur, Reference Lewandowski, Cohen, Keshavan, Sperry and Ongur2013; Monaghan, Brickman, Huynh, Ongur, & Hall, Reference Monaghan, Brickman, Huynh, Ongur and Hall2019; Zhou et al., Reference Zhou, Mueller, Spencer, Mallya, Lewandowski, Norris and Hall2018). The MCAS consisted of 11 items scored 1–5, and a higher score indicated better functioning. In addition, the social factor and independence-money (IndeMoney) factor were derived from the MCAS (Martin, Ongur, Cohen, & Lewandowski, Reference Martin, Ongur, Cohen and Lewandowski2015).
The psychosocial functioning was evaluated using the Global functioning (GF): Social (GFS) and Role (GFR) (Cornblatt et al., Reference Cornblatt, Auther, Niendam, Smith, Zinberg, Bearden and Cannon2007). These two scales were designed to assess two distinct domains of functioning and to minimize confusion with psychiatric symptoms (Carrion et al., Reference Carrion, Auther, McLaughlin, Olsen, Addington, Bearden and Cornblatt2019; Cornblatt et al., Reference Cornblatt, Auther, Niendam, Smith, Zinberg, Bearden and Cannon2007).
Neurocognition and social cognition assessments
Neurocognition was evaluated using the MATRICS Consensus Cognitive Battery (MCCB) (Nuechterlein et al., Reference Nuechterlein, Green, Kern, Baade, Barch, Cohen and Marder2008), which consisted of seven cognitive domains, including Processing Speed, Attention, Working Memory, Verbal Learning, Visual Learning, Problem Solving and Social Cognition. Standardized T-scores of each sub-scores and a Composite score were used (Nuechterlein et al., Reference Nuechterlein, Green, Kern, Baade, Barch, Cohen and Marder2008).
Social cognition was assessed using the Awareness of Social Inference Test (TASIT) (McDonald, Flanagan, Rollins, & Kinch, Reference McDonald, Flanagan, Rollins and Kinch2003) and the Mayer Salovey Caruso Emotional Intelligence Test (MSCEIT) from the MCCB. TASIT focuses on measuring social reasoning or ToM.
P50 SG recording and off-line data processing
Each participant was prohibited from smoking 40 min prior to electrophysiological recordings. The EEG recording and testing procedures were the same as our previous studies (Hall et al., Reference Hall, Schulze, Rijsdijk, Picchioni, Ettinger, Bramon and Sham2006, Reference Hall, Taylor, Salisbury and Levy2011, Reference Hall, Levy, Salisbury, Haddad, Gallagher, Lohan and Smoller2014, Reference Hall, Chen, Cohen, Spencer, Levy, Ongur and Smoller2015). Briefly, all subjects had a brief audiometric test before the recording to exclude hearing impairment. The recording environment was quiet and in dim light. During the recording, the participants sat comfortably in a chair and relaxed. They were asked to keep their eyes open, look at a fixation point, and avoid blinking during the auditory stimuli. EEG was recorded using the BioSemi Active Two system with a 64-channel electrode cap at a digitization rate of 512 Hz, with a bandpass of DC-104 Hz and a Common Mode Sense (CMS) as the reference (PO2 site). Blinks and eye movements were monitored through electrodes placed on the left outer canthi (HEOG) and below the left eye (VEOG). The EEG data were re-referenced off-line to the averaged mastoid. The SG ERP was elicited using the dual-click paradigm (120 pairs of identical clicks, 5-ms duration; 2-ms rise/ fall; 500-ms inter-click interval; 10-s inter-trial interval) (Adler et al., Reference Adler, Olincy, Waldo, Harris, Griffith, Stevens and Freedman1998; Clementz, Geyer, & Braff, Reference Clementz, Geyer and Braff1998b).
Signal processing was performed offline using BrainVision Analyzer 2.2 (Brain Products, Germany) software. Signal processing procedures were implemented according to our established methods (Hall et al., Reference Hall, Schulze, Rijsdijk, Picchioni, Ettinger, Bramon and Sham2006, Reference Hall, Taylor, Salisbury and Levy2011, Reference Hall, Chen, Cohen, Spencer, Levy, Ongur and Smoller2015). This approach has been shown to have a good test re-test reliability (Hall et al., Reference Hall, Schulze, Rijsdijk, Picchioni, Ettinger, Bramon and Sham2006) and is consistent with others (Olincy et al., Reference Olincy, Braff, Adler, Cadenhead, Calkins, Dobie and Freedman2010). Continuous EEG signals were segmented (−100-400 ms), filtered (1-Hz high-pass filter), baseline corrected using the pre-stimulus interval, and artifact rejected if activity exceeded 50 mV between 0 and 75 ms post-stimulus. In each participant, the rejected trials accounted for less than 10% of the total trials of S1 and S2, respectively. There were no significant differences in the number of rejected trials between the EP patients and controls at any timepoint (p > 0.1). S1 and S2 waveforms were respectively averaged, digitally filtered (10-Hz high pass, 24 dB/oct with zero phase shift), and a 7-point moving average was applied twice (smoothing). The resulting bandwidth (10–100 Hz) has been previously shown to allow optimal resolution of the P50 component (Boutros, Zouridakis, Rustin, Peabody, & Warner, Reference Boutros, Zouridakis, Rustin, Peabody and Warner1993; Clementz, Blumenfeld, & Cobb, Reference Clementz, Blumenfeld and Cobb1997; Haenschel, Baldeweg, Croft, Whittington, & Gruzelier, Reference Haenschel, Baldeweg, Croft, Whittington and Gruzelier2000). P50 waveforms were scored from vertex (Cz site), which was the optimal site for quantifying SG (Clementz, Geyer, & Braff, Reference Clementz, Geyer and Braff1998a; Hall et al., Reference Hall, Schulze, Rijsdijk, Picchioni, Ettinger, Bramon and Sham2006). The S1 amplitude was defined as the largest ERP wave (peak-trough) in the 45–85 ms post-stimulus window. The S2 amplitude was the largest wave (peak-trough) after the second stimulus with latency closest to the S1 waveform (Hall et al., Reference Hall, Schulze, Rijsdijk, Picchioni, Ettinger, Bramon and Sham2006, Reference Hall, Taylor, Salisbury and Levy2011). P50 SG was calculated as either the ratio (S2/S1) × 100 or the difference in S1 and S2 amplitudes (S1-S2) (Dalecki, Croft, & Johnstone, Reference Dalecki, Croft and Johnstone2011; Fuerst, Gallinat, & Boutros, Reference Fuerst, Gallinat and Boutros2007). A higher ratio (S2/S1) or smaller S1-S2 difference reflects more impairment in SG. P50 scoring was performed blind to group membership and independently verified by two researchers (M. H. and S. L.).
Statistical analysis
Statistical analyses were carried out using STATA 15 (StataCorp, College Station, Texas). Prior to analyses, each variable was checked for normality in each group at each timepoint (Kolmogorov Smirnov one-sample test; all p > 0.05). To investigate differences between patients and controls (SZ, BP, HC) at each time-point (aim 1), we used Chi-squared test or analysis of variance (ANOVA) among the comparisons of demographic and clinical variables. Post-hoc comparisons were Bonferroni corrected. Also, we used linear regression models to examine group differences in each of the P50 indices (ratio, S1-S2 difference, S1 amplitude or S2 amplitude) at each timepoint and diagnostic specificity (SZ v. BP), controlling for age and sex as well as linear mixed effect models to examine longitudinal changes of P50 indices (ratio or S1-S2 difference) at baseline, 12-month and 24-month follow-up in patients. Bonferroni corrections were applied in both linear regression and linear mixed effect models to counteract multiple testing.
To explore the relationships between P50 indices, clinical symptom severity (PANSS), neurocognition, social cognition and real-world functioning at each time point (aim 2), we used stepwise linear regression and partial correlational analyses controlling for significant predictors in the regression model to quantify the strength of associations, separately estimated for total participants, EP patients and HCs. In the stepwise regression model, each of the P50 indices (ratio, S1-S2 difference, S1 amplitude or S2 amplitude) was the outcome variable, neurocognition (MCCB composite or sub-domains), social cognition (TASIT, MCCB-Social) and real-world functioning (MCAS, GFR, GFS) were entered as predictors, including age and sex as covariates. Three separate analyses were run, one for each time point. Clinical symptom severity (PANSS total score) and CPZ were included as covariates in the regression models of EP patients. The significance level was set to be p-uncorrected ⩽0.05.
Finally, to investigate the ability of baseline variables (SG indices, neurocognition, and symptom severity) predicting functional outcomes at a 12-month timepoint (aim 3), we ran stepwise regression models. In these models, baseline P50 indices (ratio or S1-S2 difference), neurocognition (MCCB composite) and symptoms (PANSS total score) were the predictors, and 12-m follow-up functioning (MCAS, GFR, or GFS) was the outcome variable, including age and sex as covariates. Education was initially included as a covariate but was not a significant predictor at either timepoint and was therefore dropped from the models. Due to relatively small sample size at 24-month, prediction models were not performed.
Results
Demographics and clinical variables
Table 1A-1B shows the demographic and clinical information at baseline and follow-up. The EP patients had significantly more smokers compared with HCs (p = 0.001). Among EP patients, SZ patients showed significantly lower educational levels, higher PANSS total score, negative symptom score and general psychopathology score compared with those in BP patients (all p < 0.05).
Demographic characteristics and clinical symptoms of HCs and EP patients (SZ and BP) at baseline and follow-up

Abbreviations: EP, early psychosis; SZ, schizophrenia; BP, bipolar disorder; NAART, North American Adult Reading Test; PANSS, Positive and Negative Syndrome Scale; P, Positive symptom; N, Negative symptom; G, General psychopathology; YMRS, Young Mania Rating Scale; MADRS, Montgomery-Asberg Depression Rating Scale.
Data presented as mean ± standard deviation or n (%).
Significant differences are highlighted in bold.
Asterisk indicates the significance of the comparisons between EP and HCs, ***p < 0.001.
Group comparisons of P50 indices
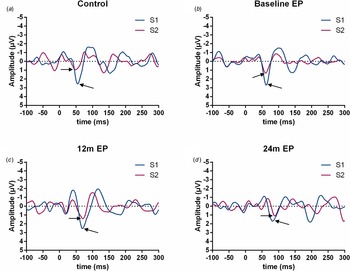
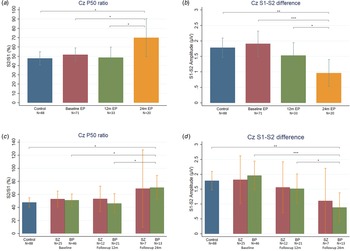
Fig. 1A–D shows examples of P50 waveforms for HCs and EP patients at each time point. At baseline and 12-m timepoint, there were no significant differences in P50 ratio and S1-S2 difference between EP patients and HCs (Fig. 2A–B), whereas at 24- month there were significant group differences (EP v. HCs) in both P50 ratio (t = −2.16, p = 0.041) and S1-S2 difference (t = 3.16, p = 0.003). Among the EP patients, P50 ratio significantly increased at 24-month follow-up (baseline v. 24-m: β = 15.90, p < 0.05; 12-m v. 24-m: β = 17.28, p = 0.03) (Fig. 2A); S1-S2 difference significantly decreased over time (baseline v. 24-m: β = −0.93, p < 0.001; 12-m v. 24-m: β = −0.61, p = 0.01) (Fig. 2B). The effect sizes of SG changes of EP patients and controls who had follow-up data were presented in online Supplementary Table S7.
Typical ground P50 waveforms of S1 (blue) and S2 (red) for HCs (A), EP at baseline (B), 12-m follow-up (C) and 24-m follow-up (D). Abbreviations: EP, early psychosis; S1, the first stimulus; S2, the second stimulus.

Comparisons of P50 ratio (left) S1-S2 (right) by group and diagnosis. A) Average P50 ratio for control (blue), EP at baseline (red), 12-m follow-up (green) and 24-m follow-up (orange); B) Same as A but for average P50 S1-S2; C) Average P50 ratio for different diagnostic groups at different timepoints: control (blue), SZ at three timepoints (red), and BP at three timepoints (green); D) Same as C but for average P50 S1-S2. Note: vertical bars represent standard errors, *p < 0.05; **p < 0.01; ***p < 0.001. Abbreviations: EP, early psychosis; SZ, schizophrenia; BP, bipolar disorder, S1, the first stimulus; S2, the second stimulus.

Comparisons by the diagnostic group (SZ v. BP) showed that there were no significant differences in P50 ratio and S1-S2 difference, neither at baseline nor follow-up (Fig. 2C and D). However, in BP patients, P50 ratio significantly increased/worsened at 24-month timepoint (baseline v. 24-m: β = 18.73, p = 0.04; 12-m v. 24-m: β = 20.51, p = 0.02) (Fig. 2C) and S1-S2 difference showed a significant gradual reduction (baseline v. 24-m: β = −1.10, p = 0.001; 12-m v. 24-m: β = −0.65, p = 0.03) (Fig. 2D). In SZ patients, there were no significant alterations over time. Online Supplemental Fig. 1A–F showed examples of P50 waveforms of SZ and BP patients at each time point.
Group comparisons of functioning, social cognition and neurocognition
At baseline, EP patients showed a significant decrease in most of the cognitive and functioning domains compared with HCs (all p < 0.05), except for Verbal, Visual, Solving and TASIT (Table 2A). Post hoc analyses revealed that SZ and BP patients did not differ in MCCB total, Processing sub-score, Attention sub-score, GFS, GFR, MCAS total, MCAS-Social sob-score, and MCAS-IndeMoney sub-score. SZ patients in addition differed from HCs in the Memory, Visual and Social domains of MCCB (all p < 0.05). At 12-month follow-up, EP patients continued to show a significant decrease in neurocognition (MCCB total, Attention, Verbal), and all functioning measures (GFS, GFR, MCAS total, MCAS-Social, and MCAS-IndeMoney) (all p < 0.05) (Table 2B). At 24-m follow-up EP patients had significantly impaired real-life functioning across all functioning measures (all p < 0.05) (Table 2B).
Cognitive and functional measures between EP patients (SZ and BP) and HCs at baseline and follow-up

Abbreviations: EP, early psychosis; SZ, schizophrenia; BP, bipolar disorder; MCCB, Measurement and Treatment Research to Improve Cognition in Schizophrenia (MATRICS) Consensus Cognitive Battery; TASIT, Awareness of Social Inference Test; GFS, the Global Functioning Scale-Social; GFR, the Global Functioning Scale-Role; MCAS, Multnomah Community Ability Scale; IndeMoney, independence-money.
Data presented as mean ± standard deviation.
Significant differences are highlighted in bold.
a The Post-hoc analysis results are presented after Bonferroni correction.
b The comparisons between EP at 12-m follow-up and HCs at baseline.
c The comparisons between EP at 24-m follow-up and HCs at baseline.
P50 indices in relationship with functioning, social cognition and neurocognition
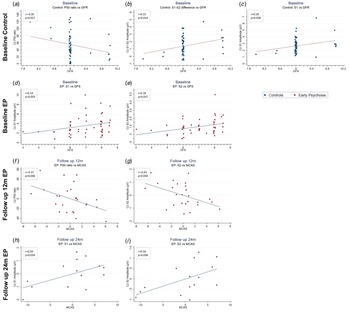
The stepwise regression results were presented in online Supplementary Table S4. At baseline, P50 S2/S1 ratio (partial correlation = −0.30, p = 0.027), S1-S2 difference (partial correlation = 0.33, p = 0.014) and S2 amplitude (partial correlation = 0.28, p = 0.038) were significantly associated with GFR in HCs (Fig. 3A–C). In EP patients, S2 amplitude was significantly associated with GFS (partial correlation = 0.18, p = 0.037) (Fig. 3E). In addition, S1 amplitude was associated with GFS at a trend level (partial correlation = 0.14, p = 0.059) (Fig. 3D).
Correlations between P50 indices and functioning measures at baseline and 12-month follow-up for EP patients and controls. Note: Figure 3F and G are residual plots adjusted by the Positive and Negative Syndrome Scale (PANSS) and chlorpromazine (CPZ). Red dots represent patients with early psychosis, and blue dots represent HCs. Abbreviations: EP, early psychosis; MCAS, Multnomah Community Ability Scale; GFR, the Global Functioning Scale-Role; GFS, the Global Functioning Scale-Social.

At 12-month follow-up, P50 S2/S1 ratio in EP patients was negatively associated with MCAS (partial correlation = −0.37, p = 0.046) (Fig. 3F); and S2 amplitude was significantly associated with MCAS (partial correlation = −0.45, p = 0.034) (Fig. 3G). At 24-month follow-up, S1 was positively associated with MCAS (partial correlation = 0.59, p = 0.034) (Fig. 3H). Also, S2 amplitudes were positively associated with MCAS (partial correlation = 0.56, p = 0.038) (Fig. 3I). Interrelationships among neurocognition, social cognition and functioning measures were shown in supplementary materials (online Supplementary Table S5). PANSS total score was significantly associated with P50 ratio at 12-month (partial correlation = −0.53, p = 0.02) and with S2 amplitude at 12-month (partial correlation = −0.55, p = 0.02).
Predictions of 12-month real-world and social functioning in EP patients
In EP patients, baseline S1-S2 difference was a predictor of 12-month GFS (β = 0.21, t = 2.01, p = 0.059) or MCAS (β = 0.70, t = 1.93, p = 0.063) at trend levels. In addition, baseline PANSS total score was predictive of 12-month GFR (β = −0.04, t = −3.14, p = 0.006) and GFS (β = −0.05, t = −2.96, p = 0.008), while baseline composite neurocognition was predictive of 12-month GFR at a trend level (β = −0.04, t = −2.03, p = 0.057) (online Supplementary Table S6).
Discussion
The early phase of psychosis offers a potential ‘window of opportunity’ during which treatment may achieve disproportionately favorable outcomes (Lieberman, Small, & Girgis, Reference Lieberman, Small and Girgis2019). Thus, there is a pressing need to find neurobiological biomarkers that are associated with or predictive of later functional outcomes. To our knowledge, this study is the first to investigate the longitudinal associations between P50 SG, clinical symptoms, neuro- and social- cognition, and real-life functioning in a unique cohort of EP patients over a 24-month follow-up period. In the present study, we found that EP patients did not have significant SG deficits at study entry but had a progressive impairment over time, particularly pronounced in BP patients. EP patients, regardless of diagnosis, exhibited extensive deficiencies in neurocognition, social cognition and real-life functioning across all three time points. P50 SG and its amplitudes were significantly associated with real-life functioning cross-sectionally, at baseline and follow-up. Baseline symptom severity was predictive of 12-month follow-up real-life and social functioning. In addition, baseline S1-S2 difference could independently predict 12-month follow-up functional outcomes at trend levels.
P50 gating in EP patients
Contrary to our hypothesis and the majority of previous findings (Atagun et al., Reference Atagun, Drukker, Hall, Altun, Tatli, Guloksuz and van Amelsvoort2020; Cheng, Chan, Liu, & Hsu, Reference Cheng, Chan, Liu and Hsu2016), P50 gating function (both S2/S1 and S1-S2) in EP patients did not significantly differ from those in HCs at baseline, neither in SZ nor in BP patients. One possible explanation may be that our patients were young and had a short duration of illness. These characteristics are similar to patient cohorts of two other studies reporting intact gating (Arnfred et al., Reference Arnfred, Chen, Glenthoj and Hemmingsen2003; de Wilde et al., Reference de Wilde, Bour, Dingemans, Koelman and Linszen2007). The average age of EP patients in our study was 22.77 ± 3.19 years old, which was much younger than those reported in the literature. In a recent report, Lemvigh et al. (Lemvigh et al. Reference Lemvigh, Jepsen, Fagerlund, Pagsberg, Glenthoj, Rydkjaer and Oranje2020) also failed to detect P50 abnormalities in 55 adolescents with EP, with an age range (12–17 years old). Another possible explanation may be due to medication effects. Although we excluded 8 patients receiving CLO treatment due to its effect on normalizing SG (Micoulaud-Franchi et al., Reference Micoulaud-Franchi, Aramaki, Geoffroy, Richieri, Cermolacce, Faget and Vion-Dury2015), all patients in the study were medicated with psychotropic medications (e.g. antipsychotics, mood stabilizers, antidepressants). Although CPZ dose was included as a covariate, it is difficult to assess the combined effects of psychotropic medication on ERPs. Finally, it is worth noting that patients, particularly SZ, had much higher MATRICS scores than what would typically be observed in EP patients (McCleery et al., Reference McCleery, Ventura, Kern, Subotnik, Gretchen-Doorly, Green and Nuechterlein2014), suggesting our patients having a relatively intact cognitive profile, and that about two-third of the patient sample in this study involves psychotic BP diagnosis. These sample characteristics may account for the lack of SG deficit at baseline.
The observation that S1-S2 gating in EP patients was worsening over time and became significantly impaired at 24-month (Fig. 2B and D), suggests that medication may have a short-term effect on normalizing gating (Adler et al., Reference Adler, Olincy, Cawthra, McRae, Harris, Nagamoto and Freedman2004; Light, Geyer, Clementz, Cadenhead, & Braff, Reference Light, Geyer, Clementz, Cadenhead and Braff2000). To date literature reports were inconsistent. Oranje et al. (Oranje et al. Reference Oranje, Aggernaes, Rasmussen, Ebdrup and Glenthoj2013) reported a normalization on P50 gating under 6-month treatment of QUE; while the other two studies found no impact of other antipsychotics for 6-week (During et al., Reference During, Glenthoj, Andersen and Oranje2014; Hong et al., Reference Hong, Chan, Zhuang, Jiang, Wan, Wang and Weng2009). To what extent differences in medication, duration of intervention, or patient characteristics impact on the brain is not clear and requires further studies to clarify. In addition, although we did not observe significant alterations overtime in SZ patients, the trajectory of P50 gating in SZ patients was consistent with that in BP patients. Insufficient statistical power in the SZ group is thus the most likely explanation.
P50 gating in relationship with neurocognition, social cognition and functioning
The present study revealed significant associations between P50 indices (ratio, S1-S2 difference and S1 amplitude) and real-life functioning (GFR) in controls (Fig. 3A–C), such that better SG or larger S1 amplitude is associated with better role functioning. Also, in EP patients larger S1 amplitude and S2 amplitude were associated with better functioning relevant to the social domain (GFS) at baseline (Fig. 3D and E) and real-life functioning (MCAS) at 24-m follow-up (Fig. 3H and I). Furthermore, better SG and smaller S2 amplitude were associated with an overall real-life function (MCAS) at 12-m follow-up (Fig. 3F and G). Till now, the relationships among P50 suppression, psychosocial, and global functioning have rarely been studied. Only one study reported that P50 gating deficits were related to poor community outcomes in SZ patients, using GF (interpersonal relationships and intrapsychic foundations) (Santos et al., Reference Santos, Sanchez-Morla, Aparicio, Garcia-Jimenez, Villanueva, Martinez-Vizcaino and Arango2010). Our results provide additional novel insights that SG, both ratio and/or S1-S2 difference measures, appears to be linked to occupational functioning in controls and overall real-life functioning in patients, while S1 and S2 amplitudes seem to be associated with the social functioning domain. Notably, S2 amplitude showed an opposite direction of association with MCAS at 12-m and 24-m follow-up (Fig. 3G and I). We hypothesize that differences in associations with clinical symptoms at different time-points may affect the relationship between S2 amplitudes and functioning. For example, S2 amplitude was significantly and negatively correlated with MADRS at 12-month (r = −0.42, p = 0.02) while it was positively correlated with MADRS at 24-month (r = 0.20, p = 0.43). The correlation with MADRS is likely to have an effect in the stepwise regression models. These results, if replicated in future larger samples, offer a possibility of using P50 SG as a potential neurobiological biomarker for probing functional outcomes in EP patients.
Studies in chronic SZ reported relationships between P50 sensory dysfunction and neurocognitive impairments, involving attention, working memory and processing speed (Dalecki et al., Reference Dalecki, Green, Johnstone and Croft2016; Smith et al., Reference Smith, Edgar, Huang, Lu, Thoma, Hanlon and Canive2010; Thoma et al., Reference Thoma, Hanlon, Moses, Edgar, Huang, Weisend and Canive2003). However, studies using standardized measures from MCCB (Nuechterlein et al., Reference Nuechterlein, Green, Kern, Baade, Barch, Cohen and Marder2008) revealed mixed results. Hamilton HK et al. (Hamilton et al. Reference Hamilton, Williams, Ventura, Jasperse, Owens, Miller and Yee2018) found that P50 abnormalities were related to poorer performance in attention, working memory and processing speed; whereas Sánchez-Morla et al. (Sanchez-Morla et al. Reference Sanchez-Morla, Santos, Aparicio, Garcia-Jimenez, Soria and Arango2013) reported no evidence of associations between P50 gating and cognitive measures in SZ patients. In the present study, we also failed to detect a relationship between P50 SG and neurocognition from MCCB in EP patients. EP patients showed widespread and persistent neurocognitive impairments while presenting normal P50 gating at baseline and dysfunction at a later timepoint. This is consistent with the null association, suggesting separate brain circuitries responsible for P50 and neurocognition. Our results also indicate that there are no significant relationships between P50 indices and social cognition. Therefore, the relationships between P50 gating and functioning observed in this study appear to be independent of the well-documented relationships among social cognition, neurocognition and functioning in patients with psychosis.
Predictions of real-world functioning at follow-up
We found that baseline S1-S2 difference was an independent predictor of later real-life functioning (MCAS or GRS) at a trend level. The trending significance is most likely due to an insufficient follow-up sample (N = 33) which compromised the statistical power. We plan to collect a larger sample in the future to confirm this important result. Finding a robust neurobiological predictor of follow-up real-life functioning in EP is critically important as one can use clinically useful biomarkers to develop individually tailored and effective treatment approaches. In addition to S1-S2 difference, baseline symptoms severity and neurocognition were also independent predictors of 12-month functional outcomes, consistent with other reports (Carlson, Kotov, Chang, Ruggero, & Bromet, Reference Carlson, Kotov, Chang, Ruggero and Bromet2012; Ventura, Hellemann, Thames, Koellner, & Nuechterlein, Reference Ventura, Hellemann, Thames, Koellner and Nuechterlein2009).
Limitations
There were a number of limitations to the current study. First, the attrition rate is high. This is because data collection was interrupted due to the COVID-19 pandemic. As a result, many subjects were unable to come back for their 12-m or 24-m follow-up. However, comparisons between patients with and without follow-up data indicate no evidence of attrition bias (online Supplementary Tables S2 and S3). A reduced follow-up sample size limited our ability to detect significant changes in patients at 12 m even though patients had smaller S1-S2 difference at 12-month (Fig. 2B and D), and to comprehensively address our hypotheses performing prediction models at 24-month. Also, we were unable to examine the potential effects of other medication categories on P50. Furthermore, controls were not followed at 24 months. Without controls as a reference, it is difficult to determine whether the long-term changes in EP patients were influenced by other underlying factors. Fourth, some clinical information was not collected, such as the course of diagnoses over time and the therapeutic approaches during the follow-up period. Finally, EP patients are highly heterogeneous, and patients in our study showing normal SG at baseline may be a subgroup and do not necessarily represent a broader EP patient population.
Conclusion
In summary, our findings indicated a link between P50 SG indices and real-world functioning. These novel findings provide greater insights into the role of P50 gating in the underlying pathophysiological mechanisms of EP.
Supplementary material
The supplementary material for this article can be found at https://doi.org/10.1017/S0033291721004463.
Acknowledgements
We would like to thank the participants who took part in the study.
Author contributions
Study concept and design: Mei-Hua Hall.
Acquisition and interpretation of data: Amy Higgins, Shi Yu Chan, Shen Li, Mei-Hua Hall.
Statistical analysis: Shen Li, Mei-Hua Hall.
Drafting of the manuscript: Shen Li, Mei-Hua Hall.
Critical revision of the manuscript for important intellectual content: All authors.
Study supervision: Mei-Hua Hall.
Financial support
This study is supported by the National Institute of Mental Health (NIMH), USA [R01MH109687]: Mei-Hua Hall, PI.
SL is supported by the China Scholarship Council (CSC) [201906940010].
Conflict of interest
The authors state that they have no conflicts of interest.
Ethical standards
The protocol for the research project had been performed in accordance with the ethical standards laid down in the 1964 Declaration of Helsinki and its later amendments, as revised in 2008.