


Food characterisation and authentication represent important strategic issues for the food industry in fact there is an increasing demand to have a means of measurement allowing the characterisation of raw materials or food. In recent years species identification in animal products has received increasing attention, with particular reference to dairy products because in many European countries it is mandatory to state the type of milk used for manufacturing cheese or other dairy products (European Communities, 2001). Regulatory authorities, distributors, industry, consumers are all interested in guaranteeing that foods are correctly labelled, in fact it is important to detect fraudulent procedures not only for commercial scope but also for health reason; for example, some milk proteins frequently trigger human adverse reactions (Karoui & DeBaerdemaeker, Reference Karoui and De Baerdemaeker2006). A common food adulteration implicates illegal addition of less expensive milk, like cow milk, to ewe, goat and donkey milks which have a higher commercial value, for example sheep milk contains higher levels of total solids than cow milk (Park et al. Reference Park, Juárez, Ramos and Haenlein2007).
Until now many analytical methods for species identification in milk have been applied using proteins and DNA as target analytes as well as lipid fraction. As regards proteins, chromatography, electrophoresis and immunoassays have been applied. Rodríguez et al. (Reference Rodríguez, Ortiz, Sarabia and Gredilla2010) for example have used liquid chromatography with diode-array detection in order to obtain chromatographic profiles of cheese and milk proteins to verify possible frauds. With the same purpose, Pesic et al. (Reference Pesic, Barac, Vrvic, Ristic, Macej and Stanojevic2011) have used native polyacrylamide gel electrophoresis method for the simultaneous qualitative and quantitative analysis of bovine milk adulteration in caprine and ovine milk using whole milk samples as well as their whey protein fraction. Costa et al. (Reference Costa, Ravasco, Miranda, Duthoit and Roserio2008) have evaluated and validated a commercial ELISA method for quantitative determination of adulterations of ewe milk and cheese with cow or goat milks.
Alternatively, DNA based methods, such as polymerase chain reaction (PCR), have been used because of their sensitivity, reproducibility and simplicity. Bottero et al. (Reference Bottero, Civera, Numera, Rosati, Sacchi and Turi2003) developed a multiplex PCR, a rapid method to detect in a single step three different milk species (cow, goat and sheep) in cheeses. Similarly, De et al. (Reference De, Brahma, Polley, Mukherjee, Banerjee, Gohaina, Singh, Singh, Datta and Goswami2011) amplified a fragment of the mitochondrial DNA D loop region by PCR to detect cattle and buffalo milk samples and cheeses of bovine and buffalo origin.
On the other hand lipid fraction has been analysed by 13C and 1H nuclear magnetic resonance (NMR) spectroscopy (Andreotti et al. Reference Andreotti, Trivellone, Lamanna, Di Luccia and Motta2000; Brescia et al. Reference Brescia, Mazzilli, Sgaramella, Ghelli, Fanizzi and Sacco2004) and above all by chromatography coupled with statistical analysis. Goudjil et al. (Reference Goudjil, Fontecha, Fraga and Juárez2003) have examined known mixtures of lard, palm oil and cow milk fat with ewe milk fat in order to detect the presence of foreign fats in ewe milk using gas-chromatographic (GC) analysis of triacylglycerols (TAG). Similarly Fontecha et al. (Reference Fontecha, Mayo, Toledano and Juárez2006) have studied the adulteration of two Protected Designation of Origin cheeses with unknown fats, during the ripening period, by GC analysis of TAG composition. The data were processed with multiple regression equations. Blasi et al. (Reference Blasi, Montesano, De Angelis, Maurizi, Ventura, Cossignani, Simonetti and Damiani2008) have reported TAG stereospecific analysis data of milk fat from different mammalian species (cow, ewe, goat, buffalo and donkey) and have showed the non-random distribution of the fatty acid (FA) on the glycerol backbone of TAG. Cow and donkey pure milks and their mixtures have been characterised and differentiated by applying linear discriminant analysis (LDA) to TAG stereospecific analysis data (Cossignani et al. Reference Cossignani, Blasi, Bosi, D'Arco, Maurelli, Simonetti and Damani2011).
The aim of this work was to classify and discriminate pure milks (cow, ewe, buffalo, donkey, goat) and to characterise cow–ewe milk mixtures (1, 3, 5% cow added to ewe milk) in order to develop a method to reveal a common fraud in dairy field. At first the results of total FA% composition of TAG, then the TAG stereospecific analysis data, were elaborated by LDA.
Materials and Methods
Samples and reagents
Four milk samples of five different animal species (cow, ewe, buffalo, donkey, goat), randomly selected from Italian farms, were collected in sterile bottles by direct manual milking, at mid-lactation stage, in the morning. The samples were immediately stored at 4 °C for the subsequent analyses. All animals, free from mastitis or any other inflammatory diseases, were multiparous; the number of lactation was 2–3 for all animal species; they grazed in the morning and in the afternoon were reared in stables and fed with hay, fodder grass and vegetables.
Ewe–cow milk mixtures have been considered. The samples were assigned to five groups indicated as: E (pure ewe milk), E/C 99:1 (99% ewe milk-1% cow milk), E/C 97:3 (97% ewe milk-3% cow milk), E/C 95:5 (95% ewe milk-5% cow milk) and C (pure cow milk). The sample size was four in each group; the mixtures for each ratio were obtained with each ewe milk sample and one representative cow milk pool, obtained with the four considered cow milk samples. The data of TAG total and intrapositional FA compositions of the considered mixtures were elaborated by Tagin software, developed at University of Perugia, using experimental data of cow and ewe pure milk samples.
Experimental procedures
The lipid extraction of pure milk samples, the stereospecific analysis of TAG and the high resolution GC analysis were performed according to previous papers (Blasi et al. Reference Blasi, Montesano, De Angelis, Maurizi, Ventura, Cossignani, Simonetti and Damiani2008; Cossignani et al. Reference Cossignani, Blasi, Bosi, D'Arco, Maurelli, Simonetti and Damani2011).
Statistical analysis
The following FA were considered: butyric (C4:0), caproic (C6:0), caprylic (C8:0), capric (C10:0), lauric (C12:0), myristic (C14:0), palmitic (C16:0), palmitoleic (C16:1n-7), stearic (C18:0), oleic (C18:1n-9), linoleic (C18:2n-6) and linolenic (C18:3n-3) acids; the variables were the total FA compositions (% mol) for pure milks and also the intrapositional FA compositions (% mol) in the three sn- positions (sn-1-, sn-2-, sn-3-) of the TAG glycerol backbone for the milk mixtures. LDA was carried out on pure milks and on three-group milk mixtures, each one made with ewe and cow pure milks and one of the E/C mixtures (99:1, 97:3 and 95:5). The data were elaborated with the classical multivariate statistical analysis methods, LDA, using the SPSS Professional Statistics software (version 9.0). Classification performance was also evaluated by cross-validation.
Results and Discussion
In this study the FA% composition of TAG fraction, derivatised as methyl esters, of pure milks from five different mammalian species (cow, ewe, buffalo, donkey, goat) has been determined. The results (mean value and sd) have been reported in Table 1. The sd values are comparable with those reported in other broader studies (Molkentin & Precht, Reference Molkentin and Precht1997; Blasi et al. Reference Blasi, Montesano, De Angelis, Maurizi, Ventura, Cossignani, Simonetti and Damiani2008). The results showed that the class of saturated FA, represented in particular by palmitic acid, was the most abundant for all milk samples; among short chain FA, butyric acid was the most abundant, in particular in ewe milk. The oleic acid, the most abundant monounsaturated FA, showed very similar percentages in all samples; donkey milk was characterised by the highest percentages of essential FA, that are linoleic and linolenic acids. Despite the fact that milk lipid composition is influenced by environmental and physiological factors such as diet, stage of lactation and genetic differences within the species (Kanwal et al. Reference Kanwal, Ahmed and Mirza2004), the results of total FA composition obtained in this study are in accordance with previous data (Blasi et al. Reference Blasi, Montesano, De Angelis, Maurizi, Ventura, Cossignani, Simonetti and Damiani2008).
Total FA composition of TAG fraction of pure milks (% mol mean value and sd, n = 4)

Using the multivariate parametric LDA technique, the results of total FA% composition, reported in Table 1, have been processed to classify and discriminate different pure milks. Table 2 shows the values of Fisher's linear discriminant functions (eigenvalue, percentage of variance and significance test) obtained by carrying out the chemometric analysis. The plot of results obtained using the values of the first two discriminant functions has been reported in Fig. 1. All the original grouped cases and 90% of cross-validated grouped cases were correctly classified. Saturated short chain FA and myristic acid, together with palmitoleic and linoleic acids, contributed particularly to the discrimination. The unstandardised canonical discriminant function coefficients are shown in Table 3.
Discriminant function plot of the first two functions obtained from LDA analysis using total FA% composition of pure milks (cow, ewe, buffalo, donkey, goat), for the analysis presented in Table 2.

Fisher's linear discriminant functions and functions at group centroids obtained from LDA analysis using total FA composition of pure milk TAG fraction

† For the analyses were used the first four canonical discriminant functions
Unstandardised canonical discriminant function coefficients obtained from LDA analysis using total FA composition of pure milk TAG fraction
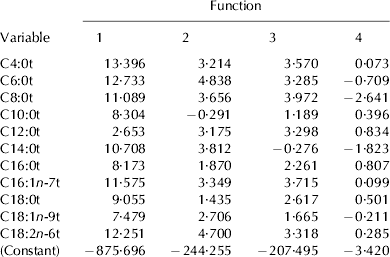
t, FA content (% mol) in total TAG fraction
Since in the dairy field one of the most frequent adulteration was the replacement of ewe milk with less expensive and more plentiful bovine milk, another objective of this research has been to develop a method able to detect the addition of cow milk to ewe milk. On the basis of the satisfactory results reported in a previous paper (Cossignani et al. Reference Cossignani, Blasi, Bosi, D'Arco, Maurelli, Simonetti and Damani2011), the same approach, based on TAG stereospecific analysis, was used to characterise ewe and cow milk mixtures and to identify mixtures containing very small amounts (1, 3 and 5%) of cow milk. Stereospecific analysis of TAG, using an enzymatic procedure coupled with chromatographic techniques, has been carried out to characterise and classify ewe–cow mixtures. The adopted phospholipase A2 procedure presents numerous advantages with respect to alternative chemical methods based on the chromatographic separation of chiral acylglycerols. For example, Christie et al. (Reference Christie, Nlkolova-Damyanova, Laakso and Herslof1993) reported on TAG chemical partial hydrolysis, derivatisation of diacylglycerols (DAG) with (S)-(+)-1-(1-naphthyl)ethyl isocyanate and their separation by high performance liquid chromatography (HPLC). However the method is not suited to the analysis of a complex TAG matrix, such as milk fat. Chiral HPLC of the 3,5-dinitrophenylurethane derivatives of DAG has been used by Itabashi et al. (Reference Itabashi, Myher and Kuksis1993) to determine the positional distribution of short chain FA in bovine milk TAG, but the complete stereospecific analysis has not been reported.
Table 4 shows the results of intrapositional FA composition of pure cow and ewe milks. The data showed differences in the FA distribution; ewe milk had higher% values of unsaturated FA, in particular oleic acid and essential FA in the sn-2- position, in respect of cow milk. This position is particularly important for physiological and nutritional reasons, since FA composition of the sn-2-position of absorbed TAG retains the FA as in the dietary TAG (Brindley, Reference Brindley and Wiseman1984).
Intrapositional FA compositions of TAG fraction of pure ewe and cow milk (% mol mean value±sd, n = 4)

Data of total and positional FA compositions (% mol) of the three ewe–cow mixtures (99:1, 97:3, 95:5) have been obtained by elaboration of experimental results of the stereospecific analysis of cow and ewe pure milk samples (Table 5). At first total TAG data have been used as variables for the LDA elaborations; the values of Fisher's linear discriminant functions have been reported in Table 6a. Milk samples were grouped considering pure ewe and cow milks and each of the E/C milk mixtures (99:1, 97:3, 95:5). The first discriminant function explained 99·9–100% of the variance; Wilks's lambda test showed that only the first function was significant (P ⩽ 0·05).
Total and intrapositional FA compositions of TAG fraction of ewe and cow milk mixtures (% mol mean value±sd, n = 4)

Fisher's linear discriminant functions obtained from LDA analysis using total FA composition of milk mixture TAG

† For the analyses were used the first two canonical discriminant functions
E, pure ewe milk; C, pure cow milk; E/C, ewe/cow milk mixtures
In Table 7a the unstandardised canonical discriminant function coefficients of mixtures, elaborated according to TAG data, have been reported; these coefficients can be used to compare the relative importance of the independent variables. Six FA, including all short and medium chain FA, were chosen for calibration; the caprylic acid was the variable that contributed most to the first canonical function, in particular in the case of 99:1 mixture, and also to the second function in the case of the 97:3 and 95:5 mixtures, accounting for most of the discrimination between all milk mixtures. Myristic acid showed the lower value for the first canonical function in all cases, while for the second function it was the lauric acid for the 97:3 and 95:5 mixtures and the caprylic acid for the 99:1 mixture. The graphical distribution of the milk samples has been reported in Fig. 2 (a, b, c, respectively for the three considered mixtures). 75% of the original grouped cases were correctly classified, while only 25% of the cross-validated samples were correctly classified when 97:3 and 95:5 mixtures were considered.
Discriminant function plots of the first two functions obtained from LDA analysis using total FA% composition of ewe–cow milk mixtures (a: 99:1; b: 97:3; c: 95:5), for the analysis presented in Table 6a.

Since the results were not satisfactory, the three mixture samples were analysed using not only the total but also the positional FA composition (% mol), obtained by stereospecific analysis of TAG fraction. Table 6b shows the values of Fisher's linear discriminant functions obtained carrying out the chemometric analysis using both total and intrapositional FA composition data. Function 1 explained 99·8%–100% of the variance; Wilks's lambda test showed that only the first function was significant (P < 0·001). The unstandardised canonical discriminant function coefficients have been reported in Table 7b. Caprilic and butyric acids in total TAG were the most important discriminant parameters but also butyric and caproic acids in sn-1- position were considered among the variables. The data of FA compositions in the sn-2- and sn-3- positions were never considered. It is important to remember that sn-3- position is indirectly determined using the phospholipase A2 procedure for stereospecific analysis (Christie, Reference Christie2003). Therefore it is possible to suggest that FA in sn-1- position were favoured for calibration because they were obtained by direct measurement. Figure 3 (a, b, c, respectively for the three considered mixtures) shows the graphical distribution of the milk samples on the plot of the first two discriminant functions. In this case a better separation was found, in fact LDA provided 100% correct classification. Also the results of cross-validation showed good classification with respect to the TAG data elaborations, in fact 75·0, 91·7 and 100·0% of cross-validated cases were correctly classified for the elaborations of 99:1, 97:3 and 95:5 milk mixtures, respectively. The results showed that this statistical approach can be used to evaluate the differences among milk samples, in fact the LDA always gave satisfactory results, even if the milk samples were not numerous. Nevertheless, the stereospecific analysis data were useful to correctly discriminate even the mixture with the 1% of bovine milk, because, as known, total and intrapositional TAG compositions are related to the biosynthetic pathway (Parodi, Reference Parodi1983).
Discriminant function plots of the first two functions obtained from LDA analysis using total and intrapositional FA% compositions of ewe–cow milk mixtures (a: 99:1; b: 97:3; c: 95:5), for the analysis presented in Table 6b.

Fisher's linear discriminant functions obtained from LDA analysis using total and intrapositional FA compositions of milk mixture TAG

† For the analyses were used the first two canonical discriminant functions
E, pure ewe milk; C, pure cow milk; E/C, ewe/cow milk mixtures
Unstandardised canonical discriminant function coefficients obtained from LDA analysis using total FA composition of milk mixture TAG
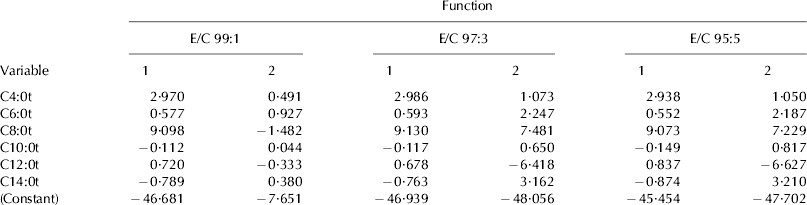
t, FA content (% mol) in total TAG fraction
Unstandardised canonical discriminant function coefficients obtained from LDA analysis using total and intrapositional FA compositions of milk mixture TAG

t, FA content (% mol) in total TAG fraction
sn-1, FA content (% mol) in sn-1- position of TAG fraction
Conclusions
TAG stereospecific composition is useful to characterise milk fat of different origin because of TAG fraction of each lipid matrix has a characteristic FA distribution on the glycerol backbone. The LDA application to the results of TAG stereospecific analysis allowed classification and discrimination of pure milks and their mixtures. FA intrapositional compositions were able to characterise ewe milk and to identify mixtures containing very small amounts (1, 3 and 5%) of cow milk. Considering the satisfactory results obtained for the classification/differentiation of the milk mixtures, there might be a possible practical application of the proposed method, using a larger sample size.



