Nomenclature
- ADM
-
actuator disk models
- ARF
-
adhesion reduction factor
- ASM
-
actuator surface models
- BVLOS
-
beyond visual line of sight
- CFD
-
computational fluid dynamics
- CHT
-
conjugate heat transfer
- ESC
-
electronic speed controller
- ETIPS
-
electro-thermal ice protection system
- eVTOL
-
electric vertical take-off and landing
- FoM
-
figure of merit
- IPS
-
ice protection system
- IRT
-
icing research tunnel
- ISI
-
icing severity index
- IWT
-
icing wind tunnel
- LSB
-
laminar separation bubble
- LWC
-
liquid water content
- MRF
-
moving reference frames
- MTOW
-
maximum take-off weight
- MVD
-
median volume diameter
- PIV
-
particle image velocimetry
- PWM
-
pulse-width modulation
- RANS
-
Reynolds-averaged Navier–Stokes
- RPM
-
revolutions per minute
- RW-UAV
-
rotary-wing unmanned aerial vehicle
- SHS
-
superhydrophobic surface
- SLD
-
supercooled large droplets
- SWIM
-
shallow-water icing model
- UAM
-
urban air mobility
- UAV
-
unmanned aerial vehicle
- VLOS
-
visual line of sight
- VTOL
-
vertical take-off and landing
- Ac
-
accumulation parameter
- CP
-
power coefficient
- CQ
-
torque coefficient
- CT
-
thrust coefficient
- d
-
characteristic body dimension
- D
-
propeller diameter
- Fc
-
centrifugal force
- J
-
advance ratio
- K
-
droplet inertia parameter
- K0
-
modified inertia parameter
- ks
-
equivalent sand-grain roughness height
- Mtip
-
tip mach number
- n
-
rotational speed, rev/s
- n0
-
freezing fraction
- P
-
mechanical power
- Q
-
aerodynamic torque
- Re
-
Reynolds number
- r
-
radial position along the blade
- t
-
icing exposure time
- T
-
thrust
- V
-
local velocity
- V∞
-
freestream velocity
- Vrel
-
relative velocity
- We
-
Weber number
- α
-
sectional angle-of-attack
- β
-
local collection efficiency
- β0
-
stagnation-line collection efficiency
- δ
-
droplet diameter
- μ
-
dynamic viscosity
- ρ
-
air density
- ρi
-
ice density
- ρw
-
water density
- σw
-
surface tension of water
- τ
-
aerodynamic shear stress
- Ω
-
angular velocity
1.0 Introduction
1.1 Operational relevance and hazard context
Unmanned aerial vehicle (UAV) systems have expanded rapidly over the past decade, supporting applications from package delivery and infrastructure inspection to medical transport and search-and-rescue operations [Reference Telli, Kraa, Himeur, Ouamane, Boumehraz, Atalla and Mansoor1–Reference Yao, Qin and Chen5], with the active U.S. fleet projected to exceed 3.0 million units by 2028 [6]. Advances in sensing, guidance and control have broadened UAV capability across mission functions and aircraft configurations, including autonomous landing, cooperative operation, vertical take-off and landing (VTOL), fixed-wing and rotary-wing platforms [Reference Gautam, Sujit and Saripalli7–Reference Mairaj, Baba and Javaid14]. Within the rotary-wing category, quadcopters remain dominant among multirotor platforms owing to their compactness and design simplicity [Reference Ucgun, Yuzgec and Bayilmis15], while cooperative-control and optimisation studies continue to expand their operational envelope [Reference Lizzio, Capello and Guglieri16, Reference Khalid, Al Blushi, Al-Raeesi, Abdulla, Al-Shehhi, Al-Mazam, Al-Beshr and Al-Awadhi17]. Adverse weather remains one of the principal factors limiting rotary-wing unmanned aerial vehicle (RW-UAV) availability, especially for beyond visual line of sight (BVLOS) missions in cold and high-latitude environments where mission viability can deteriorate rapidly [Reference Hann and Johansen18]. Within this envelope, atmospheric icing is among the most safety-critical hazards because it can cause rapid performance degradation, instability and mission abort with limited warning [Reference Hann19]. Supercooled large droplets (SLDs) are of particular concern because they can impinge beyond normally protected regions [Reference McClain, Vargas, Tsao and Broeren20]; certification frameworks reflect this distinction through the conventional Appendix C envelope and the more severe Appendix O conditions [Reference McClain, Vargas, Tsao and Broeren20–Reference Tsao22]. Dedicated airborne campaigns and emerging sensor concepts have improved the detection and discrimination of these icing conditions [Reference Jurkat-Witschas, Lucke, Schwarz, Deiler, Sachs, Kirschler, Menekay, Voigt, Bernstein, Jaron, Kalinka, Zollo, Lilie, Mayer, Page, Vié, Bourdon, Pereira Lima and Vieira23, Reference Schwarz24], while real-time ice detection is increasingly recognised as a key requirement for safe UAV operation in cold climates [Reference Low-Hansen, Hann, Stovner and Johansen25, Reference Hann and Borup26].
Ice accretion degrades aerodynamic performance by altering the original geometry of the leading edges, which significantly disrupts the flow field, causes a severe decrease in thrust and increases aerodynamic drag [Reference Hylmar, Socha, Kusmirek, Hanakova, Urban and Spak27]. For RW-UAVs, propeller icing is particularly consequential because it directly reduces thrust, increases power demand and alters rotor dynamics; asymmetric shedding further intensifies vibration and can challenge structural integrity [Reference Miller, Fuchs, Omanovic, Ramelli, Seifert, Spirig, Zhang, Fons, Lohmann and Henneberger28, Reference Kozomara, Amon, Puffing, Neubauer, Schweighart, Diebald, Rapf, Moser and Breitfuss29]. These aerodynamic penalties are compounded by the limited energy reserves of electric propulsion systems, as ice accumulation on propeller blades forces the propulsion system to draw significantly more power to maintain thrust, leading to rapid battery depletion, reduced endurance and in some cases premature mission abort [Reference Hylmar, Socha, Kusmirek, Hanakova, Urban and Spak27, Reference Hann30, Reference Liu, Li, Ning, Tian and Hu31].
Navigating these hazards requires robust decision-making protocols for both remote pilots and autonomous systems. Standard weather reports often lack the spatial and temporal resolution needed for low-altitude drone operations, creating uncertainty in detecting localised icing conditions and motivating the development of advanced nowcasting products and onboard detection capabilities [Reference Armanini, Polak, Gautrey, Lucas and Whidborne32, Reference Roseman and Argrow33]. These operational decision gaps are compounded by a physics-based vulnerability unique to small RW-UAVs. At the low Reynolds numbers and small chord lengths typical of RW-UAV propellers, even modest ice roughness can trigger disproportionately large aerodynamic penalties [Reference Hann30, Reference Hann34]. Traditional helicopter icing models, developed for higher-Re regimes, may therefore be insufficient for direct prediction at UAV scales without additional scale-aware correction or validation [Reference Hylmar, Socha, Kusmirek, Hanakova, Urban and Spak27, Reference Hann30].
Rather than framing icing as a generic adverse-weather constraint, this review positions RW-UAV icing as a coupled operational and aerothermodynamic problem in which mission continuity, energy-limited electric propulsion and real-time decision logic interact directly with small-scale propeller physics. It synthesises how low-Reynolds-number operation, small-chord propellers and rotation-driven transport amplify the impact of even modest roughness and accretion. These physical characteristics limit the direct transfer of correlations and interpretations developed for manned aviation to RW-UAV propellers and indicate that similarity cannot be preserved in all cases across scales. Building on this premise, the review clarifies where similarity assumptions break and traces the accretion chain from collection and surface water transport to morphology and performance loss. Furthermore, it highlights why cross-comparison of reported penalties is often hindered by non-standardised testing practices, evaluating the trade-offs among mitigation approaches within the battery and weight constraints that define RW-UAV operational boundaries. The aim is to provide a scale-aware, mechanism-based framework that supports interpretable evidence, safer operational decision-making and more defensible evaluation of experiments and models in the RW-UAV icing literature.
1.2 Positioning versus prior reviews
Muhammed and Virk [Reference Muhammed and Virk35] recently published a comprehensive survey that synthesised the state of the art regarding ice accretion mechanisms and energy-efficient anti- and de-icing technologies for rotorcraft UAVs. Their review provided an extensive catalogue of both active and passive mitigation methods, while also identifying fundamental aerodynamic penalties and the distinct challenges posed by centrifugal forces and complex rotor flow fields.
That review establishes a valuable foundation, and the present work builds on it by drawing on related physical and methodological evidence that is particularly relevant to small RW-UAV propellers. The interaction between rotational physics and surface wettability [Reference Muhammed, Harvey, Khawaja, Virk and Momen36] can produce complex runback behaviours on small chords, as supported by recent rotating-frame droplet models [Reference Ishaque, Jiang and Wu37] and the underlying thermodynamics of liquid-water flow [Reference Messinger38]. At the same time, the reliability of reported data is shaped by methodological factors, including blockage and facility interference in icing wind tunnels, the modelling of boundary-layer transition at low Reynolds numbers and inconsistent reporting of shedding events and detection thresholds, as discussed in Section 4. Because measurement uncertainty and facility interference remain significant even in large-scale manned aviation testing [Reference Broeren, Potapczuk, Lee, Malone, Paul and Woodard39, Reference Lucke, Jurkat-Witschas, Heller, Hahn, Hamman, Breitfuss, Bora, Moser and Voigt40], establishing methodological clarity at the UAV scale is essential.
To clarify the novelty of the present review, the individual similarity parameters, such as Reynolds number, droplet inertia, collection efficiency, freezing fraction, Weber number, advance ratio and tip Mach number, are not presented here as newly identified quantities; they are well-established concepts in the icing and rotorcraft literature. The contribution of this review is a scale-transfer analysis specific to small RW-UAV propellers, providing three synthesis-level outputs. First, it treats the low-Reynolds-number regime of small-chord propellers as a scale-transfer limit rather than a smooth extrapolation of manned-rotorcraft correlations. Second, it consolidates from existing datasets the magnitude of the resulting departures at UAV scale, including a centrifugal-to-shear ratio of order 4.6 at outboard stations, a tip-to-root ice-thickness ratio exceeding 2:1 with an associated effective-chord growth of roughly 130% and a relative surface roughness an order of magnitude larger than that commonly assumed for larger rotor geometries. Third, it maps these departures to the expected error modes in experiments, numerical simulations, and protection-system evaluation, thereby distinguishing effects that have been directly measured on rotating small-scale propellers from those inferred by analogy to helicopter or fixed-wing icing.
Accordingly, this review complements prior work by offering a mechanism-oriented synthesis organised around four interconnected dimensions. Section 2 examines the similarity framework governing droplet collection, heat transfer and roughness-driven transition on small-chord rotating blades, establishing where scaling assumptions inherited from manned aviation become unreliable. Section 3 traces the coupled aerodynamic penalties, safety-critical shedding transients and multi-rotor wake interactions that collectively shrink the flight envelope under strict energy budgets. Section 4 evaluates the methodological factors shaping data reliability, from facility boundary conditions through numerical modelling sensitivities, and proposes a minimum reporting framework for future experiments. Section 5 assesses mitigation strategies, specifically passive, active and hybrid ice protection systems, within the battery capacity and weight constraints that distinguish small electric RW-UAVs from manned platforms. The conceptual organisation of these four dimensions is illustrated in Figure 1.
Conceptual roadmap of the review framework. Original figure by the authors; the ice-accretion photographs in the “Icing Physics” panel are reproduced with permission [Reference Kozomara, Amon, Puffing, Neubauer, Schweighart, Diebald, Rapf, Moser and Breitfuss29].

1.3 Scope and definitions
This review delineates the scope of rotary-wing unmanned aerial vehicles (RW-UAVs) to encompass small-scale, unmanned systems primarily in the sub-25 kg category, including multi-rotor configurations (quadcopters, hexacopters). While the physics discussed may extend to larger urban air mobility (UAM) or electric vertical take-off and landing (eVTOL) concepts, the primary focus remains on vehicles operating at low Reynolds numbers where the aerodynamic and accretion characteristics differ significantly from manned aviation. Manned or full-scale helicopter rotors, which generally operate at substantially higher Reynolds numbers, are therefore referred to only as a higher-scale comparison baseline rather than as the subject of the review, and eVTOL or UAM systems occupy an intermediate scale to which the present conclusions are not directly extended. When results from these larger-scale platforms are cited, the relevant scale context is specified, since the contribution here lies precisely in distinguishing the small-propeller low-Reynolds-number regime from them. The analysis specifically targets the operation of these vehicles across diverse meteorological icing envelopes, as classified by regulatory microphysical frameworks, where weather constraints heavily dictate flyability and safety margins. The operational context includes both visual line of sight (VLOS) and BVLOS missions, for which environmental conditions are a primary determinant of mission feasibility [Reference Gao, Hugenholtz, Fox, Kucharczyk, Barchyn and Nesbit41].
The scope encompasses fixed-pitch, variable RPM propellers typical of electric multirotor systems, operating in both hover and forward flight [Reference Samad, Dhulipalla, Bowers, Rodriguez and Hu42]. In this review, the terms `propeller’ and `propeller blade’ are used for the fixed-pitch rotating blades of small RW-UAVs, whereas `rotor’ and `rotor blade’ are retained for manned rotorcraft and for the broader disk-level aerodynamic context (e.g. disk loading, figure of merit), or when citing rotorcraft literature. The analysis draws on the low-Reynolds-number aerodynamic framework in which laminar separation and transition govern blade-section performance [Reference Grande, Romani, Ragni, Avallone and Casalino43]. Because the rigid, fixed-pitch blades typical of these systems lack the articulation and compliance of manned-rotorcraft blades, aeroelastic coupling under ice loads lies outside the present scope.
Standardising the terminology for icing regimes is critical for interpreting aerodynamic penalties on small aerofoils. Rime ice is defined here as a low-density, opaque accretion resulting from the rapid freezing of supercooled droplets upon impact, typically trapping air pockets and conforming to the leading edge. Glaze ice refers to a high-density, clear or translucent accretion formed when droplets do not freeze immediately, leading to surface water runback and the formation of complex structures such as horns or lobster-tail formations. Mixed ice describes the transitional state containing characteristics of both. For RW-UAVs, the distinction is vital because aerodynamic heating varies with velocity [Reference Makkonen44], so the radial velocity gradients along a rotating blade can cause the transition from rime to glaze to occur spanwise across a single blade. Compounding this physical complexity is the inherent subjectivity of standard aviation icing intensity classifications (i.e. trace, light, moderate, severe), which historically evolved around the operational limits of manned aircraft [Reference Jeck45].
For RW-UAV propellers, the Appendix C and Appendix O envelopes should be treated as regulatory microphysical reference envelopes rather than direct severity categories. Their transfer to small-chord propellers requires scale-aware interpretation because droplet impingement depends not only on absolute droplet diameter, but also on the droplet-size-to-body-scale ratio, including the local leading-edge radius and chord. As these length scales are much smaller for UAV propellers than for manned aircraft, droplets within conventional Appendix C conditions may still produce severe local accretion and performance degradation through elevated collection efficiency [Reference Szilder and McIlwain46]. Genuine Appendix O (SLD) conditions remain an additional hazard because larger droplets can extend impingement farther beyond the leading edge into aerodynamically unprotected regions [Reference Prince Raj, Lee and Myong47, Reference Özgen and Sarıbel48]. The distinction between continuous-maximum and intermittent-maximum icing conditions is therefore retained in this review, but interpreted in a scale-aware RW-UAV context.
Establishing these definitions is a prerequisite for the detailed physical analysis in Section 2. The unique interaction between low Reynolds number aerodynamics and centrifugal water transport on rotating blades necessitates a departure from traditional scaling laws used in manned aviation. Before examining specific aerodynamic penalties, it is essential to understand how fundamental parameters such as droplet inertia and heat transfer scale down to UAV dimensions. This leads directly into the discussion of similarity frameworks and collection efficiencies that govern the accretion process.
2.0 Scaling and similarity constraints in RW-UAV icing
2.1 Similarity framework and the low-Reynolds-number scaling break
The fundamental challenge in analysing icing on RW-UAVs lies in the non-linear `scaling break’ that occurs when attempting to transfer aerothermodynamic correlations from manned aviation to the small-scale, low-Reynolds number regime. Traditional rotorcraft operate at Reynolds numbers (Re) ranging from 106 to 2 × 10⁷, where the flow is predominantly turbulent, and boundary layers are robust against minor surface roughness. In contrast, small-scale UAV propellers typically operate in the range of Re ≈ 105 to 106, a regime characterised by laminar flow susceptibility, transitional boundary layers and the presence of laminar separation bubbles (LSBs) [Reference Saldana, Gallegos, Gálvez, Castillo, Salinas-Rodríguez, Cerecedo-Sáenz, Hernández-Ávila, Navarra and Toro49, Reference Hann, Hearst, Sætran and Bracchi50]. Direct geometric down-scaling of icing conditions is frequently invalid because the physical mechanisms governing droplet impingement, heat transfer and ice morphology do not scale linearly with chord length. Consequently, a distinct similarity framework is required to quantify how the physics of accretion on small chords differs from established helicopter literature, particularly regarding the disproportionate aerodynamic penalties induced by relatively small ice roughness elements [Reference Hann and Johansen51, Reference Anderson and Tsao52].
The primary parameter governing fluid dynamic similarity is the Reynolds number, defined in general flow contexts as the ratio of inertial to viscous forces. For an aerofoil or propeller blade with characteristic length (typically the leading edge diameter or chord) and velocity V, the Reynolds number is expressed as Eq. (1):
 \begin{equation} Re=\frac{\rho Vd}{\mu } \end{equation}
where
 $\rho$
is the air density and
 $\mu$
is the dynamic viscosity [Reference Saldana, Gallegos, Gálvez, Castillo, Salinas-Rodríguez, Cerecedo-Sáenz, Hernández-Ávila, Navarra and Toro49, Reference Anderson and Tsao52]. In the context of RW-UAVs, matching Re is critical not only for aerodynamic coefficients but for thermodynamic similarity. At low Re, the convective heat-transfer coefficients differ significantly from the correlations used in codes like LEWICE or FENSAP-ICE [Reference Hann30, Reference Hann, Hearst, Sætran and Bracchi50] and classical models often neglect heat conduction within the ice layer and water film [Reference Zhang, Min and Wu53, Reference Ahmed, Shad, Zgheib, Sherif and Balachandar54]. From a scaling perspective, it can be deduced that these traditional assumptions become increasingly restrictive at smaller UAV scales, potentially affecting the predicted freezing fraction. The freezing fraction n
0
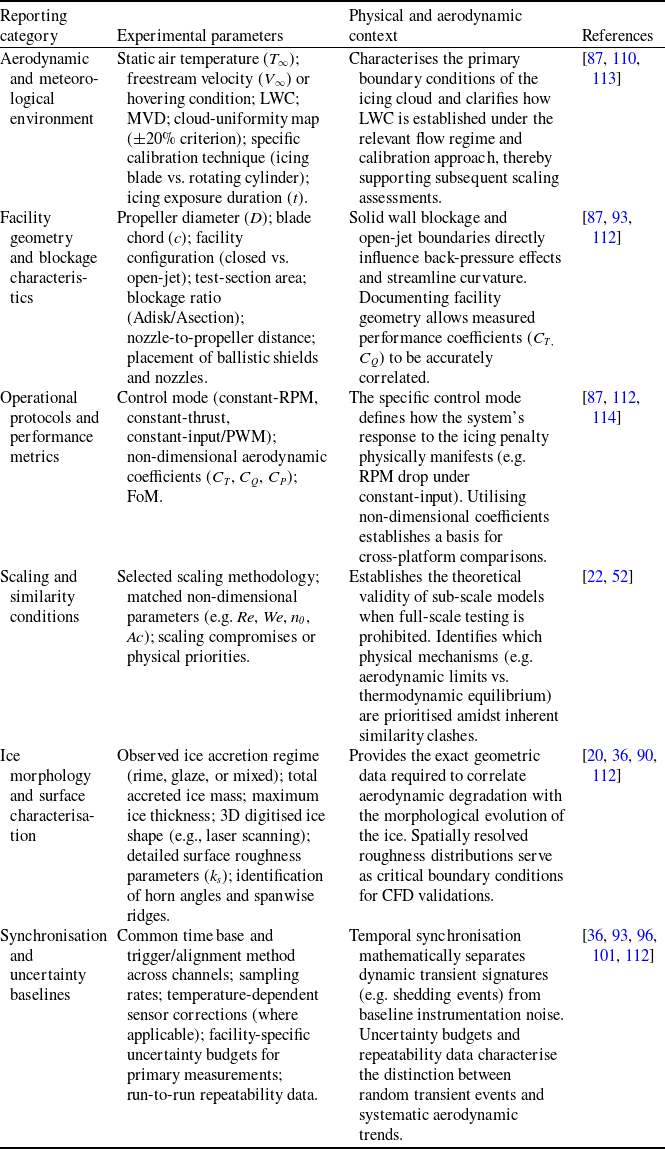
represents the proportion of impinging water that freezes on contact at a given surface location, ranging from unity in pure rime to near zero under full glaze conditions where extensive surface water runback occurs. This parameter is central to the Messinger energy balance and directly determines whether a rime or glaze accretion regime prevails [Reference Anderson and Tsao52, Reference Ahmed, Shad, Zgheib, Sherif and Balachandar54].
At the same scale, the aerodynamic penalty is strongly governed by the boundary-layer response to ice roughness. Low-Reynolds-number experiments on iced aerofoils show that relatively small roughness elements can trigger premature transition or disrupt LSBs, producing stall behaviour not predicted by high-Reynolds-number assumptions [Reference Hann, Hearst, Sætran and Bracchi50]. Data-driven approaches have been explored for mapping flight conditions directly to icing severity [Reference Li and Paoli55], but the scale-transfer framework adopted here still requires explicit ice-shape and roughness information.
From an accretion-morphology standpoint, this ice-induced surface roughness can be characterised by an equivalent sand-grain height (k s ), which serves as a single parameter linking surface texture to both boundary-layer transition and convective heat transfer. It is worth noting that quantitative k s correlations in current use are almost exclusively derived from fixed-wing stagnation experiments [Reference McClain, Vargas, Tsao and Broeren56, Reference Contreras Montoya, Ilinca and Lain57] and, in the absence of rotor-specific alternatives, are commonly adopted for rotating-blade simulations using local stagnation quantities (collection efficiency, accumulation parameter and freezing fraction). As a result, k s is retained here as a key similarity parameter linking accretion morphology to low-Re aerodynamic penalties.
The second critical parameter for establishing similarity in icing conditions is the droplet inertia parameter (K), which governs trajectory and collection efficiency. The inertia parameter K, also termed the modified Stokes number in droplet-trajectory analyses, is defined by Eq. (2):
 \begin{equation} K=\frac{\rho _{w}\delta ^{2}V}{18\mu d} \end{equation}
where δ is the droplet median volume diameter (MVD),
 $\rho$
w
is the water density,
 $\mu$
is the dynamic viscosity of air and d is the body characteristic dimension [Reference McClain, Vargas, Tsao and Broeren56, Reference Ibrahim, Pope and Naterer58]. To maintain trajectory similarity between a reference and a scaled model, the modified inertia parameter K0
, which incorporates droplet Reynolds number corrections, must be matched. The resulting local collection efficiency
 $\beta$
, defined as the ratio of the actual water mass flux impinging on a differential surface element to the freestream liquid water flux, is directly governed by this parameter. For a given droplet distribution and body geometry,
 $\beta$
generally increases with K0
, approaching unity when droplet inertia overwhelms the deflecting capacity of the airflow [Reference Shi, Sang, Wang, Niu and Guo59]. Previous studies have demonstrated that reduced chord lengths inherently increase collection efficiency [Reference Hann and Johansen51, Reference Ibrahim, Pope and Naterer58, Reference Liang, Zhao, Shen, Yang, Chi, Li and Feng60]. By interpreting these findings through the lens of the inertia parameter, it can be deduced that for small-chord UAV propellers, the small leading edge radius results in a significantly higher K value compared to manned aircraft. Consequently, UAV propellers exhibit much higher
 $\beta$
, often approaching or, due to centrifugal concentration in rotating frames, exceeding unity near the stagnation line. This effect is referred to here as the `collection scaling break’ to denote the scale-transfer consequence that, for comparable cloud conditions, a small UAV propeller can collect a disproportionately large amount of water relative to its chord compared with a helicopter rotor blade.
Crucially, the local collection efficiency on a rotating blade is inherently non-uniform. It varies along the span through the local relative velocity, along the chord, where it typically peaks near the stagnation line and decays toward the trailing edge, and with the aerodynamic operating point, because the transition from hover to forward flight alters the inflow angle and therefore the impingement footprint. This spatial non-uniformity has been reported in rotating-propeller icing simulations as a sharp local peak near the stagnation line followed by rapid chordwise decay, with the peak collection coefficient increasing progressively toward the blade tip as local rotational speed increases [Reference Shi, Sang, Wang, Niu and Guo59]. The peak local collection efficiency near the stagnation line also increases progressively toward the blade tip as a direct function of the higher local rotational kinematics [Reference Shi, Sang, Wang, Niu and Guo59, Reference Chen and Zhao61]. From a reporting standpoint, this review therefore recommends that the local collection efficiency be reported either as a spanwise distribution or at a clearly defined representative radial station, rather than as a single unspecified value. A further physical complication arises from the evolving coupling between the collection efficiency and the surface state. Although some reduced-order approaches assume the collection efficiency remains constant for simplicity [Reference Samad, Villeneuve, Morency, Béland and Lapalme62], roughness elements or nascent ice features that protrude into the near-wall flow can locally enhance droplet interception by deviating trajectories that would otherwise follow smooth-surface streamlines. This localised enhancement mechanism has been observed on complex cylindrical structures, where evolving ice humps/horns protrude into the incoming flow and intercept additional airborne droplets [Reference Veerakumar, Tian, Hu, Liu and Hu63]. Based on these physical observations, the local collection efficiency is therefore expected to depart progressively from smooth-surface predictions as accretion proceeds.
The total water catch is further quantified by the accumulation parameter, as given by Eq. (3):
 \begin{equation} Ac=\frac{LWC\,V\,t}{\rho _{i}\,d} \end{equation}
which expresses the ratio of impinging water mass over a given exposure time to a characteristic ice thickness on the body [Reference Tian, Li, Hu and Hu64]. Matching Ac between wind-tunnel models and full-scale conditions is essential to reproduce representative ice thicknesses and shapes. Using liquid water content (LWC) in g/m3, V in m/s, t in s,
 $\rho$
i
in g/m3 and d in m, the dimensionless nature of the accumulation parameter is demonstrated in Eq. (4):
 \begin{equation} Ac=\frac{LWC\,V\,t}{\rho _{i}\,d}=\frac{(gm^{-3})(ms^{-1})s}{(gm^{-3})m}=1 \end{equation}
While the inertia parameter and collection efficiency determine how much water reaches the surface, the behaviour of that water after impact, particularly under glaze and SLD conditions, introduces additional scaling requirements. The Weber number (We), representing the ratio of inertial forces to surface tension, governs droplet deformation and break-up upon impact, as expressed by Eq. (5):
 \begin{equation} We=\frac{\rho {V_{rel}}^{2}\delta }{\sigma _{w}} \end{equation}
where
 $\rho$
is the air density, V
rel
is the relative velocity between the airflow and the droplet, δ is the characteristic droplet diameter and σ
w
is the air–water surface tension [Reference Özgen and Sarıbel48, Reference Ibrahim, Pope and Naterer58]. At the high local relative velocities encountered near UAV propeller tips, particularly for large droplets, aerodynamic deformation and break-up may become increasingly relevant. Following impingement, spreading and splashing are governed by impact-specific parameters, such as the Mundo parameter. When splashing occurs, it can reduce the net accreted mass and should therefore be considered when extrapolating experimental results from low-speed wind tunnels to high-speed flight conditions [Reference Özgen and Sarıbel48].
Beyond these microphysical droplet interactions, the macro-scale rotational kinematics must also be correctly scaled to ensure flow-field similarity. The aerodynamic operating point of the propeller, which dictates the spanwise distribution of local flow conditions, is governed by the advance ratio (J). The advance ratio is given by Eq. (6):
 \begin{equation} J=\frac{V_{\infty }}{nD} \end{equation}
where V ∞ is the freestream velocity, n is the rotational speed (rev/s), and D is the propeller diameter. As this parameter dictates the operational regime of the propeller in forward flight, it inherently fixes the baseline spanwise distributions of the sectional angle-of-attack (α), thrust coefficient and power coefficient [Reference Tsao, Sabri, von Hardenberg and Flack65, Reference Müller and Hann66]. If the test and operational configurations differ in J, the resulting mismatches in sectional α and collection efficiency can yield non-representative icing severities and mispredicted thrust/power degradations when wind-tunnel data are extrapolated to real RW-UAV missions.
Furthermore, the rotation of the propeller introduces a radial physics dimension absent in fixed-wing scaling, defined by the interplay between centrifugal forces and aerodynamic shear. Based on the observed physics on small-scale propellers [Reference Müller and Hann66, Reference Suurnäkki, Tiihonen and Jokela67], it can be deduced that high rotation rates may render centrifugal effects increasingly important, leading to shedding behaviour that can differ appreciably from large-rotor assumptions. This `scaling break’ is further exacerbated by the thermodynamic balance. The stagnation temperature rise at the tip of a UAV propeller can be highly significant (e.g. reaching relative velocities up to 130 m/s) [Reference Müller and Hann66], which may reduce the local freezing tendency near the tip and thereby shift the spanwise distribution of ice accretion. This phenomenon is directly governed by the local freezing fraction (n 0 ) as expressed by the Messinger-type energy balances [Reference Ahmed, Shad, Zgheib, Sherif and Balachandar54, Reference Müller, Løw-Hansen, Borup and Hann68]. In full-scale helicopter literature, the tip Mach number (M tip ) is a primary design constraint because transonic effects strongly modify the pressure and temperature fields. While compressibility is often neglected for most subsonic small-UAV propellers, at tip speeds of order O (102 m/s), the associated adiabatic increase in stagnation temperature can become sufficient to influence the local freezing fraction [Reference McClain, Vargas, Tsao and Broeren56, Reference Müller, Løw-Hansen, Borup and Hann68] and may alter the spanwise location of maximum ice accretion. Consequently, this study highlights that neglecting M tip in similarity frameworks can introduce a thermodynamic offset, particularly when experimental and operational tip speeds differ.
In experimental practice, rigorous similarity is rarely achieved because matching Re, K
0
, We, Ac, n
0
, J,
 $\beta$
and thermodynamic parameters simultaneously often requires competing compromises [Reference Tsao, Sabri, von Hardenberg and Flack65]. By evaluating existing scaling frameworks, this suggests that unavoidable parameter mismatches can introduce distinct sources of error. For example, changes in airspeed influence aerodynamic heating and freezing fraction [Reference Hann and Johansen51, Reference Tsao, Sabri, von Hardenberg and Flack65]; therefore, a test condition that preserves one similarity requirement while misrepresenting velocity may alter heat-transfer behaviour and bias the predicted rime-to-glaze transition. Likewise, models that treat low-density rime ice as a uniform solid, rather than accounting for its variable porosity and effective properties, may misrepresent ice growth and thickness development [Reference Zhang, Min and Wu53, Reference Ahmed, Shad, Zgheib, Sherif and Balachandar54], with further consequences for the resulting aerodynamic penalty.
The competing similarity requirements discussed above are consolidated in Table 1. Rather than serving as a catalogue of non-dimensional parameters alone, it functions as a diagnostic scale-transfer map that links each parameter to the physical mechanism it controls, the dominant scaling-break pathway in the low-Re regime, and the specific error mode expected when manned-rotorcraft assumptions are applied to small RW-UAV propellers. This structure helps explain why experimental and computational results across different facilities can diverge, even when a subset of operating conditions appears matched. A recurring theme emerging from this comparison is the outsized role of droplet inertia and collection efficiency on small chords: because
 $\beta$
can approach unity for typical UAV leading edge radii, even modest scaling errors in K
0
or Ac propagate into disproportionate ice-thickness discrepancies. Having established this similarity framework and noting the high volume of water collected at the stagnation line, the discussion now turns to what happens after impingement. Section 2.2 explores the redistribution of unfrozen water on rotating blades and the highly amplified runback and film-transport mechanisms unique to small-scale propellers.
Dimensionless similarity parameters relevant to RW-UAV icing and their departures from conventional rotorcraft scaling

Table 1. Long description
Table with two parts labeled Table 1 and Table 1. Continued. Each part contains a multi-column table comparing dimensionless similarity parameters relevant to RW-UAV icing and their departures from conventional rotorcraft scaling. Columns include Similarity parameter, Physical significance, Conventional Scaling deviation in rotorcraft regime, Consequence of parameter mismatch in RW-UAV regime, and References. Parameters include Reynolds Number, Droplet Inertia, Accumulation Parameter, Weber Number, Thermodynamic Similarity, Surface Roughness, Advance Ratio, and Tip Mach Number. Each row describes the physical significance, scaling deviations, and consequences of parameter mismatches.
2.2 Rotational forcing and radial water redistribution
While
 $\beta$
sets the initial arrival footprint of liquid water on the blade, the final accretion pattern on rotary-wing UAVs is largely dictated by how unfrozen water is redistributed over the surface under rotation. In glaze and mixed regimes, the assumption that ice grows only where water initially arrives does not fully represent the accretion process, because spanwise and chordwise translocation of liquid water becomes a primary determinant of the final ice geometry and its aerodynamic impact [Reference Liu, Li, Ning, Tian and Hu69, Reference Wang and Zhu70]. Based on the fundamental kinematics governing rotating flows [Reference Liu, Li, Ning, Tian and Hu31], the centrifugal contribution to surface-water transport is expected to become more pronounced on small-radius, high-RPM UAV propellers than on helicopter-scale rotors operating at comparable local tip-speed levels.
Rotation introduces a centrifugal body force (∝ Ω2r) that reshapes the near-wall force balance acting on the surface water film. In non-rotating configurations, chordwise transport is driven primarily by aerodynamic shear pushing liquid toward the trailing edge; under rotation, the resultant driving vector acquires a pronounced spanwise component, enabling outward migration of unfrozen water [Reference Liu, Li, Ning, Tian and Hu31, Reference Shi, Sang, Wang, Niu and Guo59, Reference Wang and Zhu70], a mechanism illustrated schematically in Figure 2.
Schematic of the near-wall force balance between aerodynamic shear stress (
 $\tau$
) and centrifugal force (F
c
), illustrating the centrifugally driven tip-ward water runback and resulting tip-heavy ice accretion on a rotating blade. Reproduced with permission [Reference Liu, Li, Ning, Tian and Hu31].

An analysis of the data reported by Wang and Zhu [Reference Wang and Zhu70] reveals the profound magnitude of this shift. At the outboard station (r/R = 0.8), specifically for the leading-edge control volume, the centrifugal force on a surface control volume exceeds the local aerodynamic shear by a factor of nearly five (approx. 4.6 times). Consequently, in the three-dimensional rotating frame, this force imbalance rotates the resultant liquid-flow vector to within ≈14° of the pure spanwise direction (derived from the 3D surface-vector components). The practical consequence is that unfrozen water is driven preferentially from root toward tip. Liu et al. [Reference Liu, Li, Ning, Tian and Hu69] confirmed this experimentally on a 200 mm-diameter propeller at 3000 RPM (V ∞ = 16 m/s): under mixed-ice conditions (T ∞ = −5 °C, LWC = 1.0 g/m3), leading edge ice thickness at the blade tip reached approximately 4.5 mm within 105 s, whereas the corresponding root value (r/R ≈ 0.2) remained near 2.0 mm — a tip-to-root ratio exceeding 2:1. Relative to the local chord, this outboard accretion increased the effective tip chord by roughly 130% [Reference Liu, Li, Ning, Tian and Hu69]. It is critical to highlight that such an extreme degree of geometric distortion appears less commonly documented in full-scale helicopter icing literature at comparable exposure times, underscoring the unique severity of UAV icing. Under wetter glaze conditions (LWC = 2.0 g/m3, T ∞ = −5 °C), the same centrifugal pumping produced distinctive lobster-tail ice protrusions and icicles concentrated at the blade tip, both morphologies directly attributable to the radial advection of unfrozen water that subsequently freezes at outboard stations [Reference Liu, Li, Ning, Tian and Hu69, Reference Han, Hu and Hu71].
Interpreted jointly through the similarity framework, these measurements amount to more than a set of matched or mismatched non-dimensional groups. The high collection tendency identified in Section 2.1 and the tip-ward redistribution reported above indicate that water arrival and post-impact transport are coupled on propellers, so matching only a subset of Re, K 0 , Ac, We, J or M tip cannot guarantee representative accretion morphology. This critical reading of the available propeller data identifies the quantities required for predictive comparison, namely spanwise ice-thickness distribution, local collection efficiency, surface-roughness state, rotational speed, control mode and uncertainty bounds. A validated RW-UAV propeller-specific scaling correlation does not yet exist; the present review therefore uses the available measurements to quantify the magnitude of scale-transfer departures and defines the development of such a correlation as a primary experimental gap.
This centrifugally driven redistribution is thermodynamically coupled to local freezing behaviour. In glaze conditions where a persistent liquid layer exists, water can be advected before freezing, so ice growth extends beyond the initial impingement zone and the wetted/active growth region becomes much larger than in rime-dominated cases [Reference Liu, Li, Ning, Tian and Hu69]. Rotating-propeller experiments further show that, as conditions shift from rime toward mixed/glaze, the accretion footprint and surface wetting become more spatially extended and time-dependent, consistent with a film-mediated growth pathway rather than a purely local impingement and freeze process [Reference Han, Hu and Hu71]. From a modelling perspective, fully capturing this coupling often requires going beyond purely local, cellwise thermodynamic closures. Classical Messinger-type approaches are effective for evaluating local mass and heat balance and estimating ice growth and unfrozen-water outflow, but they are not generally formulated to explicitly resolve the transient redistribution of a continuous surface film. Shallow-Water Icing Models (SWIM), by contrast, solve partial differential equation (PDE)-based mass and energy transport for the surface film, while representing film motion through a lubrication-theory closure that can be extended to include pressure, gravity and rotational/body-force effects. This enables a more physically grounded treatment of the partition between local refreezing and downstream or spanwise runback [Reference Bourgault, Beaugendre and Habashi72–Reference Lavoie74]. On that basis, PDE-based shallow-water formulations can be regarded as a more suitable and extensible framework for glaze and mixed accretion regimes, especially when continuous film transport and body-force effects become important, although their adequacy for rotating components still requires dedicated validation.
Translating these physical mechanisms into predictive capability requires icing frameworks that operate in the rotating reference frame. In such non-inertial formulations, centrifugal and Coriolis terms enter the governing equations for droplet transport and, in advanced wall-film models, the closure governing near-wall liquid motion. Recent developments in rotating-component icing reflect a clear progression across the entire modelling chain. First, particle trajectory and collection solvers have been extended to relative-frame formulations that include centrifugal and Coriolis terms [Reference Rigby and von Hardenberg75]. Subsequently, shallow-water film models have been generalised to incorporate rotational forcing within the film-velocity description [Reference Sabri73]. Building on these advancements, fully three-dimensional propeller-icing computational fluid dynamics (CFD) frameworks have now integrated these rotational effects into both droplet transport and wall-film evolution [Reference Shi, Sang, Wang, Niu and Guo59]. Together, these developments enable propeller and rotor analyses in which surface-water advection responds not only to aerodynamic shear but also to rotational forcing [Reference Shi, Sang, Wang, Niu and Guo59, Reference Sabri73]. By analysing the fundamental kinematics within these formulations, it can be inferred that the centrifugal acceleration (Ω2r, directed radially outward) is likely to dominate the spanwise film drift, whereas the Coriolis acceleration (−2 Ω × v film ) primarily modifies the in-plane advection field and is expected to remain secondary for the film velocities and rotational speeds typical of small propellers. Consequently, retaining the Coriolis term is expected mainly to refine local film-thickness predictions, without fundamentally altering the spanwise mass redistribution pattern. Additionally, in rotorcraft configurations, rotor-induced inflow and wake can modify local droplet approach trajectories and the effective icing exposure relative to an isolated-body assumption [Reference Chen and Zhao76], reinforcing the premise that the final accretion pattern is a coupled outcome of rotation, local flow topology and operating state rather than impingement alone.
Neglecting rotational–radial transport is likely to bias both predicted ice shapes and the resulting aerodynamic penalties. Surface-flow analyses that explicitly include centrifugal forcing show that rotation drives liquid water outward along the span [Reference Wang and Zhu70]. Consequently, non-rotating or purely chordwise treatments are likely to under-represent tipward redistribution and the resulting outer-span accretion. Consistent with this, dynamic icing experiments on rotating UAV propellers report markedly thicker and more complex ice structures in the outer span and tip region, often accompanied by needle-shaped, ridge-like or lobster-tail-like features, together with strong thrust loss, increased power demand and enhanced force fluctuations [Reference Samad, Dhulipalla, Bowers, Rodriguez and Hu42, Reference Liu, Li, Ning, Tian and Hu69, Reference Han, Hu and Hu71]. Performance-oriented models for UAV propellers further suggest that the first shedding events are governed primarily by tip-region ice loading, with centrifugal loading at the blade tip setting a critical threshold for shedding onset [Reference Müller and Hann66]. Taken together, these results imply that fully resolving spanwise migration and tip-region accretion is essential for predictive frameworks to accurately capture both the magnitude of icing penalties and the timing or location of shedding-driven transients.
The net effect of rotational–radial physics is that RW-UAV ice shapes exhibit characteristics that underscore the need to explicitly include rotational effects. Relative to non-rotating or purely impingement-limited expectations, outboard stations can accumulate disproportionately. Furthermore, under glaze or mixed conditions, ice features may extend both farther aft, due to shear-driven runback, and farther outboard, due to centrifugal redistribution, than the direct impingement footprint alone would suggest [Reference Liu, Li, Ning, Tian and Hu69, Reference Wang and Zhu70]. Building on these transport-mediated deviations, this review argues that shedding may initiate at radial locations shifted from those predicted by models relying primarily on initial droplet impingement, although dedicated shedding-resolved validation is still needed. Capturing these transport-mediated mechanisms therefore establishes the evolving boundary conditions necessary for understanding the RW-UAV-specific ice morphologies discussed in Section 2.3.
2.3 Ice morphology on small-chord propellers
The transport mechanisms discussed in Section 2.2 determine how liquid water is redistributed on rotating blades. The present section examines the frozen manifestation of those processes, namely the specific ice geometries that develop on small-chord, high-RPM propellers [Reference Tian, Tu, Feng, Liu, Tian and Han77]. On such blades, morphology is not merely a static roughness overlay but a rapidly evolving geometry whose character depends on the local freezing fraction, the rate of water supply relative to heat removal and the spanwise position along the blade. By synthesising findings across recent experimental campaigns, it becomes evident that this sensitivity is amplified by the high collection efficiencies characteristic of small leading edge radii [Reference Tian, Tu, Feng, Liu, Tian and Han77, Reference von Hardenberg, Flack and Rigby78], a mechanism that accelerates the accretion rate relative to the chord length across a wide spectrum of scales, from small UAV propellers to large eVTOL blades [Reference Neubauer and Oztekin79].
In rime icing conditions, typically associated with colder temperatures and freezing fractions at or near unity, the morphology on small chords tends to remain comparatively regular. Experimental investigations using high-speed photography and 3D scanning indicate that rime accretions on UAV propellers generally conform closely to the leading-edge profile, with ice thickness exhibiting relatively orderly spanwise trends that often increase quadratically along the span [Reference Samad, Dhulipalla, Bowers, Rodriguez and Hu42, Reference Liu, Li, Ning, Tian and Hu69].
The absence of a persistent liquid film means that runback-driven features such as horns or ridges do not develop; instead, the accreted layer retains the stagnation-region geometry. Nevertheless, even in these comparatively streamlined rime cases, the surface texture is markedly rough. Feather-like structures have been reported to protrude into the near-wall flow [Reference Mathew, Sonker, Singh, Chaurasia and Vashishta80], which this study identifies as the source of the roughness perturbations whose significance is discussed later in this section.
As shown in Figure 3, time-resolved imaging indicates that rime accretion remains largely confined to the leading-edge region and evolves in a comparatively regular manner over time, consistent with rapid local freezing and limited runback [Reference Liu, Li, Chen, Tian and Hu81].
Time-resolved imaging of rime ice accretion on a rotating UAV propeller blade, showing the comparatively regular, conformal growth pattern characteristic of high freezing-fraction conditions. Reproduced with permission [Reference Liu, Li, Chen, Tian and Hu81].

Glaze ice morphology on small propellers, by contrast, is dominated by the presence of a persistent liquid film and its subsequent runback. Figure 4 illustrates the temporal evolution of glaze accretion on a rotating propeller blade, where the accretion footprint grows in a less uniform manner as unfrozen water is redistributed before freezing [Reference Liu, Li, Chen, Tian and Hu81].
Temporal evolution of glaze ice accretion on a rotating propeller blade, illustrating the progressive development of irregular three-dimensional structures driven by surface water runback and centrifugal redistribution. Reproduced with permission [Reference Liu, Li, Chen, Tian and Hu81].

When the local freezing fraction drops well below unity, impinging droplets do not solidify entirely at the stagnation line. The unfrozen fraction migrates chordwise and, on rotating blades, spanwise before solidifying, producing highly irregular and three-dimensional structures. The hallmark of this regime is the formation of horn, needle or ridge-type protrusions, which develop at locations where the migrating film encounters sufficient heat removal to freeze. On rotating blades, centrifugal forcing superimposes the spanwise transport component quantified in Section 2.2, so that horn geometry, height and angular orientation all vary along the span. The most pronounced features tend to concentrate in the outboard sections where centrifugal loading and local velocity are highest. Under wetter conditions, this same mechanism drives the formation of the distinctive lobster-tail and irregular icicle structures at the blade tip [Reference Tian, Tu, Feng, Liu, Tian and Han77, Reference Liu, Li, Chen, Tian and Hu81]. Because these outboard features are physically contingent on the centrifugal film transport quantified in Section 2.2, this review infers that they are inherent to the rotating environment and would not be reproduced under static or non-rotating test conditions where radial body forces are absent.
The transition between rime and glaze regimes on a single RW-UAV blade is often continuous rather than abrupt, leading to mixed morphologies that defy simple classification. Because local velocity increases linearly along the span, a propeller blade can simultaneously exhibit near-rime characteristics close to the root, where relative velocity and aerodynamic heating are low, and fully developed glaze features near the tip, where kinetic energy and centrifugal loads are highest. This mixed nature is further modulated by the operational point. Changes in RPM or angle of attack shift the stagnation-point location and the freezing-fraction distribution, altering both the spanwise location at which the rime-to-glaze transition occurs and the severity of the resulting ice ridges. Consequently, a single flight condition can produce a spanwise morphology gradient that transitions from smooth, conformal ice inboard to rough, horned structures outboard, a complexity that illustrates how the limitations of assuming a spanwise-uniform ice shape become especially apparent under such mixed morphological conditions.
Underpinning all three morphological regimes is the evolution of surface roughness, which acts simultaneously as the precursor to larger ice features and as a morphologically significant structure in its own right. Based on fundamental boundary-layer theory, it can be deduced that initial roughness elements are particularly consequential at the low Reynolds numbers characteristic of RW-UAV blades. Because the laminar boundary layer on a small chord is more susceptible to disturbance, roughness elements that would be aerodynamically insignificant on a full-scale rotor can trigger premature transition on a UAV blade. This transition in turn alters the local heat-transfer distribution and thus feeds back into the freezing process, accelerating further ice growth. In glaze conditions, this feedback is highly non-linear: as rivulets freeze and discrete roughness elements grow, they progressively coalesce into the primary ice horn structures described above [Reference Tian, Tu, Feng, Liu, Tian and Han77, Reference Liu, Li, Chen, Tian and Hu81]. Analytically, this study highlights a critical scaling challenge: for a given absolute ice thickness, the corresponding chord-normalised geometric protrusion on a small UAV propeller is inherently much larger than on a full-scale rotor blade [Reference Huang, Yuan, Wang, Peng and Liu82], making the aerodynamic penalty disproportionately severe even at accretion levels that would be considered modest in helicopter literature.
The complexity and variability of these morphologies, spanning a continuous spectrum from conformal rime through complex glaze horns to spatially varying mixed formations, underscores the importance of consistent experimental characterisation. Given that measurement resolution, thickness quantification approaches, and morphological classification criteria can vary across studies [Reference Neubauer and Oztekin79, 83], this review emphasises the need for standardised reporting practices to improve the comparability of morphological datasets, a topic discussed further in Section 4.2. Such consistency is essential because these geometric outcomes define the physical boundary conditions from which the aerodynamic and structural consequences discussed in Section 3 emerge.
3.0 Performance penalties from aerodynamics to flight stability
The performance consequences of RW-UAV icing are distinguished here at two connected levels. Propeller-level effects refer to thrust loss and the associated increases in torque and power demand of the iced rotor or propeller itself. Vehicle-level effects refer to system outcomes such as reduced control authority, rotor-to-rotor asymmetry, flight-envelope shrinkage, instability and mission abort. The two levels are coupled but not equivalent, since vehicle-level hazards arise when propeller-level penalties reduce the available trim reserve, differential-thrust authority and tolerance to wake-interaction effects.
3.1 Aerodynamic performance degradation
The morphological outcomes catalogued in Section 2.3 from conformal rime roughness through complex glaze horns to spatially varying mixed formations, each impose distinct aerodynamic penalties on small, high-RPM propellers. Because RW-UAV propellers operate at low Reynolds numbers with limited energy budgets, even minor geometric alterations to the blade profile translate rapidly into coefficient-level performance losses [Reference Hylmar, Socha, Kusmirek, Hanakova, Urban and Spak27, Reference Suurnäkki, Tiihonen and Jokela67, Reference Harvey, Villeneuve, Béland and Lapalme84]. The resulting degradation is characterised by a simultaneous reduction in thrust generation and a non-linear escalation in the torque required to maintain flight [Reference Hylmar, Socha, Kusmirek, Hanakova, Urban and Spak27, Reference Harvey, Villeneuve, Béland and Lapalme84]. For electric propulsion systems, this forces the motor to draw excessive current to sustain altitude, rapidly depleting the battery or triggering thermal cutoffs and thereby shrinking the safe flight envelope [Reference Hylmar, Socha, Kusmirek, Hanakova, Urban and Spak27, Reference Dhulipalla, Han, Hu and Hu85]. By extending these findings to real-world scenarios, these penalties are also observed beyond controlled laboratory conditions, as icing encounters in adverse-weather flights have been associated with markedly increased mission energy expenditure relative to non-icing baselines [Reference Dhulipalla, Han, Hu and Hu85].
To cross-compare penalties across varying scales, rotational speeds and atmospheric conditions, the literature standardises the following non-dimensional metrics. The thrust coefficient, torque coefficient and power coefficient are defined in Eqs. (7)–(9):
 \begin{align} C_{T}&=\frac{T}{\rho n^{2}D^{4}} \\[-8pt] \nonumber\end{align}
 \begin{align} C_{Q}&=\frac{Q}{\rho n^{2}D^{5}} \\[-8pt] \nonumber\end{align}
 \begin{align} C_{P}&=\frac{P}{\rho n^{3}D^{5}} \\[10pt] \nonumber \end{align}
where T is thrust, Q is aerodynamic torque, P is mechanical power,
 $\rho$
is air density, n is rotational speed (rev/s) and D is propeller diameter [Reference Harvey, Villeneuve, Béland and Lapalme84, Reference Samad, Ullah and Qasem86]. Rotor hover efficiency is evaluated through the Figure of Merit (FoM), as given by Eq. (10):
 \begin{align} FoM=\frac{{C_{T}}^{3/2}}{\sqrt{\pi /2}C_{P}} \end{align}
which quantifies the ratio of ideal induced power to actual power consumed.
When interpreting the experimental literature, this study emphasises the necessity of recognising the distinction between aerodynamic research metrics and operational testing data. While aerodynamic studies typically report non-dimensional polars (C T , C P ) [Reference Samad, Ullah and Qasem86], operational campaigns often utilise direct propulsion-system measurements, such as electrical current or pulse width modulation (PWM) command signal [Reference Amon, Gerstenbrand, Kozomara, Hassler, Puffing and Schweighart87]. Reports linking current draw to icing onset indicate that electrical observables are useful for diagnostic purposes [Reference Hylmar, Socha, Kusmirek, Hanakova, Urban and Spak27, Reference Amon, Gerstenbrand, Kozomara, Hassler, Puffing and Schweighart87]. However, complementing these operational metrics with normalised aerodynamic data helps separate pure aerodynamic drag penalties from the intrinsic efficiency variations of the brushless motor and electronic speed controller (ESC). Establishing transparent documentation of the measurement chain, from aerodynamic load cells to electrical measurements, presents a valuable opportunity for the RW-UAV icing community to further enhance cross-study comparability and standardisation.
The primary mechanism driving C T degradation is the progressive flow separation on the propeller blade sections caused by ice-induced morphological deformation. Because a propeller blade operates essentially as a rotating wing, the established iced-airfoil classification framework provides a helpful mechanistic baseline [Reference Bragg, Broeren and Blumenthal88]. The formation of roughness, horn ice, streamwise ice and spanwise ridge forms on the local blade sections imposes distinct separation and drag signatures that map directly onto the overall rotor penalty. At the low Reynolds numbers characteristic of small UAVs, the boundary layer is highly sensitive: early-stage roughness can trigger premature transition and amplify skin-friction, while subsequent growth of the ice features described in Section 2.3 generates separation zones that contribute to the thrust loss [Reference Muhammed, Harvey, Khawaja, Virk and Momen36, Reference Bragg, Broeren and Blumenthal88, Reference Gupta, Gahlot and Sankar89]. Numerical assessments using LEWICE and Navier–Stokes solvers have shown that for an 81% scale model of a Bell APT70 drone rotor operating at − 12 °C with an LWC of 2.3 g/m3, the sectional lift coefficient at the 75% radial station drops by nearly 50% due to extensive flow separation [Reference Gupta, Gahlot and Sankar89]. Further parametric computational studies confirm that depending on the severity of the accreted geometries and blade design, the integrated thrust coefficient can be reduced substantially, with reported losses ranging from approximately 12 to 49% [Reference Ishaque, Wang, Jiang and Wu90]. Furthermore, experimental testing of UAV propellers in simulated forward flight underscores that icing penalties can reach operationally significant levels within time scales as short as 50 s [Reference Muhammed, Harvey, Khawaja, Virk and Momen91]. From a systems perspective, this indicates that severe degradation can occur within time scales much shorter than typical detection and response intervals.
Concurrently, the aerodynamic drag of the propeller blades increases sharply, driving a corresponding rise in torque and power that manifests as elevated C Q and C P . The increase in profile drag is driven by both form drag from the enlarged frontal area of ice protrusions and skin friction from surface roughness [Reference Bragg, Broeren and Blumenthal88, Reference Gupta, Gahlot and Sankar89, Reference Samad, Dhulipalla and Hu92]. Since mechanical power is the product of torque and angular velocity, any rise in C Q necessitates a proportional rise in power to maintain RPM. Recent studies indicate that icing can increase the total electrical power burden of RW-UAV propulsion systems through both propulsion-side and protection-side mechanisms [Reference Harvey, Villeneuve, Béland and Lapalme84, Reference Frey, Müller, Wallisch and Hann93, Reference Løw-Hansen, Müller, Coates, Johansen and Hann94]. For electro-thermal ice protection systems, part of this burden arises directly from the heating power required to maintain anti-icing performance and acceptable internal temperature distributions within the propeller structure [Reference Frey, Müller, Wallisch and Hann93]. At the propulsion-system level, the aerodynamic torque increase drives higher current draw through the motor windings, so resistive losses (I2 R) and intrinsic electromechanical conversion losses further compound the shaft-power deficit [Reference Harvey, Villeneuve, Béland and Lapalme84, Reference Løw-Hansen, Müller, Coates, Johansen and Hann94]. Accordingly, the total electrical power demand can exceed the aerodynamic penalty alone, and this excess may grow with icing severity.
Operational data from recent campaigns permit stratification of these power penalties by icing regime and temporal evolution. Under glaze conditions (T ∞ ≈ −5 °C, high LWC), non-conformal ice structures cause the required hover power to approximately double within the first minutes of exposure; as runback ice continues to accumulate and event-driven shedding cycles set in, the total power demand can reach 2.5 to 3.0 times the baseline value [Reference Liu, Li, Ning, Tian and Hu69, Reference Kozomara, Neubauer, Puffing, Bednar and Breitfuss95, Reference Karpen, Diebald, Dezitter and Bonaccurso96]. Under colder rime conditions (T ∞ ≈ −10 °C), the penalty accumulates more gradually but exhibits a continuous degradation rather than a stable ceiling, reaching power increases of approximately 125%. This steady accumulation is consistent with the more conformal accretion geometry and the reduced frequency of shedding-driven excursions [Reference Karpen, Diebald, Dezitter and Bonaccurso96]. C P increases ranging from approximately 34% to 98% have been reported depending on geometric parameters [Reference Ishaque, Wang, Jiang and Wu90], a variability that highlights the highly non-linear relationship between ice mass distribution and aerodynamic penalty. Complementary propulsion-system identification work similarly reports concurrent thrust loss and torque increase trends that align with this coupled penalty picture, even when the analysis focus is not purely aerodynamic [Reference Løw-Hansen, Müller, Coates, Johansen and Hann94].
The observed magnitude and visibility of icing penalties depend strongly on the control protocol employed during testing. In constant-RPM tests, aerodynamic deterioration manifests directly as reduced thrust and lower C T , with thrust-coefficient losses of up to 70% relative to clean baselines reported under severe glaze conditions following shedding events [Reference Hylmar, Socha, Kusmirek, Hanakova, Urban and Spak27, Reference Liu, Li, Ning, Tian and Hu69, Reference Harvey, Villeneuve, Béland and Lapalme84]. In constant-thrust or free-flight configurations, by contrast, the flight controller compensates for the aerodynamic deficit by commanding progressively higher RPM [Reference Müller and Hann97]; consequently, the direct thrust loss is partially masked in the force record, while the underlying aerodynamic penalty remains visible as elevated power demand and degraded propulsive efficiency, which can ultimately push the system to exceed its motor or ESC operating limit [Reference Hylmar, Socha, Kusmirek, Hanakova, Urban and Spak27, Reference Müller and Hann97].
Climate-chamber testing further corroborates this coupling by documenting simultaneous RPM reductions, thrust loss and current increases under icing exposure [Reference Amon, Gerstenbrand, Kozomara, Hassler, Puffing and Schweighart87], illustrating how electrical observables evolve as the system attempts to sustain a commanded operating point.
Quantitative evidence from the literature highlights the sensitivity of these penalties to meteorological variables, particularly the differences between rime and glaze regimes. Glaze ice formed at warmer sub-freezing temperatures and high LWC typically results in the worst aerodynamic penalties due to high-blockage horns and complex protrusions that induce severe separation [Reference Ishaque, Wang, Jiang and Wu90, Reference Müller, Hann and Lutz98]. For example, tests conducted at − 5 °C with high LWC have shown rapid power increases early in exposure, outpacing colder rime conditions where penalty accumulation is more gradual [Reference Muhammed, Harvey, Khawaja, Virk and Momen91]. Droplet size also plays a critical role, with larger droplets exhibiting higher collection efficiencies and altered impingement limits, and increased performance degradation compared to smaller droplet cases [Reference Muhammed, Harvey, Khawaja, Virk and Momen91, Reference Villeneuve, Samad, Volat, Béland and Lapalme99]. Propeller-scale tolerance studies further suggest that geometry and scale modulate how quickly thrust loss milestones are reached under unfavourable LWC conditions [Reference Benmeddour100], reinforcing the premise that time-to-penalty is itself a sensitive outcome variable rather than a universal constant.
In summary, icing imposes a coupled penalty on RW-UAV propulsion by simultaneously decreasing thrust capability and increasing power demand, rapidly compressing the safe operating envelope under the limited electric power margins typical of small platforms [Reference Harvey, Villeneuve, Béland and Lapalme84, Reference Ishaque, Wang, Jiang and Wu90]. Drawing upon the multi-subsystem identification demonstrated in recent literature [Reference Løw-Hansen, Müller, Coates, Johansen and Hann94], this study proposes that for reproducibility and cross-study comparability, future campaigns would benefit from a dual-reporting approach that documents both non-dimensional aerodynamic coefficients (C T, C Q , C P , FoM) and raw electrical measurements alongside the control protocol, operating conditions and motor-ESC efficiency characteristics. This separation would enable the community to more precisely decompose the total penalty into its aerodynamic and electromechanical components, thereby helping to distinguish pure aerodynamic effects from drive-train dynamics or battery voltage variations. Complementing these time-averaged metrics, safety-critical transients such as imbalance, vibration growth and shedding events [Reference Han, Hu and Hu71, Reference Burger, Scheicher, Fill, Knöbl and Neubauer101] require separate treatment and are addressed in Section 3.2.
3.2 Safety-critical transients: vibration, imbalance and shedding
Time-averaged performance metrics capture the mean loss of thrust and efficiency, but RW-UAV safety can be dominated by short, high-amplitude transients associated with asymmetric accretion and shedding events [Reference Samad, Dhulipalla, Bowers, Rodriguez and Hu42, Reference Han, Hu and Hu71]. Ice accretion on small propellers is frequently non-uniform in space and time. By analysing these physical asymmetries [Reference Han, Hu and Hu71, Reference Ercan and Dalkın102], this study postulates that imbalance-driven vibration can emerge well before a mean performance threshold is reached. These transients matter because they can push the system across a hard safety boundary set by structural and control limits rather than energy margin alone.
A primary driver is rotational imbalance created by uneven ice distribution along the blades [Reference Ercan and Dalkın102]. From a fundamental mechanics perspective, it can be deduced that as the centre of mass shifts away from the rotation axis, periodic centrifugal forcing increases vibration levels and injects oscillatory loads into the airframe and onboard components. Frequency-domain analyses reported in dynamic icing experiments show a progressive intensification of vibration content as accretion develops, including growth near blade-passing harmonics and the emergence of additional low-frequency components as icing severity increases, a pattern explicitly highlighted as hazardous for onboard electronic structures and structural integrity [Reference Han, Hu and Hu71].
Ice shedding occurs when centrifugal and aerodynamic loads on the accreted mass exceed the adhesion and strength limits of the ice layer or its interface with the blade surface [Reference Samad, Dhulipalla, Bowers, Rodriguez and Hu42, Reference Sengupta, Raj, Cho, Son, Yoon and Yee103]. Shedding is event-like and can introduce an abrupt step change in mass distribution and effective blade geometry [Reference Karpen, Diebald, Dezitter and Bonaccurso96]. Consequently, it produces sudden thrust recovery spikes or power draw drops that are operationally destabilising even when mean performance remains nominal.
Independent rig studies similarly describe abrupt transitions during shedding where thrust can recover from severe deficit states while RPM jumps markedly within short intervals [Reference Catry, Bosson, Bardazzi, Márquez, Ceyhan, Brandolisio and Noca104]. These specific aerodynamic reactions lead to the conclusion that the timing and magnitude of shedding events strongly influence the system’s dynamic stability and operational boundaries.
Once released, ice fragments act as high-velocity projectiles in the rotor plane and can threaten the airframe, payloads and nearby structures. Three-dimensional trajectory reconstructions on full-scale propeller rigs demonstrate that these fragments can strike adjacent components at ejection velocities exceeding 115 m/s [Reference Burger, Scheicher, Fill, Knöbl and Neubauer101]. By correlating these kinematic trajectories with empirical impact tests, a practical severity distinction emerges: typical intercycle de-icing fragments (e.g. 2–3 g mass, <5 mm thickness) produced no measurable structural degradation over repeated collisions in the tested configurations, whereas catastrophic propeller failure was observed only under impact from substantially larger accretions (e.g. 25 g mass, >20 mm thickness), representing roughly an order-of-magnitude increase in fragment mass [Reference Hann, Müller and Wallisch105]. Complementary experimental observations emphasise that unbalanced shedding from tip regions is particularly undesirable because it amplifies vibration [Reference Løw-Hansen, Müller, Coates, Johansen and Hann94, Reference Harvey, Villeneuve, Volat, Beland and Lapalme106]. Taken together, these findings indicate that shedding events impose a dual operational hazard: structural risk from high-velocity fragment impact scaling with fragment mass, and vibrational transients driven by asymmetric mass loss, either of which can force test termination even when time-averaged thrust and torque penalties remain within a nominally recoverable range.
From a measurement standpoint, the literature indicates that visual observation alone may sometimes be limited in fully characterising imbalance triggers and shedding timing [Reference Burger, Scheicher, Fill, Knöbl and Neubauer101]. Consequently, this review emphasises that capturing safety-critical transients can be greatly improved by employing synchronised sensing, such as accelerometer-based vibration logging and time alignment with imaging, to relate visual events directly to load spikes. Evidence from recent dynamic testing campaigns demonstrates that elevated vibration levels following asymmetric shedding pose severe structural threats [Reference Han, Hu and Hu71] and frequently force premature test termination [Reference Harvey, Villeneuve, Volat, Beland and Lapalme106]. Furthermore, recent experimental observations demonstrate that passive mitigation measures designed to reduce ice adhesion do not necessarily eliminate shedding; rather, they shift the shedding frequency and can keep vibration within moderate limits long enough to observe multiple accretion-shedding cycles [Reference Harvey, Villeneuve, Volat, Beland and Lapalme106, Reference Han, Hu and Hu107].
Experimental sensor records from isolated UAV propeller tests show that ice accretion produces a progressive loss of thrust and relative efficiency, together with an increase in torque, until shedding-related transient recoveries occur. As illustrated in Figure 5, the −5 °C case, which exhibits glaze-dominated characteristic ice features, shows earlier and more recurrent shedding-related fluctuations, appearing as sawtooth-like recoveries in thrust and relative efficiency. By contrast, the −15 °C rime-dominated case shows a more delayed shedding response, with a longer ramp-like torque increase and gradual efficiency degradation before the first major recovery event. Therefore, rather than defining a universal glaze-versus-rime signature, these traces indicate that ice morphology and temperature strongly influence the timing, frequency and severity of shedding-induced performance transients [Reference Müller, Løw-Hansen, Borup and Hann68].
Propeller performance degradation without an ice protection system under two icing conditions: (left) − 5 °C case, showing earlier and recurrent shedding-related sawtooth-like recoveries in thrust and relative efficiency; (right) − 15 °C rime-dominated case, showing delayed shedding and a longer ramp-like torque increase before major recovery. Both cases were tested at v = 25 m/s, n = 4200 rpm, MVD ≈ 24.3 μm, and LWC = 0.44 g/m3. Reproduced from Reference [Reference Müller, Løw-Hansen, Borup and Hann68] under the CC BY 4.0 licence.

Concurrently, propulsion-system observables such as current draw provide an operational indicator of icing progression [83, Reference Ercan and Dalkın102]. However, because these transient responses are inherently coupled with control mode, rotor imbalance and vibration state, joint interpretation of electrical, mechanical and vibration channels is necessary to distinguish gradual aerodynamic degradation from event-driven mass-imbalance effects. In the absence of a direct optical shedding sequence, abrupt recoveries in thrust and relative efficiency, sudden changes in torque and elevated vibration levels provide a sensor-based basis for identifying shedding events and separating them from baseline performance degradation [Reference Müller, Løw-Hansen, Borup and Hann68]. While these transient phenomena have been characterised primarily under isolated-rotor conditions, their operational significance takes on new dimensions in multi-rotor configurations. Building upon this, Section 3.3 discusses how wake interactions and differential icing introduce additional compounding load asymmetries at the full-vehicle level.
3.3 Wake interaction, control authority, and flight-envelope shrinkage
The penalties and transients discussed above were characterised primarily under isolated-rotor conditions; however, operational multi-rotor RW-UAVs function in flow fields where rotor–rotor interactions can amplify these penalties non-uniformly. Particle image velocimetry (PIV) measurements on iced UAV propellers show that ice accretion, particularly under glaze conditions, can broaden the wake velocity-deficit region and intensify turbulent mixing relative to the clean case [Reference Liu, Li, Chen, Tian and Hu81]. In parallel, twin-rotor experiments with separation distances as small as 0.05D show strong near-wake interaction, including lateral wake distortion, localised recirculation, and elevated turbulence levels [Reference Ning108]. By synthesising these isolated aerodynamic and multi-rotor findings, it is reasonable to hypothesise that in an icing environment, such non-uniform inflow conditions would be expected to produce spatially non-uniform accretion and loading, with direct implications for control authority and flight-envelope integrity.
The concept of control authority in the context of RW-UAV icing refers to the remaining capacity of the actuators to generate forces and moments in excess of those required for steady-state trim. The difference between the maximum available motor power and the power consumed for trim, referred to as the trim reserve, determines the margin available for manoeuvring and gust rejection. As ice accretes, drag and blade mass increase, forcing the flight controller to command progressively higher RPM. As explicitly quantified in experimental studies on a full-scale quadcopter and illustrated in Figure 6, severe glaze icing forces highly asymmetric motor loading, while one motor may operate within a lower band (e.g. 6300–7100 RPM), the heavily iced advancing motor is driven into a significantly higher band (e.g. 7000–8200 RPM) [Reference Ercan and Dalkın102]. This continuous asymmetric thrust redistribution degrades the quadcopter’s dynamic stability and contracts the safe flight envelope before the motors’ hardware limits are reached. Concurrently, as shown in Figure 7, motor voltage sags under the sustained high-current draw; tests on the same platform recorded terminal voltage dropping from 12.29 V to 11.48 V during icing encounters [Reference Ercan and Dalkın102]. This voltage reduction lowers the maximum achievable RPM at the very moment that ice-induced drag increases the RPM required for equivalent lift. As the required RPM approaches the reduced ceiling, stability margins contract, particularly in terms of the ability to generate differential thrust for pitch and roll corrections.
Motor speed evolution during glaze icing on a full-scale quadcopter, showing progressive RPM increase to maintain altitude as drag increases. Reproduced from Reference [Reference Ercan and Dalkın102] under the CC BY 4.0 licence.

Motor voltage reduction during sustained icing exposure, showing the narrowing margin between increasing power demand and decreasing power supply. Reproduced from Reference [Reference Ercan and Dalkın102] under the CC BY 4.0 licence.

As highlighted in atmospheric icing studies, the rapid accumulation of ice consistently leads to increased power requirements and a critical loss of overall flight stability [Reference Miller, Fuchs, Omanovic, Ramelli, Seifert, Spirig, Zhang, Fons, Lohmann and Henneberger28]. From a flight-dynamics perspective, this erosion of control authority is compounded by the inherent asymmetry of ice accretion. Experimental investigations have revealed that even in controlled hover with a frontal spray, clockwise and counter-clockwise rotating propellers can accumulate different amounts of ice because the imposed spray direction and blade rotation produce different local impingement angles and exposure times over the rotor disk [Reference Ercan and Dalkın102]. The resulting differential mass and drag create a persistent yaw moment and roll imbalance that the flight controller must actively counteract.
This review identifies that the operational consequences of envelope shrinkage differ substantially between calm and wind-disturbed hover. In calm hover, the primary risk is an altitude deficit driven by an insufficient thrust reserve, whereas under gusty conditions, the risk profile shifts toward path-tracking instability as the autopilot lacks the necessary differential-thrust headroom to correct attitude perturbations. Outdoor flight data corroborate this distinction, showing that power consumption under gusty hover can nearly double relative to calm conditions [Reference Dhulipalla, Han, Hu and Hu85].
This sensitivity is further amplified under realistic low-altitude weather, where intermittent precipitation episodes have been shown to accumulate over 15% more ice mass and suppress the thrust coefficient below 10% of its design value, compared with over 16% retention under continuous icing of equal total duration [Reference Tian, Tu, Liu, Kong, Han and Tian109].
Reliable prediction of these coupled operational limits requires experimental facilities capable of combining representative wind environments with controlled icing conditions [Reference Catry, Bosson, Bardazzi, Márquez, Ceyhan, Brandolisio and Noca104], and ultimately of scaling such capabilities to multi-rotor configurations, a challenge addressed in the discussion of icing wind tunnels and test rigs in Section 4.
4.0 Methodological validity and interpretation limits
4.1 Icing wind-tunnel and test-rig boundary conditions
The performance penalties quantified in Section 3 were derived predominantly from icing wind-tunnel (IWT) campaigns and dedicated test rigs; however, the interpretation of these measurements depends on the facility’s ability to reproduce the complex interaction between the propeller’s self-induced flow field and the multiphase icing cloud. Unlike full-scale outdoor testing, which often has limited repeatability, IWT campaigns offer controlled environments but can also introduce boundary conditions that influence aerodynamic metrics. The present section examines three principal factors, namely aerodynamic blockage, droplet-cloud fidelity and scaling-law conflicts, that collectively shape how tunnel-derived data should be interpreted when relating them to the operational flight envelope.
A primary consideration in RW-UAV testing is test-section interference, which manifests differently depending on whether the facility uses a closed or open-jet configuration. When a propeller operates within the confined walls of a closed wind tunnel, the ratio of the rotor disk area to the test-section cross-sectional area governs the severity of solid wall blockage. As dictated by fundamental rotor aerodynamics, severe confinement accelerates the flow around the propeller tips and creates a back-pressure effect, which naturally influences the measured thrust and torque. To circumvent solid blockage, many experimental campaigns successfully employ open-jet configurations. For example, testing a 21-inch diameter propeller at the exit of a 70 cm × 70 cm nozzle places the propeller in a free jet [Reference Frey, Müller, Wallisch and Hann93]. As structurally detailed in Figure 8, this open-jet approach effectively mitigates direct wall confinement while allowing the flow to expand. In such setups, close-proximity ballistic shields are routinely integrated to protect test-stand instrumentation from ice-fragment impact [Reference Amon, Gerstenbrand, Kozomara, Hassler, Puffing and Schweighart87, Reference Frey, Müller, Wallisch and Hann93]. Because both closed and open-jet configurations present unique aerodynamic environments, documenting the facility geometry and shield placement is highly beneficial when interpreting performance coefficients (C T , C Q ) and correlating them with free-flight data.
Schematic view of the open-jet icing wind tunnel and propeller test stand, featuring a 70 cm × 70 cm nozzle and close-proximity ballistic shields for ice-fragment containment. Redrawn by the authors after Reference [Reference Frey, Müller, Wallisch and Hann93].

However, reducing wall interference alone is not sufficient to ensure physical fidelity, since the validity of rotor-icing measurements also depends on how accurately the droplet cloud is calibrated and preserved at the rotor plane. The critical parameters LWC, MVD and spatial uniformity must be established before the test propeller is introduced. A further limitation has been documented in closed-chamber facilities that calibrate LWC with non-thrusting cylindrical rotors. Because this method infers LWC from stagnation ice thickness, insufficient recirculation in the facility allowed the chamber temperature to drift upward and biased the inferred LWC toward glaze. Palacios et al. showed that thrusting rotors were required to maintain thermal equilibrium and obtain reliable LWC and ice-shape correlation [Reference Palacios, Han, Brouwers and Smith110].
Additional complications can arise in vertical rigs with gravity-fed spray systems. CFD analyses indicate that a horizontally rotating calibration blade can interact with the low-velocity vertical droplet flow, producing local recirculation that alters catch efficiency. As a result, the effective LWC and MVD at the blade may differ from static-calibration values. Rotating cylinders, which perturb the vertical airflow less, have therefore been adopted as an alternative calibration geometry [Reference Amon, Gerstenbrand, Kozomara, Hassler, Puffing and Schweighart87]. The associated protocols are discussed in Section 4.2.
Yet even when blockage effects and droplet-cloud calibration are carefully controlled, the interpretation of sub-scale icing data remains constrained by a more fundamental limitation, namely the inability to satisfy all relevant similarity requirements simultaneously. Scaling laws provide a theoretical mechanism to test sub-scale models when full-scale testing is precluded by blockage or facility constraints; however, RW-UAV icing involves competing similarity requirements, so that not all relevant non-dimensional parameters can generally be matched simultaneously in a physically rigorous way. Aerodynamic similarity requires matching Re and Mach number, while thermodynamic and accumulation similarity demands matching the We, n0 , and Ac [Reference Anderson and Tsao52]. By extending these general scaling principles to UAV kinematics, it can be deduced that for small-chord propellers, maintaining Re similarity often requires high rotational speeds that generate significant kinetic heating, which can create a scaling tension with the thermal scaling required to simulate glaze ice accretion. Additionally, simulating SLD conditions introduces higher-inertia droplet trajectories that deviate from standard Stokes-flow assumptions, a factor that directly enters into the calculation of collection efficiency [Reference Tsao22, Reference Hu, Zhu, Hu, Chen and Du111]. If the scaling method prioritises the Weber number to preserve surface-water dynamics and film-breakup physics, it can also shift the thermal balance that governs freezing-fraction similarity, thereby altering the resulting ice-shape morphology [Reference Tsao22, Reference Anderson and Tsao52]. Because no single scaling approach can represent all ice-accretion physics simultaneously on a sub-scale UAV propeller, different scaling priorities naturally emphasise different physical aspects, which are detailed in Section 4.2.
Beyond the fundamental physics, this review emphasises that test-rig instrumentation and control logic inherently shape the operational conditions of the experiments. For instance, unexpected spikes in RPM sensor readings at the beginning of a test campaign have led investigators to adopt constant-input mode instead of constant-RPM mode. Operating in constant-input mode makes direct comparisons between runs difficult, since differences in RPM directly affect the ice accretion and the shedding behaviour [Reference Kozomara, Amon, Puffing, Moser, Breitfuss, Neubauer, Schweighart, Bednar and Thein112]. Furthermore, experimental tests in icing wind tunnels face discrepancies between runs. These discrepancies are driven by minor variations in material, sensor positions and changing ambient conditions such as humidity or small amounts of ice accretion on the nozzles. To minimise these uncertainties and ensure reliable results, performing test repetitions is a necessary procedural step [Reference Frey, Müller, Wallisch and Hann93].
In summary, IWT and test-rig campaigns provide essential datasets for characterising RW-UAV icing, but these datasets inherently reflect the specific facility boundary conditions and limitations. The principal physical factors discussed above, namely blockage, cloud calibration, similarity conflicts and instrumentation constraints, are directly related to the penalty magnitudes reported in Section 3. To contextualise these variables, Section 4.2 outlines a framework detailing aerodynamic blockage ratios, cloud-uniformity verification, scaling laws and quantitative uncertainty budgets. Integrating this contextual information allows tunnel-derived performance penalties to be interpreted and compared more robustly.
4.2 Measurement protocols and reporting standards
The characterisation of RW-UAV icing performance involves specific sets of variables, ranging from non-dimensional aerodynamic coefficients (C T , C P ) to hardware-specific measurements and control variables, such as electrical current and PWM. Alongside these metrics, the operational control logic, whether implemented in constant input, constant speed or constant thrust modes, and the associated measurement uncertainties define the effective operating conditions of the experimental setup [Reference Amon, Gerstenbrand, Kozomara, Hassler, Puffing and Schweighart87]. This review emphasises that documenting these system-specific variables provides the direct physical context for the resulting datasets.
The aerodynamic and meteorological environment is physically characterised by T ∞ , V ∞ , LWC and MVD. These parameters are typically accompanied by a cloud-uniformity assessment supported by grid-based accretion measurements. SAE ARP5905 defines a uniform icing cloud as the region where LWC does not deviate by more than ±20% from the centreline value [113], providing a useful quantitative baseline for assessing cloud uniformity in UAV icing tests. Physical validation of this spatial uniformity is typically supported by specialised calibration grids that map the accretion distribution across the test section prior to propeller introduction [Reference Amon, Gerstenbrand, Kozomara, Hassler, Puffing and Schweighart87]. Furthermore, when scaling laws are employed to test sub-scale propellers, specifying the chosen scaling method and the matched non-dimensional parameters clarifies the physical priorities of the test, as discussed in Section 4.1 [Reference Anderson and Tsao52].
Finally, the derivation of LWC relies on specific calibration techniques, such as the icing blade or rotating cylinder methods, while laser diffraction enables direct MVD verification at the rotor-disk plane [Reference Amon, Gerstenbrand, Kozomara, Hassler, Puffing and Schweighart87].
Regarding operational protocols, the distinction between constant-RPM, constant-thrust and constant-input modes defines different facets of the system’s response to the icing penalty (Section 3.1) [Reference Amon, Gerstenbrand, Kozomara, Hassler, Puffing and Schweighart87]. As noted in Section 4.1, instrumentation phenomena such as unexpected sensor spikes can lead to the utilisation of constant-input control instead of constant-RPM loops [Reference Kozomara, Amon, Puffing, Moser, Breitfuss, Neubauer, Schweighart, Bednar and Thein112]. Furthermore, the mathematical conversion of electrical measurements into non-dimensional coefficients (C T , C Q , C P ) and FoM establishes a basis for cross-platform comparisons independent of the specific propulsion train. In this context, Cheung et al. developed an icing severity index (ISI) for a fixed-wing UAV that quantifies the power consumption increase under various icing conditions as a single scalar metric derived from aerodynamic performance degradation curves [Reference Cheung, Hann and Johansen114]. Although their formulation combines wing and propeller contributions, the underlying rotor-degradation component, which isolates propeller efficiency loss as the dominant driver of power penalty, offers a potentially adaptable framework for RW-UAV applications.
For capturing the safety-critical transients documented in Section 3.2, the temporal synchronisation of the measurement channels plays an important role. Shedding events, vibration spikes and thrust recovery transients unfold on sub-second time scales; for example, high-speed cameras operating at over 1400 fps have been employed to resolve individual shedding trajectories [Reference Amon, Gerstenbrand, Kozomara, Hassler, Puffing and Schweighart87, Reference Kozomara, Amon, Puffing, Moser, Breitfuss, Neubauer, Schweighart, Bednar and Thein112]. The physical identification of these dynamic events relies on force-balance, RPM, electrical measurements and high-speed-video data sharing a common time base with a defined trigger or alignment procedure [Reference Amon, Gerstenbrand, Kozomara, Hassler, Puffing and Schweighart87, Reference Kozomara, Amon, Puffing, Moser, Breitfuss, Neubauer, Schweighart, Bednar and Thein112]. The explicit documentation of sampling rates, synchronisation methods, and post-hoc filtering characterises exactly how transient signatures are quantitatively separated from baseline instrumentation noise.
The physical characterisation of the accreted ice is equally critical for validating numerical codes and correlating severity indices. In addition to the duration of exposure, documenting the final ice mass [Reference Muhammed, Harvey, Khawaja, Virk and Momen36], maximum thickness distributions from 3D scanning [Reference Kozomara, Amon, Puffing, Moser, Breitfuss, Neubauer, Schweighart, Bednar and Thein112] and substrate surface roughness prior to testing [Reference Muhammed, Harvey, Khawaja, Virk and Momen36] provides essential baseline metrics for cross-study comparison. From a validation standpoint, capturing this exact geometric data is required to reliably correlate aerodynamic performance degradation with the morphological evolution of the ice accretion. In this context, high-fidelity 3D laser scanning enables the digitisation of complex glaze ice shapes, capturing detailed features such as horn angles and spanwise ridges that are typically challenging to record using traditional manual tracing methods [Reference McClain, Vargas, Tsao and Broeren20, Reference Tsao22]. As visualised in Figure 9, high-fidelity 3D laser scanning of an iced UAV propeller blade captures the highly irregular, three-dimensional ice topologies, including complex spanwise thickness gradients and glaze ice features [Reference Kozomara, Amon, Puffing, Neubauer, Schweighart, Diebald, Rapf, Moser and Breitfuss29]; such three-dimensional detail is difficult to represent through localised 2D profiles alone.
Ice-thickness distributions reconstructed from 3D scans for an unprotected glaze ice case and rime ice case on a UAV propeller. Adapted with permission [Reference Kozomara, Amon, Puffing, Neubauer, Schweighart, Diebald, Rapf, Moser and Breitfuss29].

In parallel with geometric documentation, uncertainty reporting remains essential for interpreting whether observed differences reflect true icing effects or measurement limitations.
For instance, because strain gauges used for thrust measurement are susceptible to thermal drift in cold environments, applying specific thermal correction factors compensates for temperature effects on the calibration curve [Reference Karpen, Diebald, Dezitter and Bonaccurso96]. Rather than representing universal constants, reported uncertainty bounds are inherently facility-specific; for example, recent calibrations at the icing wind tunnel report measurement variances of approximately ±1.5% for thrust, ±10% for power, ±10% for LWC and ±20% for MVD [Reference Muhammed, Harvey, Khawaja, Virk and Momen36]. This review highlights that an MVD uncertainty of ±20% carries direct physical consequences; near the approximately 40
 $\unicode{x03BC}$
m upper MVD bound of the conventional Appendix C envelope (Section 1.3), such variance can inadvertently alter the nominal icing-envelope classification, reinforcing the need to report facility-specific calibration data rather than adopting nominal values. In addition, under glaze ice conditions, repeat runs highlight the inherent variability of ice shedding [Reference Kozomara, Amon, Puffing, Moser, Breitfuss, Neubauer, Schweighart, Bednar and Thein112]; this review emphasises that such data are particularly important for distinguishing stochastic shedding events from systematic aerodynamic trends, given that shedding timing and fragment mass are inherently variable even under nominally identical conditions.
Based on the reviewed literature, Table 2 synthesises a baseline reporting framework for future RW-UAV icing studies. Documenting these experimental parameters establishes the physical boundary conditions necessary to address the numerical modelling challenges discussed in Section 4.3, specifically regarding the simulation of surface roughness and transition in rotating reference frames.
The UAV-specific value of this reporting framework lies in how these otherwise standard quantities control comparability for small rotating propellers. The control mode should be stated because the same aerodynamic penalty can appear as a thrust deficit under constant-RPM operation, an RPM drop under constant-input operation, or an increased power demand under compensating control logic, so results obtained under different modes are not directly comparable. Propeller geometry, including the chord distribution, is required because a fixed absolute ice thickness produces a much larger chord-normalised distortion on centimetre-scale blades than on larger rotors, setting the roughness-to-chord ratio that drives the low-Reynolds-number penalty. Radial ice distribution should be documented because the accretion field on small rotating propellers is strongly spanwise non-uniform and tip-biased, so a single maximum thickness or total ice mass cannot reconstruct either the aerodynamic penalty or the shedding risk. Cloud calibration and uniformity mapping are equally critical because a small rotor disk can occupy a large fraction of the test section, so spatial nonuniformity is sampled as artificial radial accretion bias.
Baseline reporting framework for RW-UAV icing experiments

Table 2. Long description
A table with 9 rows and 6 columns comparing parameters for rotorcraft icing experiments. The columns are Similarity parameter, Physical significance, Conventional rotorcraft regime, Scaling deviation in RW-UAV regime, Consequence of parameter mismatch, and References. Row 1: Reynolds Number (Re), Boundary-layer state, laminar-turbulent transition location, and flow separation characteristics, Boundary layers are fully turbulent (Re > 10^6); robust against moderate surface roughness, Laminar and transitional flows dominate; LSB form and are highly sensitive to initial ice roughness, Incorrect stall prediction; underestimation of drag penalties; erroneous LSB behaviour, 49, 50. Row 2: Droplet Inertia (K, K_β, β), Droplet trajectory fidelity, modified inertia parameter K_β and β, Collection efficiency is moderate due to large leading-edge radius; impingement confined to narrow stagnation zone, Small chord and leading-edge radius yield elevated K; β approaches unity across the entire leading-edge region, Underestimation of impinging water mass and ice accretion rate; non-representative impingement limits, 51, 58-60, 62. Row 3: Accumulation Parameter (Ac), Ratio of impinging water mass to characteristic ice thickness over exposure time; governs ice shape fidelity in scaled tests, Standard scaling parameter; matched routinely between reference and scale models in IRT testing, Coupled to the elevated β of small chords; same LWC and exposure time produce proportionally thicker ice relative to chord, Non-representative ice thickness and shape; incorrect icing severity assessment, 58, 64, 65. Row 4: Weber Number (We), Aerodynamic droplet deformation and possible break-up before impact; post-impact splashing governed by additional impact-specific parameters, Relevant at high relative velocities and in SLD conditions; splashing is assessed separately, Often secondary in rime conditions but relevant at high UAV tip speeds and in SLD regimes; unmatched We yields incorrect splash/bounce-off fraction, Incorrect droplet-size distribution, collection efficiency, and net deposited mass, 48, 58. Row 5: Thermodynamic Similarity (n_0, energy balance, convective heat transfer), Freezing fraction (n_0), convective heat transfer coefficient, ice type (rime vs. glaze), and surface energy balance, Fully turbulent heat-transfer correlations are well-validated; standard Messinger energy balance applies reliably, Laminar/transitional convective heat transfer deviates from turbulent correlations in legacy codes (LEWICE, FENSAP-ICE); alters predicted n_0 and rime/glaze boundary, Misidentification of rime vs. glaze regime; incorrect ice shape morphology and runback ice extent, 50, 53, 54, 68. Row 6: Surface Roughness (k_s), Equivalent sand-grain roughness height; links ice surface texture to boundary-layer transition and convective heat transfer, Roughness is small relative to boundary-layer thickness; correlations derived from fixed-wing stagnation zone experiments, Ice roughness can equal or exceed local boundary-layer height, triggering premature transition or LSB burst; RW-UAV-specific validation remains limited, Inaccurate sectional and integrated aerodynamic coefficients in simulations; mispredicted drag penalty magnitude, 50, 56, 57. Row 7: Advance Ratio (J), Aerodynamic operating point of the rotor; governs spanwise angle-of-attack distribution and inflow angle, Defines flight state (hover vs. forward flight); well-characterised in helicopter performance maps, Determines local α and chordwise impingement distribution; mismatch in J between test and operation can produce non-representative accretion morphology, Non-representative thrust/torque coefficient degradation; mispredicted icing severity along span, 65, 66. Row 8: Tip Mach Number (M_tip), Compressibility effects on local thermodynamics and flow field near the blade tip, Critical design constraint; transonic effects at blade tip strongly modify pressure and temperature fields, Generally subsonic for small UAV propellers; however, at tip speeds O (10^2 m/s), stagnation temperature rise biases local n_0 and shifts locus of maximum accretion, Systematic thermodynamic offset in predicted freezing fraction when tip speeds differ between test and operation, 56, 68.
4.3 Numerical modelling challenges and scale-transfer limits for rotating low-Re geometries
The reporting standards proposed in Section 4.2 address the experimental side of the data-credibility problem; however, the numerical prediction of ice accretion on RW-UAV propellers involves specific modelling considerations that arise from the unique combination of low Reynolds numbers, high rotational speeds and small geometric scales. Unlike large manned aircraft where the flow over the blade is predominantly turbulent, small UAV propellers operate in a regime that is highly sensitive to laminar-turbulent transition and LSB. Because these boundary-layer features govern the surface energy balance, the numerical outcomes are directly influenced by the modelling configuration, particularly the choice of turbulence closure, roughness parameterisation, dimensionality and coupling strategy.
Within the CFD workflow, the selection of the turbulence model fundamentally defines the boundary-layer behaviour. Many icing simulations employ fully turbulent closures, based on the physical premise that macroscopic ice roughness initiates an immediate transition across the wetted surface [Reference Heramarwan, Müller, Hann and Lutz115, Reference Müller and Hann116]. However, at the low Reynolds numbers characteristic of RW-UAV propellers, where transition location and transition behaviour are aerodynamically significant, imposing a fully turbulent boundary layer from the outset can modify the predicted leading-edge heat-transfer coefficient before roughness has physically developed to a level that would naturally promote transition. This, in turn, may affect the initial ice-growth rate and the morphological evolution of the accretion. While the fully turbulent assumption has been shown to align with experimental observations under specific wet anti-icing conditions in electro-thermal ice protection systems (ETIPS), where fluid beads and rivulets force early transition [Reference Frey, Müller, Wallisch and Hann93], the larger boundary layer thicknesses typical of low-Re UAV flight indicate that this assumption, originally developed for manned aviation applications, manifests differently at smaller scales [Reference Heramarwan, Müller, Hann and Lutz115]. The practical consequence is that the choice between a transition-sensitive and a fully turbulent model can materially alter the predicted freezing balance, ice morphology and the associated aerodynamic penalties, even for the same geometry under identical environmental conditions. The specific turbulence closure therefore constitutes a critical modelling choice when interpreting the simulated ice accretion behaviour.
The representation of surface roughness constitutes another fundamental modeling parameter. In codes such as FENSAP-ICE or LEWICE, roughness is typically initialised using a uniform sand-grain height (k
s
). For standard icing simulations, the current practice is to initialise sand-grain roughness at 0.5 mm for geometries with chords larger than 0.5 m [Reference Ishaque, Wang, Jiang and Wu90]. However, for a small UAV propeller with a chord of only 20–40 mm, applying this commonly adopted initialisation yields a relative roughness of k
s
/c ≈ 0.013–0.025, which is mathematically an order of magnitude larger than the k
s
/c ≈ 10-3 scale implied by the same 0.5 mm initialisation for larger rotor geometries (c ≥ 0.5 m). From an aerodynamic standpoint, such elevated relative roughness values alter the boundary-layer energy balance and influence the predicted convective heat transfer, which in turn determines the calculated ice regime. To address the specific dynamics of small chords (
 $\lt $
0.5 m), an alternative approach in FENSAP-ICE utilises a short initialisation pass (e.g. 0.5 s) with zero roughness to generate a calculated roughness map based on water-beading models. In this approach, the resolution of glaze ice features is directly dependent on the chosen time step, with shorter intervals yielding higher fidelity [Reference Ishaque, Wang, Jiang and Wu90]. Because the specific roughness distribution determines the convective heat-transfer predictions independently of the global catch efficiency, these modelling dynamics highlight the physical relevance of the spatially resolved experimental roughness data discussed in Section 4.2.
The simulation of rotating components involves specific three-dimensional flow features that differentiate 3D outcomes from two-dimensional strip-theory analyses. In glaze-icing conditions, the centrifugal force drives the unfrozen water film and surface beads toward the blade tip (spanwise transport), a mechanism quantified in Section 2.2. From a theoretical modelling perspective, it must be noted that because two-dimensional simulations evaluate infinite-span sections, they inherently do not account for this spanwise mass transport, which leads to different thickness distributions compared to 3D models. A recent comparison of 2D and 3D simulations on an eVTOL propeller demonstrated that three-dimensional models can predict more streamlined ice shapes and, in some cases, an ice-free outboard region near the blade tip. This behaviour has been attributed to three-dimensional cross-flow effects and local kinetic heating, which are not represented in 2D strip-theory formulations [Reference Heramarwan, Müller, Hann and Lutz115]. As illustrated in Figure 10, this eVTOL-based 3D simulation provides a methodological example of how radial variations in ice accretion can emerge in ways that 2D strip-theory cannot resolve [Reference Heramarwan, Müller, Hann and Lutz115]. Additionally, the use of moving reference frames (MRF) or periodic boundary conditions in 3D CFD requires specific domain sizing considerations. In the cited 3D studies, far-field boundaries extend several rotor radii, with reported setups using approximately 5–8R upstream and 10–20R downstream to ensure the unconstrained development of the wake and tip vortices [Reference Ishaque, Wang, Jiang and Wu90, Reference Müller and Hann116]. As identified in this review, these domain boundaries are critical because they can influence the incoming droplet trajectories, wake development and therefore the predicted impingement patterns.
Three-dimensional ice accretion simulation on an eVTOL propeller (methodological reference), showing an ice-free outboard region associated with spanwise transport, cross-flow and local kinetic-heating effects that are not captured in 2D strip-theory. Reproduced with permission [Reference Heramarwan, Müller, Hann and Lutz115].

Beyond these spatial discretisation and domain boundaries, multiphysics coupling introduces additional computational dynamics, particularly in the interaction between the aerodynamic, thermodynamic and accretion solvers. The standard multi-shot approach, in which the computational mesh is updated at discrete time intervals to reflect the evolving ice geometry, effectively assumes that ice growth remains slow relative to the flow time scale within each interval [Reference Ishaque, Wang, Jiang and Wu90]. For small propellers, however, horn-ice growth may become rapid relative to the local chord, leading to large separated-flow regions that are difficult for standard steady-state Reynolds-averaged Navier–Stokes (RANS) formulations to resolve accurately between mesh updates. Numerical investigations on predefined horn-ice geometries show that steady-state RANS can reproduce thrust-coefficient trends for moderate ice positions, while under-resolving the separated-flow regions associated with the most severe upper-surface horn configurations [Reference Felix and da Silva117]. Moreover, conjugate heat transfer (CHT) simulations reveal that internal heat conduction within composite blades is a significant thermodynamic factor [Reference Frey, Müller, Wallisch and Hann93]. Consequently, in icing simulations, adiabatic-wall or prescribed-surface-temperature assumptions may shift the predicted balance between running-wet and fully evaporative behaviour, with direct implications for anti-icing-system design.
A specific UAV-propeller benchmark is provided by Müller et al. [Reference Müller, Løw-Hansen, Borup and Hann68], who used ANSYS FENSAP-ICE, coupling the FENSAP flow solver, DROP3D Eulerian impingement module and ICE3D heat-load solver, to estimate running-wet anti-icing heat loads for a 0.53 m propeller tested in an icing wind tunnel at 4200 rpm, LWC = 0.44 g/m3, and MVD ≈ 24.2
 $\unicode{x03BC}$
m. Their numerical setup used a three-dimensional moving-reference-frame formulation, periodic blade treatment, a fully turbulent Spalart–Allmaras closure and a prescribed roughness height of k
s
= 0.5 mm. The predicted IPS powers of 46.2 W, 97.0 W, and 138.6 W at − 5 °C, −10 °C, and − 15 °C were found to underestimate the experimentally required input, with full anti-icing not achieved at − 10 °C even when the supplied IPS power was increased up to 250 W. Importantly, the authors attributed this shortfall partly to internal heat conduction within the composite blade, consistent with the CHT sensitivity noted above [Reference Frey, Müller, Wallisch and Hann93], together with blade-to-blade heater imbalance, the use of peak rather than surface-integrated heat-flux estimates and limited leading-edge mesh resolution. They also identified the fully turbulent assumption, surface-roughness modelling, possible laminar separation bubbles and the manned-aviation validation range of the underlying tools as additional transferability limits for small low-Reynolds-number UAV propellers. This case therefore provides a concrete validation example showing that icing-CFD tools can provide useful first-order heat-load distributions for propeller IPS design, while still underpredicting the heat input required for full anti-icing when low-Re, thermal-conduction and resolution effects are not fully captured.
The dimensionality limitations discussed above extend also to ice-shedding prediction, which is inherently three-dimensional and is not directly resolved by standard multi-shot accretion workflows. At the rotorcraft scale, Morelli and Guardone [Reference Morelli and Guardone118] coupled three-dimensional rotor-flow prediction, Lagrangian droplet tracking, ice accretion, mesh deformation and a shedding criterion based on centrifugal loading versus adhesive and cohesive strength, with SRB-II comparisons for ice thickness and shedding location. This rotorcraft-scale evidence indicates that shedding, governed by moving-boundary and adhesion effects, constitutes a distinct three-dimensional modelling challenge whose transfer to small low-Re propellers remains to be established, particularly where shedding drives the thrust-recovery and vibration transients discussed in Section 3.2.
A separate but related numerical challenge concerns reduced-order wake representation, particularly when downstream droplet transport and local icing exposure depend on the fidelity of the rotor-wake model. RW-UAV-specific evidence on actuator-based icing wake modelling remains limited. Therefore, helicopter-rotor studies are cited here not as direct scale analogues, but as methodological reference cases for understanding how actuator disk models (ADM) and actuator surface models (ASM) differ in their treatment of rotor-wake topology and downstream droplet transport. Within this methodological context, helicopter-rotor studies provide useful baseline insight, although direct UAV-scale validation of these findings remains limited. Full-scale helicopter simulations have shown that ADM spatially and temporally averages the influence of individual blades, whereas ASM resolves these dynamics more explicitly by capturing discrete tip vortices and inboard sheets, although it still remains less detailed than fully blade-resolved geometry for resolving local icing-relevant flow structures [Reference Son, Oh and Yee119].
For RW-UAVs, these helicopter-scale findings should therefore be interpreted only as a qualitative methodological analogy, suggesting that wake-model choice may influence predicted downstream flow distortion and icing exposure on nearby components. The extent to which this sensitivity transfers quantitatively to small-clearance RW-UAV configurations remains to be established through dedicated validation.
The physical mechanisms, aerodynamic penalties and methodological constraints examined in Sections 2–4 collectively define the design envelope within which ice protection must operate. Translating this understanding into practical mitigation requires evaluating passive, active and hybrid strategies against the battery-capacity and weight limits that distinguish small electric rotorcraft from manned platforms.
5.0 Mitigation under energy and payload constraints
The integration of RW-UAV systems in icing conditions requires evaluating the trade-offs between aerodynamic performance degradation and the energy and weight penalties imposed by ice protection systems (IPS). Unlike manned helicopters, small- and medium-scale RW-UAVs are strictly constrained by battery capacity and maximum take-off weight (MTOW) limits; this reality shifts the operational design from maintaining a completely ice-free surface [Reference Müller and Hann120, Reference Fürbacher, Hassler, Steiner, Neubauer, Hufnagl, Bača, Kozomara, Spalt, Hinterer and Liedl121] to adopting what this review identifies as a tolerable performance loss strategy, where efficiency is maintained within defined boundaries. The viability of an IPS is measured not only by its ability to clear ice but also by the extent to which it influences flight range and endurance. For instance, while continuous active heating can entirely prevent ice accretion, the associated power consumption directly reduces operational flight time. Conversely, a passive coating consumes no energy but relies on available aerodynamic and centrifugal forces for ice removal, a mechanism that can result in asymmetrical shedding events and subsequent rotor imbalances [Reference Samad, Dhulipalla and Hu122]. Therefore, the evaluation of RW-UAV mitigation strategies centres on balancing power, mass, system complexity and failure modes to establish safe operational boundaries. This evaluation is further conditioned by the scaling constraints established earlier in this review. On small-chord blades, chord-normalised roughness is inherently amplified and centrifugal redistribution governs the accretion footprint. Consequently, the effectiveness of any mitigation strategy depends not only on its ice-removal capacity but also on how the residual surface texture interacts with the low-Re boundary layer.
Based on energy and hardware requirements, ice mitigation methods are broadly classified into four main categories: operational, passive, active, and hybrid. Operational strategies involve avoidance manoeuvres, such as route planning or flight cancellation, which incur no hardware penalties but inherently restrict the operational envelope in cold climates [Reference Tian, Li and Xia123]. Passive methods utilise icephobic or superhydrophobic (SHS) coatings to reduce ice adhesion strength and delay nucleation without active energy input [Reference Facco, Parin, Basso, Martucci and Colusso124]. Active methods utilise electro-thermal, fluid-based or mechanical (pneumatic/ultrasonic) energy to melt or fracture the accreted ice [Reference Kozomara, Amon, Puffing, Moser, Breitfuss, Neubauer, Schweighart, Bednar and Thein112, Reference Tian, Li and Xia123]. Hybrid systems combine the adhesion-reducing effects of passive coatings with the targeted energy input of active systems to minimise overall power consumption [Reference Samad, Dhulipalla and Hu122]. In RW-UAV design, the selection among these classes is dictated by the vehicle’s power budget and the expected icing envelope.
The fundamental trade-off of passive mitigation methods (coatings) lies in the stochastic nature of their protection guarantee, despite offering zero energy consumption. Passive surfaces do not entirely prevent ice accretion; rather, they reduce the adhesion strength and the critical mass required for the ice to shed under centrifugal forces [Reference Harvey, Villeneuve, Volat, Beland and Lapalme106]. Experimental studies demonstrate that under glaze icing conditions (around −5°C), icephobic coatings facilitate earlier shedding in smaller fragments, thereby limiting thrust coefficient degradation to 20–30% [Reference Villeneuve, Samad, Volat, Béland and Lapalme125] which may keep performance within an operationally tolerable range for the tested platform. However, under rime icing conditions (−10°C and below) or low-LWC scenarios, low temperatures and aerodynamic forces constrain the coating’s effectiveness; ice adhesion strength increases, limiting itsstandalone effectiveness in severe environments [Reference Han, Hu and Hu107]. Furthermore, coating degradation over time (durability issues) can lead to increased surface roughness and a decline in initial performance [Reference Harvey, Villeneuve, Volat, Beland and Lapalme106]. Consequently, these empirical limitations imply that the operational envelope of an RW-UAV relying solely on passive protection is generally constrained to relatively mild sub-freezing conditions, where adhesion levels remain low enough and centrifugal shedding remains sufficiently effective to limit the aerodynamic penalty.
Conversely, the trade-off analysis for active and hybrid systems is predicated directly on power density and system weight. ETIPS generally provide the most robust protection but incur high energy costs. In the propeller-integrated study of Karpen et al., a distributed heater at an average power density of 1 W/cm2 operated successfully under glaze conditions by maintaining a running-wet regime in which centrifugal forces shed the liquid water before refreezing could occur; under rime conditions, however, instantaneous freezing upon impact demanded a localised heat flux approaching 2 W/cm2 that the distributed configuration could not sustain [Reference Karpen, Diebald, Dezitter and Bonaccurso96]. For a small quadcopter, this translates to consuming a substantial fraction of the total battery capacity solely for heating. Additionally, while restricting the heated zone to the leading-edge impingement area minimises energy consumption, the subsequent refreezing of melted water as runback ice behind the protected zone can severely degrade aerodynamic performance [Reference Müller and Hann120]. Moreover, CHT simulations for composite propellers indicate that internal temperatures must not exceed structural limits (e.g., 60°C) to preserve structural integrity, necessitating a critical optimisation between sufficient anti-icing performance and material safety [Reference Frey, Müller, Wallisch and Hann93]. Fluid-based systems offer comparatively low electrical power for operation (30–50 W); however, the required fluid tank (payload) limits flight endurance, and protection ceases once the fluid is depleted [Reference Kozomara, Amon, Puffing, Moser, Breitfuss, Neubauer, Schweighart, Bednar and Thein112]. Hybrid strategies emerge as a promising solution at this juncture, because applying SHS to heated zones can substantially reduce runback ice formation by facilitating expulsion of melted water, with reported heating power reductions of up to 40% [Reference Samad, Dhulipalla and Hu122].
Within the framework proposed by this review, the operational decision logic of the RW-UAV flight controller depends on real-time sensor data to define flight boundaries. The governing variable is the local icing regime rather than temperature alone, because the rime-to-glaze transition is jointly controlled by temperature, LWC, MVD, airspeed and blade geometry. Under conditions that promote glaze accretion, the synergistic effect of passive or low-power hybrid systems and centrifugal forces can facilitate continuous shedding; as conditions shift toward rime-dominated accretion, ice adhesion strength increases and centrifugal shedding alone becomes insufficient, necessitating higher-power active systems [Reference Karpen, Diebald, Dezitter and Bonaccurso96, Reference Villeneuve, Samad, Volat, Béland and Lapalme125].
Beyond the icing regime, the vehicle’s available thrust margin is reflected in motor PWM signals or current draw. As the power required to maintain flight under icing conditions approaches the motor’s maximum continuous power rating or the battery’s safe discharge limit, the system’s control authority is reduced both mathematically and physically. At the same time, vibration sensor data provides direct feedback on shedding asymmetry, since vibration spikes that exceed structural limits indicate mass imbalances that alter the dynamic stability of the rotor. System endurance, in turn, depends on evaluating the remaining available resources, such as the fluid volume in fluid-based systems or battery voltage sag in electro-thermal systems, against the operational time required for safe return.
The quantitative evaluation of mitigation systems aligns directly with the reporting approaches discussed in Section 4.2. Standardised performance metrics provide direct physical context for the system’s efficiency. For active systems, effectiveness is quantified using required heating power and average power density (W/cm2) [Reference Tepylo, Budinger and Pommier-Budinger126]. For passive systems, the adhesion reduction factor (ARF) and shedding behaviour characterise the coating’s specific aerodynamic benefit [Reference Harvey, Villeneuve, Volat, Beland and Lapalme106]. Furthermore, evaluating the temporal durability of these coatings under continuous droplet impingement provides critical context, as rapid surface wear inherently diminishes the sustained thrust recovery [Reference Hunt, Rawlins and Hill127]. Crucially, the physical integration of an ice protection system can itself introduce baseline aerodynamic and dynamic penalties even before icing exposure. As shown in Figure 11, the IPS-equipped propeller in Karpen et al. produced only 87% of the reference thrust over the operating range and exhibited two well-defined resonance frequencies, which were probably associated with added weight and potential imbalance introduced by the integrated system [Reference Karpen, Diebald, Dezitter and Bonaccurso96]. Documenting these baseline penalties helps define the practical boundary conditions for evaluating the net payload and energy trade-offs of future RW-UAV icing-mitigation concepts.
Baseline thrust and vibration response of a reference propeller and an IPS-equipped propeller as a function of input pulse width, showing reduced thrust and resonance-sensitive operating regions after IPS integration. Reproduced with permission [Reference Karpen, Diebald, Dezitter and Bonaccurso96].

6.0 Conclusions and future gaps
This review has synthesised the physical mechanisms, aerodynamic consequences, experimental methodologies, numerical modelling challenges and mitigation strategies associated with ice accretion on RW-UAVs. The analysis was organised around the central premise that the scaling break between manned rotorcraft and small RW-UAV propellers materially changes how ice forms, redistributes and degrades performance, so that helicopter-scale correlations may not remain directly transferable to small-chord, high-RPM propellers without additional scale-aware validation. The central conclusion is therefore not simply that icing effects are stronger at small scale, but that the controlling mechanisms change in scale-dependent ways that require separate interpretation for RW-UAV propellers.
The reviewed evidence indicates that the scale-transfer problem affects successive stages of the accretion and performance chain rather than only the initial impingement process. On small-chord propellers, collection efficiency can reach or exceed unity near the stagnation line, so that even conditions within the Appendix C envelope may produce accretion rates that are severe relative to the local chord. For a given absolute roughness or ice-feature height, the chord-normalised value is roughly an order of magnitude larger than on full-scale rotor geometries, amplifying penalties on the laminar and transitional boundary layers typical of these blades. At outboard stations, centrifugal body forces can substantially exceed local aerodynamic shear, driving preferential tip-ward water redistribution and producing lobster-tail morphologies and tip-dominated thickness distributions that are not widely reported in manned-rotorcraft icing at comparable exposure times. The resulting ice geometries, ranging from conformal rime to glaze horns and continuous spanwise gradients on a single blade, reduce thrust while increasing power demand, and the associated shedding transients can dominate the operational hazard on time scales far shorter than time-averaged metrics capture. At the vehicle level, trim-reserve depletion, rotor-to-rotor differential icing, and wake interaction can shrink the flight envelope toward conditions in which the autopilot may no longer be able to generate sufficient differential thrust for attitude correction.
The reliability of the reported aerodynamic and energetic penalties is strongly shaped by facility boundary conditions, calibration protocols, and numerical modelling choices to the extent that results from different facilities are often not directly comparable. The minimum reporting framework proposed in Table 2 is therefore intended to standardise the documentation of environmental, facility, operational, morphological and uncertainty parameters. The mitigation evidence further indicates that the strict battery and weight constraints of small electric platforms shift the design philosophy from complete ice-free operation toward tolerable performance loss, with hybrid configurations combining superhydrophobic surfaces and localised heating reported to offer energy savings relative to standalone electro-thermal systems.
Within this evidence base, the most influential scale-transfer quantities for small RW-UAV propellers are the Reynolds number Re, particularly through its control of boundary-layer state, transition sensitivity and convective heat-transfer scaling; the droplet inertia parameter K
0
, through its control of local collection efficiency
 $\beta$
; the freezing fraction n0; the chord-normalised roughness k
s
/c; the accumulation parameter Ac; and the centrifugal-to-shear force balance governing post-impingement radial water transport. Their relative importance is regime- and operating-condition-dependent rather than universal. Weber-number effects can become first-order under SLD or wet-glaze conditions, where droplet deformation, splashing and water-film transport become significant. The advance ratio primarily determines the inflow and sectional operating state and may therefore become a first-order consideration in forward flight, while the tip Mach number mainly modifies the local thermodynamic balance through kinetic heating at sufficiently high tip speeds.
Tip-ward water redistribution with its tip-to-root ice-thickness amplification, the rapid onset of thrust and power penalties, icing-induced vibration and shedding events and the added severity of intermittent exposure have been reported directly in rotating small-propeller experiments [Reference Liu, Li, Ning, Tian and Hu69, Reference Han, Hu and Hu71, Reference Muhammed, Harvey, Khawaja, Virk and Momen91, Reference Tian, Tu, Liu, Kong, Han and Tian109]. The magnitude of the integrated thrust and power penalty, near-unity collection efficiency, centrifugal-to-shear force ratio, turbulence-closure sensitivity and roughness-modelling effects are supported mainly by numerical studies, impingement analysis or derived force-balance interpretation rather than direct measurement [Reference Ishaque, Wang, Jiang and Wu90, Reference Frey, Müller, Wallisch and Hann93]. Although recent full-vehicle experiments have begun to demonstrate the progression from propeller-level degradation to increased motor loading, instability and mission termination, the quantitative transfer to control-authority loss, mission-abort thresholds and scale-transfer error remains only partly established and requires broader dedicated validation.
Despite the progress documented in this review, several research directions emerge as particularly valuable for advancing the field toward engineering practice.
The development and validation of transition-sensitive turbulence models for icing simulations on low-Re rotating geometries represents a primary computational need. As discussed in Section 4.3, the choice between transition-sensitive and fully turbulent closures can shift the predicted ice regime from rime toward glaze on the same geometry, yet systematic sensitivity analyses remain rare in the RW-UAV literature. Coupling such models with spatially resolved roughness data (Sections 2.3 and 4.2) would provide the validation anchor.
The characterisation of safety-critical shedding transients also remains at an early stage. Section 3.2 documented that shedding events can dominate the termination criterion even when time-averaged penalties remain within recoverable ranges. Future campaigns employing high-speed synchronised multi-channel data acquisition would enable probabilistic mapping of shedding trajectories and mass-imbalance magnitudes, providing the basis for establishing structural tolerance limits in multi-rotor configurations.
Closely related is the gap in multi-rotor wake interaction under icing conditions. Section 3.3 showed that iced propellers generate wider wakes with elevated turbulence kinetic energy, yet the vast majority of experimental data derives from isolated-rotor setups. Quantifying how rotor-to-rotor wake coupling amplifies or redistributes icing penalties across the vehicle is essential for translating single-rotor data into vehicle-level safety assessments.
A standardised scaling methodology tailored to RW-UAV icing would further strengthen the field. The similarity framework (Section 2.1, Table 1) and facility considerations (Section 4.1) confirm that simultaneously matching all relevant non-dimensional parameters cannot be achieved in sub-scale testing. Parametric studies quantifying the isolated error contributed by each unmatched parameter, particularly kinetic heating and centrifugal effects on local freezing fraction, would provide a quantitative foundation that is currently lacking.
The decomposition of total icing penalty into its aerodynamic and electromechanical components, advocated in Section 3.1, also warrants broader adoption. Motor-ESC efficiency characteristics linking raw electrical measurements to non-dimensional coefficients are seldom documented, and dual-reporting protocols accompanied by motor efficiency maps would enable the community to isolate aerodynamic drag penalties from power-train losses.
Although SLD physics were introduced in the similarity framework (Sections 1.3 and 2.1) primarily in the context of Weber number scaling and collection efficiency, a dedicated experimental characterisation of ice accretion under Appendix O conditions on small-chord rotating blades remains scarce in the RW-UAV literature. Given that ballistic SLD trajectories impinge well beyond the leading edge, a region that is aerodynamically unprotected on most small propellers, and that collection efficiency is already elevated on small chords, this gap warrants targeted experimental campaigns.
Translating the conceptual operational decision framework outlined in Section 5 into validated flight-controller algorithms represents a key gap at the interface of experiment and operation. This effort requires flight-test data correlating onboard observables with independently measured icing severity and would support the development of icing-awareness systems for autonomous RW-UAV platforms.
Finally, hybrid ice protection systems combining superhydrophobic coatings with localised electro-thermal heating require further investigation of coating durability under repeated thermal cycling, the interaction between coating surface energy and roughness-driven boundary-layer penalties (Sections 2.3 and 4.3), and the net aerodynamic impact of the integrated system in dry-air conditions. Standardising the reporting of mitigation effectiveness using the quantitative metrics proposed in Section 5 would accelerate comparative evaluation across system architectures.
Collectively, these research directions converge on a common objective of establishing the experimental databases, validated numerical tools and standardised reporting protocols necessary to transition RW-UAV icing research from facility-specific phenomenological studies toward a scale-aware, mechanism-based engineering framework. The similarity diagnostics (Table 1), the minimum reporting checklist (Table 2), and the physical analysis presented in this review are intended to provide a structured foundation for this transition, supporting more interpretable evidence, more defensible predictions and ultimately safer operational decision-making for RW-UAVs in icing environments.

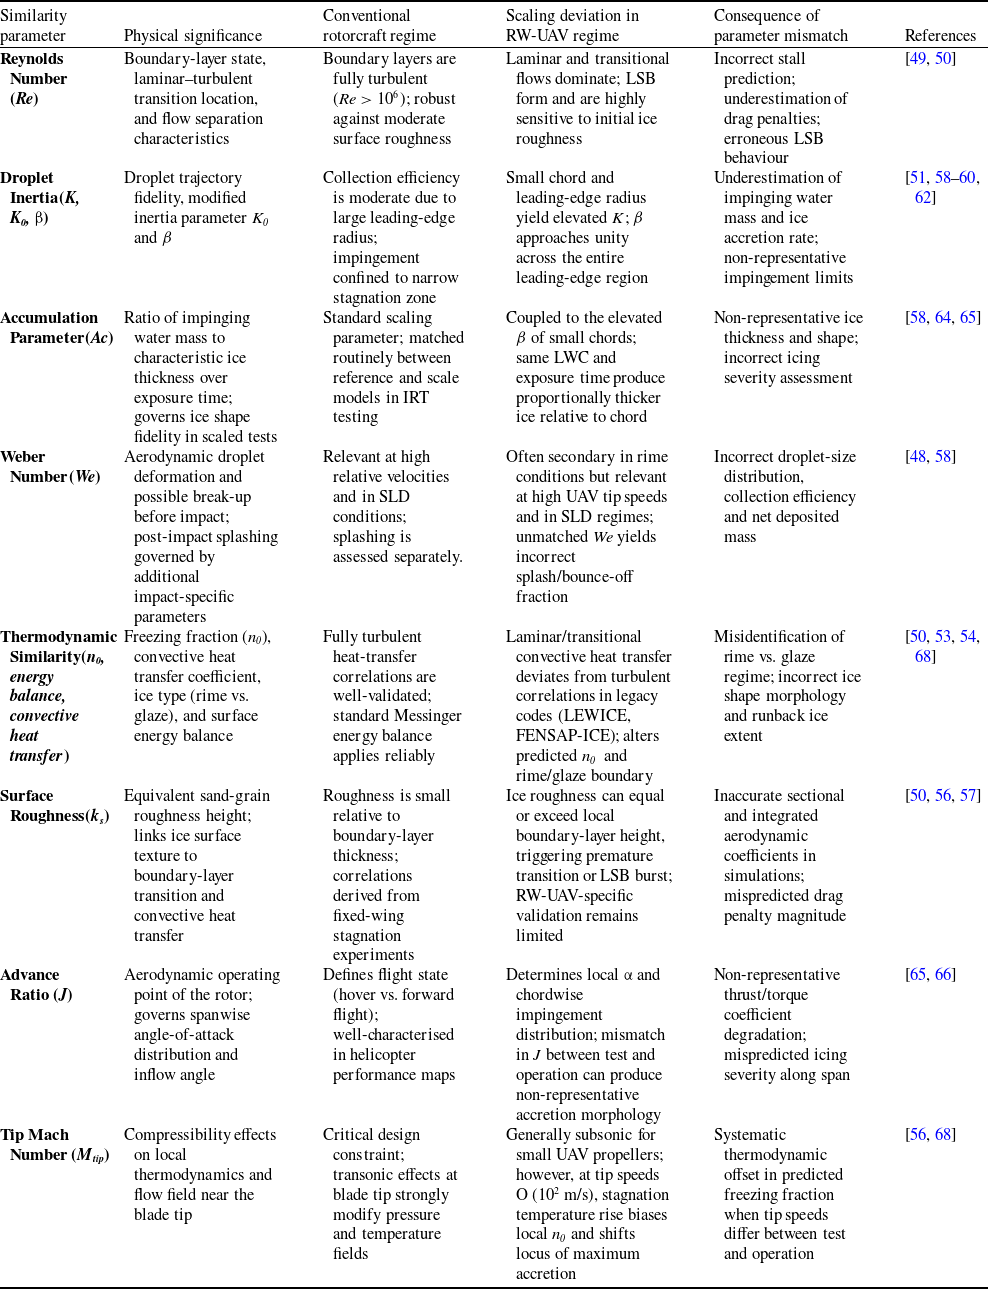

 τ