Numerous studies of the heritability of intelligence calculated by comparing identical (MZ) and same-sex fraternal (DZ) twins have been carried out in Western nations since the 1930s. The results of these studies were reviewed a quarter of a century ago by Bouchard (Reference Bouchard1993, p. 58), who concluded that heritability increases with age from approximately 0.4 at the age of 4 years to 0.52 at ages 6–16 years, 0.57 at ages 16–20 and 0.75 among adults. This conclusion has been confirmed more recently by Plomin and Deary (Reference Plomin and Deary2015), who stated that ‘heritability increases linearly, from (approximately) 20% in infancy to 40% in adolescence, and to 60% in adulthood. Some evidence suggests that heritability might increase to as much as 80% in later adulthood but then decline to about 60% after age 80’.
These conclusions for economically developed Western nations do not necessarily hold for economically developing nations because the magnitude of heritability can vary with the population on which it is calculated. The present study examines how far this is so, and is among the first studies of the heritability of intelligence in Africa (see Hur & Lynn, Reference Hur and Lynn2013; Hur, Reference Hur2016).
Twins attending private and public elementary and secondary schools and university students were recruited in the cities of Omdurman and Ombdeh in Khartoum State in Sudan in 2011–2015. This produced a sample of 316 MZ and 550 same-sex DZ twins consisting of 165 male and 268 female pairs. Their mean age of the study sample was 10 years (range: 6–20).
Raven’s Standard Progressive Matrices test (SPM, Raven et al., Reference Raven, Raven and Court2000) was administered individually. English letters (A, B, C, D, E) designating the five test sessions were translated into Arabic letters. The test booklet pages were changed from left to right in line with the Arabic way of writing and reading. The direction for writing answers was also changed from left to right. At the end of the testing session, the twins were assessed for zygosity from the similarity of their appearance and by questions like ‘How often are you mistaken for each other?’, taken from Ooki et al. (Reference Ooki, Yamada, Asaka and Hayakawa1990), who showed that this method of assessing zygosity is more than 90% accurate.
For more accurate estimates of genetic and environmental influences on intelligence, univariate model-fitting analyses were carried out. An assumption of the standard univariate twin model is that the variance in a trait can be decomposed into four components: (A) additive genetic factors consisting of the sum of the effects of all genes influencing a trait; (B) non-additive genetic factors, representing the effects of interactions within and between genes; (C) shared environmental factors, which include the environment shared by the twins that makes them similar to one another; (E) non-shared environmental factors (including measurement error), unique to each member of a twin pair and, therefore, making twins different from one other. Since MZ twins share all their DNA and DZ twins share, on average, half of their segregating DNA, if the MZ correlation is higher than the DZ twin correlation the presence of additive genetic influences is suggested. If the DZ twin correlation is greater than one-half the MZ twin correlation, this suggests the presence of shared environmental factors. Non-additive genetic factors are indicated to the extent that the DZ twin correlation is less than half the MZ twin correlation. A MZ twin correlation of less than 1.0 represents non-shared environmental influences and measurement error.
Model-fitting was performed using OpenMx (Boker et al., Reference Boker, Neale, Maes, Wilde, Spiegel and Brick2011), which calculates twice the negative log-likelihood (2LL) of the data. A chi-squared test then computed the difference in model fit between the full and the nested model. A significant value suggests that constraining the parameter in the nested model causes a significant decrease in fit of the model, whereas a non-significant change indicates that constraining the parameter is acceptable. For non-nested alternative models, Akaike Information Criteria (AIC¼ 2LL−2df) were used to assess superiority among them: lower AIC values generally represent better and more parsimonious fits to the data than models with higher AIC values (Akaike, Reference Akaike1987). For a baseline comparison, a saturated model (with freely estimated means and variances) was generated and its 2LL value was compared with that of the full model.
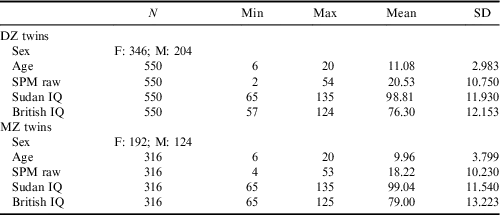
The MZ twins obtained a mean SPM score of 18.22 (SD 10.23) and the DZ twins obtained a mean SPM score of 20.53 (SD 10.75) (see Table 1). These scores are typical of Sudanese samples, as given by Lynn and Vanhanen (Reference Lynn and Vanhanen2012) and show that the sample was representative of Sudan for intelligence. The scores on the SPM were converted to British IQs using the SPM manual (Raven et al., Reference Raven, Raven and Court2000).
Descriptive statistics for DZ and MZ twins, Khartoum State, Sudan, 2011–2015

The intraclass correlations for the 158 MZ and 275 DZ twins were 0.754 and 0.690, respectively. An approximate estimate of the heritability can be calculated from these correlations by Falconer’s (Reference Falconer1981) method. This consists of doubling the difference between the correlations of the MZ and DZ twins because the difference estimates approximately half of the genetic variance. In the present sample the difference was 0.065, and therefore the heritability was 0.13.
The ACE model was chosen as the full model, given the small sample size and because the classical twin design is not powered to detect non-additive genetic factors (D) (Martin et al., Reference Martin, Eaves, Kearsey and Davies1978). The results of model fitting are shown in Table 2. Dropping C from the full model (i.e. the AE model) resulted in significant changes in 2LL, indicating that shared environmental influences significantly contribute to variance in IQ scores. When A was eliminated from the full model (i.e. the CE model), this produced significant changes in 2LL, indicating that additive genetic factors significantly contribute to variance in IQ scores.
Goodness-of-fit statistics and parameter estimates from univariate model-fitting analysis for SPM raw scores.

A: additive genetic influences. C: shared environmental influences. E: non-shared environmental influences plus measurement error. Best-fitting model in bold. AE and CE models provided a significantly worse fit to the data.
The dataset was split in two groups by age (age >10, n=201; ≤10, n=232). The MZ and DZ intraclass correlations were very similar for the two age groups and did not suggest higher heritability for the older twins (using Falconer’s formula, h 2=0.018 for >10 and 0.12 for ≤10 year old twins). The smaller sample size of the two sub-groups and the tiny difference in MZ–DZ intraclass correlations between the two groups did not justify using structural equation modelling to test competing models for the two age groups.
The two methods for estimating the heritability of intelligence in the present sample produced reasonably consistent results giving heritabilities of 0.13 using Falconer’s (Reference Falconer1981) method and 0.172 using the ACE model. These estimates are much lower than those given by Bouchard (Reference Bouchard1993, p. 58) and Plomin and Deary (Reference Plomin and Deary2015) for 10-year-olds in Western samples, for which they give a heritability of around 30–50%. Conversely, the importance of shared environmental influences (0.596) was greater in the present sample than typically found in Western samples. Plomin et al. (Reference Plomin, DeFries, McClearn and McGuffin2008, pp. 166–167) estimated a 25% shared and 35% non-shared environmental contribution in childhood. Age did not seem to affect the estimates as similar heritabilities were found for sub-groups of twins aged 6–10 and 10–20 years (0.12 and 0.018, respectively).
A likely explanation for the lower heritability and higher shared environmental influence found in the Sudanese sample compared with Western samples is the effect of impoverished conditions on reducing the heritability of developmental traits. Sudan is a poor country with a per capita income of US$2030, compared with US$49,310 in the United States, US$35,840 in the United Kingdom and approximately the same in other Western European countries measured as gross national product at purchasing power parity in 2010, as given in Vanhanen (Reference Vanhanen2014, pp. 66–71).
Several studies in Western countries have shown that there is lower heritability and higher shared environmental influence in low socioeconomic status and poor samples. In the United States, Turkheimer et al. (Reference Turkheimer, D’Onofrio and Gottesman2003) showed that the shared environment accounted for 60% of the variance in intelligence in impoverished families, with very little heritability, whereas the reverse was true for affluent families. This was confirmed in a more recent study in the United States carried out on younger children (aged 10–24 months), which found an increase in the heritability of intelligence from 5% in low socioeconomic status families to 50% in high socioeconomic status families (Tucker-Drob et al., Reference Tucker-Drob, Rhemtulla, Harden, Turkheimer and Fask2010). Similar results have been reported in a British sample in which heritability was lower and shared environment explained more of the variance in children’s intelligence in those in more disadvantaged backgrounds (for twins aged 9, C=48% vs 25% for low and high socioeconomic status, respectively) (Hanscombe et al., Reference Hanscombe, Trzaskowski, Haworth, Davis and Dale2012). These studies, together with the present study, suggest that the heritability of intelligence is higher and the effect of shared environmental influence is lower in countries with higher incomes and that the heritability of intelligence is likely to increase as countries become more affluent.
Acknowledgment
The authors extend their appreciation to the Deanship of Scientific Research at King Saud University for funding this work through Research Group No. RG-1438-007.
Ethical Approval. The authors assert that all procedures contributing to this work comply with the ethical standards of the relevant national and institutional committees on human experimentation and with the Helsinki Declaration of 1975, as revised in 2008.
Conflicts of Interest. The authors have no conflicts of interest to declare.
Funding. This research received no specific grant from any funding agency, commercial entity or not-for-profit organization.