Dairy cows commonly undergo negative energy balance (NEB) during the perinatal period, resulting from the energy from feed intake not meeting the demands of parturition and/or milk production during early lactation (Wang et al., Reference Wang, Zhu, She, Kong, Guo, Wang, Liu and Zhao2018). Consequently, NEB is more evident in cows with higher milk yield. The immediate consequence of NEB is the body lipid mobilization. Non-esterified fatty acids (NEFAs), mixtures of many kinds of free fatty acids, are released by lipolysis enter plasma.
Ketosis is a metabolic disorder characterized by increasing levels of blood NEFAs and ketone bodies. The prevalence of ketosis is high globally, and it causes great economic losses. The harm associated with ketosis includes reduction of milk production, increase of therapeutic costs, and increase of susceptibility to other diseases like metritis, mastitis and lameness. Prediction of ketosis will be helpful to limit the economic losses and improve animal wellbeing (Nielsen et al., Reference Nielsen, Friggens, Chagunda and Ingvartsen2005). Currently, the exact molecular mechanism of ketosis is still underdetermined, but it is generally accepted that the metabolism of NEFAs in the liver is closely associated with the onset of ketosis. When the intake of NEFAs exceeds the processing ability of the liver, the BHBA content will increase, and cows are then vulnerable to ketosis.
Thus far, the reports on dynamic fatty acid profiles of serum NEFAs during the transition period have been very limited. As ketotic cows have systemic lipid metabolism abnormities, we speculate that there is a difference in fatty acid profile of blood NEFA between them and healthy cows, and it may be possible to identify fatty acid related indicators for ketosis. In the present study, we aimed to compare the dynamic fatty acid composition in blood NEFA between ketotic and healthy cows by means of Gas Chromatography-Mass Spectrometer (GC-MS), and to screen possible fatty acid related indicators for predicting ketosis.
Material and methods
Cows and grouping
All experimental procedures were approved by the Committee on the Ethics of Animal Experiments of the Heilongjiang Bayi Agricultural University. We obtained written informed consent to use the animals in our study from the owner of the animals.
Twenty-six Holstein cows, body condition scores (BCS) between 3 and 3.5, in 2–4 parity and within 30 d before partum, but otherwise randomly allocated, were recruited without any clinical symptoms and without positive results of ketone powder assay from a dairy farm in Heilongjiang Province, China (Zhang et al., Reference Zhang, Guo, Yang, Li, Zou, Loor, Xia and Xu2019). They were fed a total mixed ration (TMR) at 07 : 00 am and 13 : 30 pm daily during the perinatal period. The diet composition is given in online Supplementary File Table S1. These cows were further screened by monitoring serum concentrations of Glc, NEFA and BHBA in our lab using commercial kits (online Supplementary File Fig. S1). Cows were divided into a healthy control group (C group) and a ketosis group (K group) according to the blood BHBA levels. The allocation of cows to groups was blind in this case-control study. Cows were classified into K group if blood BHBA levels exceeded 1.2 mm during the experiment, and 6 cows were ketotic cows; cows in C group were those not diagnosed with ketosis by certified veterinarians according to blood BHBA levels and clinical symptoms during the whole experiment process, and 6 cows were randomly chosen from the herd to match the number of cows in K group. After the study, cows were maintained in the dairy farm and got access to veterinary services.
Blood sample collection
Blood samples were collected from the vena caudalis mediana on −7, 3, 7, 14 and 21 d postpartum, respectively, and immediately centrifuged at 4000 × g for 10 min at room temperature. Serum was aliquoted into 1.5 ml tubes and stored at −20°C until further analysis.
Extraction of lipids
Lipids were extracted from serum following the method of Xu et al. (Reference Xu, Harvey, Pavlina, Dutot, Zaloga and Siddiqui2010). Briefly, 200 μl serum sample was taken, and mixed with 400 μl methanol. Then 1.2 ml hexane was added, and vortexed for 1 min. After standing for 5 min, the mixture was centrifuged at 8000 rpm for 2 min. The top layer was transferred to a clean tube, and subject to further purification.
Purification of non-esterified fatty acids
The extracted lipids were purified by a CNWBOND Florisil solid phase extraction (SPE) column (ANPEL Scientific Instrument, Shanghai, China). The column was initially activated by adding 15 ml anhydrous ether and 3 ml hexane. A 1 ml of lipid extract was added to the SPE column, and then 18 ml anhydrous ether: hexane (80 : 20, v: v) was added to release the lipids other than free fatty acids. NEFAs were eluted by adding 15 ml anhydrous ether: glacial acetic acid solution (95 : 5, v: v). Filtrates were dried under N2 and ready for esterification.
Fatty acids methyl esterification preparation
The purified NEFAs were incubated with 2 ml 5% (v %) sulfuric acid in methanol and 25 μl 0.2% (w %) butylated hydroxytoluene (BHT) in methanol at 90°C for 1.5 h. After cooling, 1 ml of hexane and 2 ml saturated sodium chloride solution were added and vortexed for 1 min. After balancing at room temperature for 15 min, the top layer was collected as fatty acid methyl esters (FAME).
GC-MS analysis
FAME were analyzed using an Agilent 7890A GC system (Agilent Technologies, Santa Clara, CA) with a capillary column (10 m × 0.1 mm × 0.1 μm, Agilent DB-225) and a mass spectrometry detector. GC conditions were as follows, inlet temperature at 250°C, detector interface temperature at 230°C, injection volume at 1 μl, the split ratio at 60 : 1 and flow rate at 0.2 ml/min. After injection, the oven temperature was set at 55°C for 1 min, increased to 205°C at a rate of 30°C/min within 5 min, then held at 205°C for 1 min, increased to 230°C at a rate of 5°C/min within 5 min and held at 230°C for 3 min. For the mass spectrometry detector, temperature of ion source was 230°C; temperature of quadrupole was 150°C; solvent delay time was set at 1 min; detection range was 30–400 Da; SIM selections were 55, 67, 74, 79 and 87; the dwell time was set at 25 msec.
Edible oil samples were also methyl esterified as quality controls. Individual FAME peak was identified by comparison to FAME standards (Sigma, St. Louis, MO, US) run parallelly. The fatty acid concentrations were calculated based on the peak area. An individual fatty acid% was defined as (weight of the fatty acid/weight of total fatty acids) × 100%.
Statistical analysis
Fatty acid compositions and fatty acid ratios were presented as means ± sem. Six biological replicates were used. Student's t-test with subsequent Bonferroni adjustment was performed using SPSS17.0 software (SSPS, Chicago, IL, USA). P < 0.05 indicated a significant difference between healthy cows and ketotic cows at the same blood collection time point.
Results
NEFA composition in serum
In total, 16 types of fatty acids were detected in serum NEFAs. Most of them (C8 : 0, C10 : 0, C12 : 0, C14 : 0, C15 : 0, C16 : 0, C17 : 0, C18 : 0, C20 : 0, C22 : 0) were saturated fatty acids (SFA), with the length of carbon chain ranging from 8 to 22. Mono-unsaturated fatty acids (MUFA) in serum NEFA pool included C18 : 1n9 and C22 : 1n9, while poly-unsaturated fatty acids (PUFA) included C18 : 3n6 and C18 : 3n3.
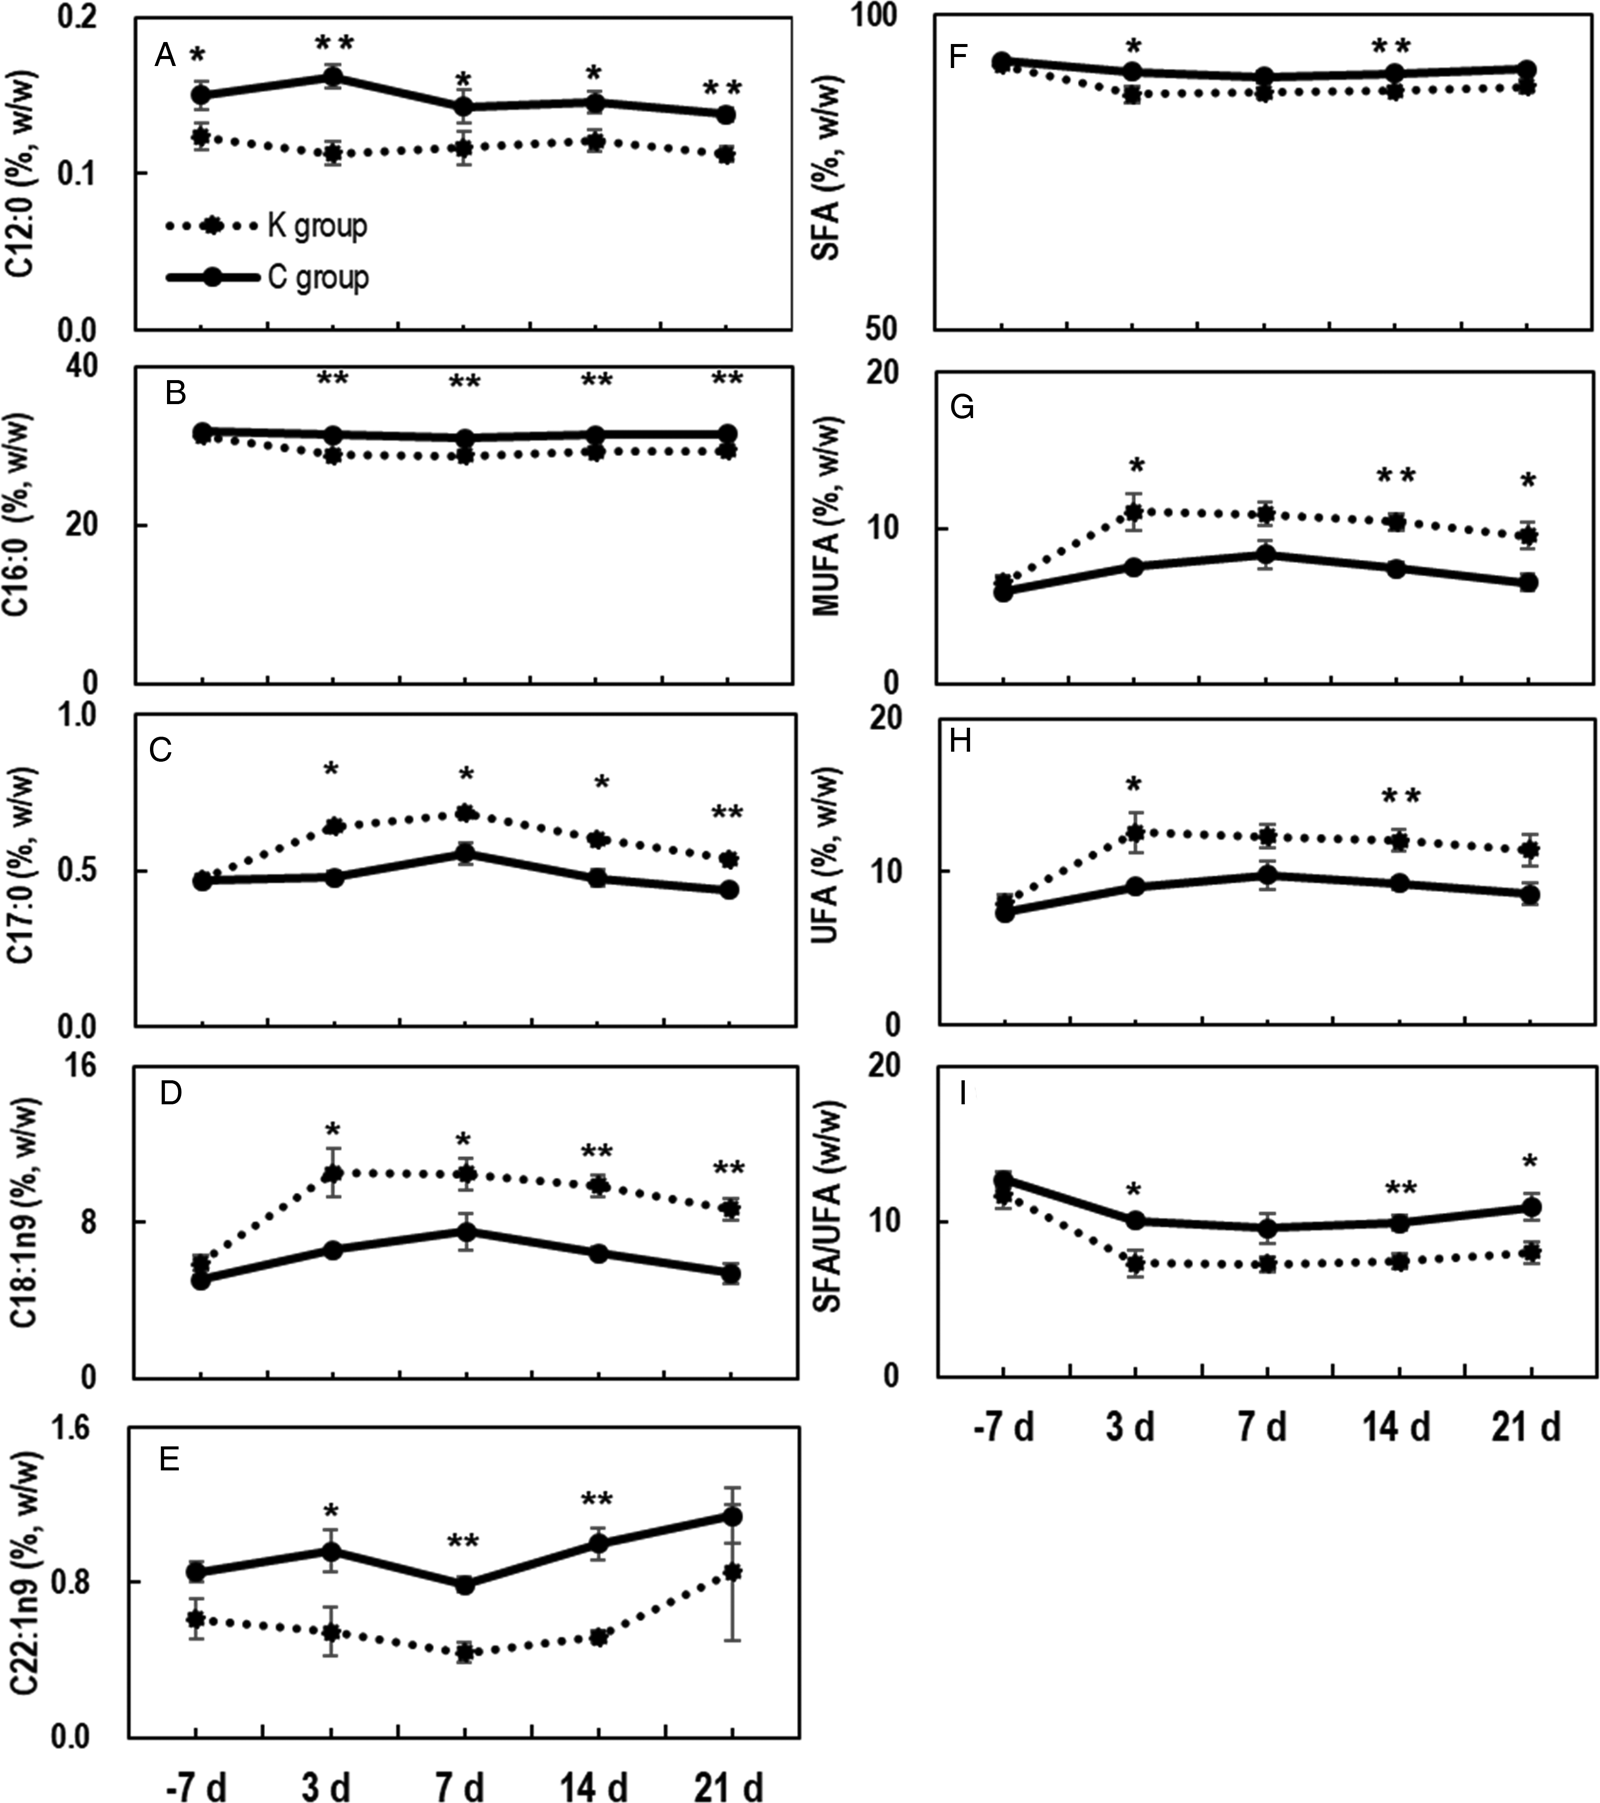
Five fatty acids showed differences in composition between C and K group (Fig. 1). C12 : 0% (weight of C12 : 0/ weight of total fatty acids × 100%, hereinafter inclusive) in K group was consistently lower than that in C group (P < 0.01 or P < 0.05) (Fig. 1a). No other fatty acid composition showed a significant difference between C group and K group on 7 d pre-partum, but there was numerical difference in that ketotic cows had a higher C18 : 1n9% and lower C22 : 1n9%. C16 : 0% in K group was also lower than that in C group except on 7 d pre-partum (P < 0.01) (Fig. 1b), but its C17 : 0% and C18 : 1n9% were higher than those in C group except on 7 d pre-partum (P < 0.01 or P < 0.05) (Fig. 1c, d). C22 : 1n9% in K group was lower compared with that in C group except on −7 d and 21 d postpartum (P < 0.01 or P < 0.05) (Fig. 1e).
Serum NEFA compositions and ratios showing differences between C and K group. Fatty acid concentrations were measured based on peak area after GC-MS analysis. Fatty acid% was calculated according to the formula: (weight of the fatty acid/weight of total fatty acids) × 100%. SFA%, MUFA%, UFA% and SFA/UFA in serum NEFA pool of cows. SFA% = (weight of total SFA/weight of total fatty acids) × 100%. MUFA% = (weight of total MUFA/weight of total fatty acids) × 100%. UFA% = ((weight of total MUFA + weight of total PUFA)/weight of total fatty acids) × 100%. SFA/UFA = SFA%/MUFA%. ** indicates a significant difference compared to controls at the same time point (P < 0.01); * indicates a significant difference compared to controls at the same time point (P < 0.05). n = 6.

Total SFA% in K group was lower than that in C group, especially on 3 and 14 d postpartum (P < 0.01 or P < 0.05) (Fig. 1f), while total MUFA% in K group was higher (P < 0.01 or P < 0.05) except on 7 d post-partum (Fig. 1g). Total unsaturated fatty acids% (UFA% = MUFA% + PUFA%) showed similar results as MUFA% (Fig. 1h). As a result, SFA/UFA ratio was lower in K group than in C group (Fig. 1i).
C18 : 1n9/C12 : 0 and C18 : 1n9/C22 : 1n9 ratios in serum NEFA
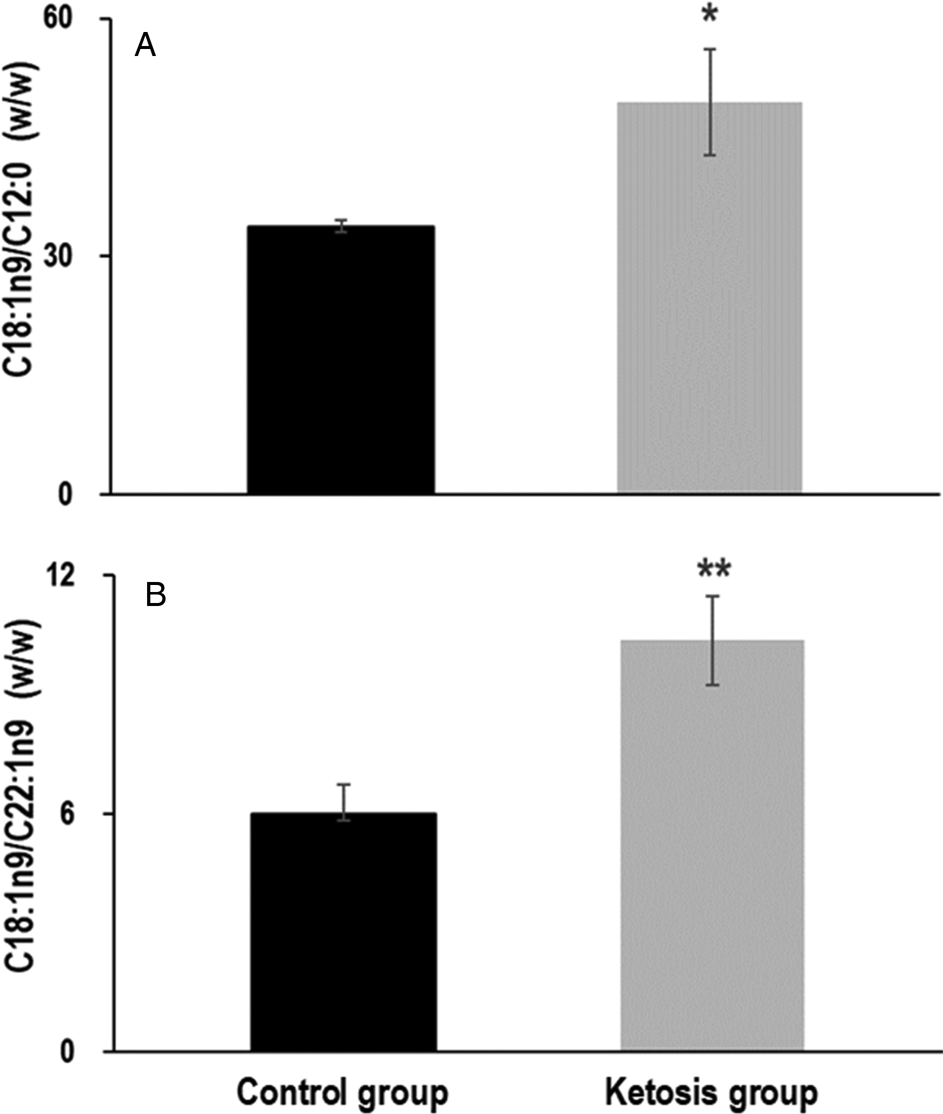
We then investigated whether there was any indicator that could predict the onset of ketosis. All cows were shown to be clinically healthy (free from ketosis) on 7 d pre-partum, but based on the post hoc comparison of C12 : 0%, C22 : 1n9% and C18 : 1n9%, we found that C18 : 1n9/C12 : 0 and C18 : 1n9/C22 : 1n9 in K group were significantly higher than in controls (P < 0.05 and P < 0.01, respectively) (Fig. 2), indicating these ratios might be of importance to predict ketosis.
C18 : 1n9/C12 : 0 and C18 : 1n9/C22 : 1n9 in serum NEFA pool on 7 d pre-partum. Concentrations of C18 : 1n9, C12 : 0 and C22 : 1n9 were measured by means of GC-MS, and then the ratios were calculated. ** indicates a significant difference compared to controls (P < 0.01); * indicates a significant difference compared to controls (P < 0.05). n = 6.

Discussion
NEFAs in blood can be used as an index for fat mobilization from adipose tissue which is further related to energy balance of dairy cows. During ketosis, more NEFAs are released into blood, and fatty acid profiles of blood NEFA will change accordingly (Yamdagni and Schultz, Reference Yamdagni and Schultz1970). In general, C16 : 0 will be released as a priority compared to C18 : 0 and enter blood NEFA pool (Vernon, Reference Vernon1980), but a significantly lower level of C16 : 0% was observed in ketotic cows in the present study. It has been reported that fatty acid composition in adipose tissue does not differ from 7 d pre-partum to 21 d post-partum between cows with restricted energy intake and overfed dairy cows, indicating that the release of C16 : 0 might be unchanged in ketotic cows (Rukkwamsuk et al., Reference Rukkwamsuk, Geelen, Kruip and Wensing2000). It is possible that the uptake of blood C16 : 0 by the liver or mammary gland is enhanced because there is a more unsatisfied energy demand in ketotic cows. Further investigations are needed to verify this.
The increase of C18 : 1n9% in serum NEFA of ketotic cows was consistent with others, who also reported a higher ratio of oleic: stearic acids in the NEFA fraction of plasma (Yamdagni and Schultz, Reference Yamdagni and Schultz1970). During ketosis, fat mobilization can take place primarily in oleic acid rich adipose tissue (such as subcutaneous adipose tissue) as there is a greater loss of subcutaneous than abdominal adipose tissues in unfed cattle (Butterfield, Reference Butterfield1966). The increase of C18 : 1n9% is most likely due to the more intense lipolysis in those adipose tissues of ketotic cows.
It seems that C18 : 1n9 takes the place of SFA, thus ketotic cows have lower SFA/UFA ratios. C16 : 0 and C18 : 0 are the most abundant SFA in serum NEFAs. SFA% was consequently decreased in ketotic cows as the C16 : 0% decreased in ketotic cows while C18 : 0% did not differ in ketotic cows and healthy cows. As a result of the elevated C18 : 1n9%, MUFA% increased, and UFA% increased as well in ketotic cows. We also observed an increased amount of C17 : 0% but reduced C12 : 0% and C22 : 1n9% in blood NEFAs of ketotic cows, but the underlying mechanisms are not known yet.
Ketosis has caused great loss in dairy industry, and timely interventions requiring early prediction would be highly beneficial. Since the increasing concentration of NEFAs in blood happens ahead of the onset of ketosis, alerting the disease using fatty acid related indicators seems feasible. Most studies for prediction of clinical diseases used the concentration of NEFA, but here we showed that C18 : 1n9/C12 : 0 and C18 : 1n9/C22 : 1n9 ratios were of potential to be utilized for prediction of ketosis. However, we have not yet established a full diagnostic method for ketosis. The number of cows involved in the study was quite small, and a larger scale investigation with more animals is necessary to confirm the validity of the ratios. Furthermore, these ratios should, at present, only be used within the constraints of the settings used in this study, as NEFA composition may be subject to change upon dietary interventions, lactation stage and nutrition status (Contreras et al., Reference Contreras, O'boyle, Herdt and Sordillo2010).
In conclusion, there is a different blood NEFA profile between healthy cows and ketotic cows, which are most likely reflections of variations in body fat mobilization. Also, predicting ketosis using blood fatty acid measured 7 d pre-partum seems feasible.
Supplementary material
The supplementary material for this article can be found at https://doi.org/10.1017/S002202991900092X
Acknowledgements
Authors are grateful for the financial support from National Program on Key Research Project of China (Project No. 2016YFD0501206), National Key R&D Program of China (Project No. 2017YFD0502200), Major projects of applied technology research and development plan in Heilongjiang of China (Project No. GA16B202), and Natural Science Foundation of Heilongjiang Province of China (C2015043). The funding sources had no role in the design of this study and will not have any role during its execution, analyses, interpretation of the data.