Introduction
Numerous studies have considered the economic consequences of animal size for dairy cows (reviewed by Brotherstone et al., Reference Brotherstone, Coffey and Banos2007). Most studies have concluded that increased cow size has a negative effect on profitability, and several countries have included negative weights for various measures of cow size in selection indices (Miglior et al., Reference Miglior, Muir and Van Doormaal2005). However, the economic value for growth rate may also be positive for countries in which meat production of surplus calves from the dairy herd is economically important. Genetic and environmental correlations between growth rate and other economic traits have also been computed in various studies, and these generally tend to be economically negative or negligible (Brotherstone et al., Reference Brotherstone, Coffey and Banos2007).
Although a relatively large number of studies have analyzed genetic parameters of growth rate for beef cattle strains, and several of these studies are based on large data sets (e.g. de Mattos et al., Reference de Mattos, Misztal and Bertrand2000; Crews et al., Reference Crews, Lowerison, Caron and Kemp2004; Giannotti et al., Reference Giannotti, Packer and Mercadante2005), only a few studies have analyzed the growth rate of dairy breeds, and these studies have been based on small samples from experimental herds (Brotherstone et al., Reference Brotherstone, Coffey and Banos2007). Thus, estimates of genetic parameters for dairy breeds tend to have large standard errors (s.e.), and it is not possible from these studies to estimate long-term genetic trends in the general commercial population. Brotherstone et al. (Reference Brotherstone, Coffey and Banos2007) write in relationship to the UK Holstein population: ‘It is unlikely that routine weighing (or type classification) of young stock would be implemented in the national population due to both the cost and the practical problems associated with such a process.’
Since the beginning of the 1990s, a large number of Israeli Holstein herds have routinely weighed both male and female calves several times prior to slaughter or calving. Most of the studies that have analyzed growth rate have considered a single sex. This is the first study in which a large number of animals from both sexes are analyzed jointly. The objectives were to estimate variance components of growth rate for male and female calves, to determine the feasibility of joint analysis of both sexes, to estimate genetic and phenotypic trends for growth rate, and to estimate genetic correlations of growth rate with other economic traits.
Material and methods
Data were 734 459 weight records of Israeli Holsteins collected at commercial farms until 6 August 2007. Records prior to 1994 and of calves resulting from multiple births were deleted. In addition, records of calves with unknown sire or dam, and weights prior to age 150 days or after 500 days were deleted. Weight gain to the age of 1 year, yearling weight gain, YG, was computed as follows:

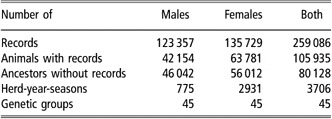
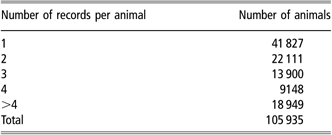
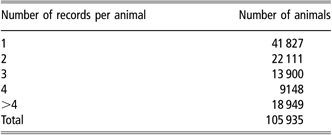
where W = weight in kg at age a in days. This formula assumes a birth weight of 35 kg. Records with YG values < 150 and >650 were deleted. For animals with more than five valid weight records, the first four and the last record up to 500 days were retained. After these edits, the data set consisted of 285 800 records from 105 935 animals recorded in 458 herds. This is denoted data set 1, and details are given in Table 1. Of these calves, 42 154 were males and 63 781 were females. Parents and grandparents of the animals with records are also included in the genetic analyses of this data set, and the numbers of ancestors are also given in Table 1. Numbers of animals by number of weight records per animal are given in Table 2. Over 60% of the calves had more than one record.
Number of records and levels of effects in data set 1, the complete data set used to compute genetic evaluations and genetic trends

Number of animals × number of weight records per animal
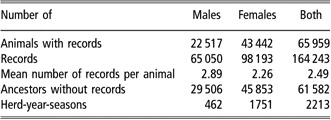
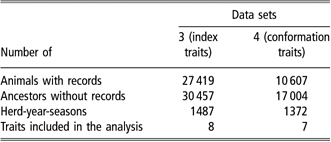
A subset of this data, consisting of records recorded since January 1, 2000, was used to compute age-correction factors and variance components for age-corrected weight and YG. This was denoted data set 2, and details are given in Table 3. Two additional data sets were generated to estimate covariance components between YG and other traits. Data set 3 consisted of all female calves with at least one valid record for YG from 1994 to 2005, and valid record for first parity milk, fat and protein production; somatic cell score (SCS), female fertility and milk persistency, pre-adjusted for calving age and month (Ezra et al., Reference Ezra, Weller and Drori1987). Records for herd life were also included in this analysis, but there is only a single record per animal for this trait. For animals still alive at the time of the analysis, actual herd life was replaced with predicted herd life as described previously (Settar and Weller, Reference Settar and Weller1999). All animals with valid records for first parity milk production also had valid records for herd life. Female fertility was computed as the inverse of the number of inseminations to conception (Weller and Ezra, Reference Weller and Ezra1997). Milk persistency was defined as the predicted milk production 180 days after peak divided by peak production in percent (Weller et al., Reference Weller, Ezra and Leitner2006). The restricted maximum likelihood (REML) program required equal number of records per animal for all traits. Therefore, only the weight record closest to the age of 1 year was included in the analysis. Details of this data set are given in Table 4.
Number of records and effects included in data set 2 used to estimate age correction factors and variance components for age-corrected weight and gain to 365 days for both sexes

Number of records and effects included in data sets 3 and 4 used to estimate correlations between yearling growth rate and index and conformation traits
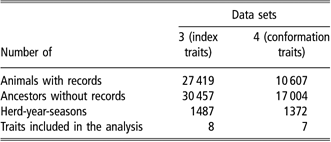
Data set 4 consisted of female calves with at least one valid record for YG from 1994 to 2005, and valid records for all conformation traits scored in Israel. Details of this data set are also given in Table 4. Since only samples of animals are scored for conformation traits, data set 4 included fewer animals than data set 3. The genetic analyses of data sets 2, 3 and 4 also included parents and grandparents of animals with records, and the numbers of these animals are also given in Tables 2 and 3.
Age-adjustment factors for both weight and YG were computed from data set 2. Adjustment factors were computed separately for male and female calves. The analysis model was

where a 0.5, a and a 2 are the square root, linear and quadratic effects of age, and the other terms are as defined previously. All factors were considered fixed in this model. The coefficients derived from this model were then used to adjust weight and YG in the REML analyses.
All variance and covariance components were computed by the MTC REML multitrait animal model program (I. Misztal, personal communication). The analysis model for data set 2 was

where Tijklmn = the nth age-adjusted record of calf j from herd l for trait i; Gij = the genetic group effect for animals with unknown parents, Aik = is the additive genetic effect of cow k for trait i, Pik = the permanent environmental effect of cow k for trait i; Hil = the effect of herd-year-season (HYS) l on trait i, and eijklm = the random residual effect. G and HYS effects were fixed and the other effects were random. The genetic grouping strategy of Westell et al. (Reference Westell, Quaas and Van Vleck1988) was applied. Two genetic groups were defined depending on which parents were unknown: group 1 for animals with only the dam unknown, and group 2 for animals with sire or both parents unknown. Two seasons were defined for each herd-year relative to date of birth: from April to September and October to March. Separate HYS were defined for male and female calves. Therefore, a sex of calf effect was not included in the analysis model. Heritability was defined as the A variance component divided by the sum of the A, P and e variance components. Repeatability was defined as the sum of the A and P variance components divided by the sum of the A, P and e variance components. Data set 2 was analyzed including calves of both sexes, and males and females separately. Prior to analysis of both sexes, the records of females were multiplied by the square root of the ratio of the male and female additive genetic variance components to bring the records of both sexes to equal genetic variances. The analysis models for data sets 3 and 4 were the same, except that PE and sex effects were not included, because there was only a single record for each animal, and only females were analyzed.
Genetic evaluations for YG were computed for all animals included in data set 1 by the repeatability animal model. The analysis model was

with all terms as defined previously. Genetic groups for animals with missing parents were defined by sex of animal, birth year and which parents were unknown. Although the Israeli dairy cattle population is 99% Holstein, a small fraction of cows were also mated to other bulls, and additional groups were determined by breed of sire for breeds other than Holstein.
As in the previous models, G, HYS and age effects were fixed, and the other effects random, and separate HYS were defined for male and female calves. Although this precluded the need to include a sex of calf effect, it does not correct for the fact that variance components were also different by sex. To correct for this, we applied the following procedure:
1. For male calves, A and P variance components as derived from the REML analysis were calculated relative to the residual variance component.
2. Records of female calves were multiplied by the square root of the ratio of the genetic variances of male and female calves. Thus, the additive genetic variance component is now equal for both sexes, and the P and residual variances for females are changed by this ratio.
3. The mixed-model equations are then constructed with different P variances for each sex. For males the diagonal elements are augmented by the ratio of the P and residual effects. For females, the diagonal elements are augmented by (Pf × Am)/(Af × Rm), where Pf = the P variance for males, Am = A variance for males, Af = A variance for females, and Rm = residual variance for females.
4. Although the residual variance for males is absorbed from mixed-model equations, the residual variance for females is not. The corrected residual variance for records of females is then computed as (Rf × Am)/(Af × Rm), where Rf = the residual variance for females and the other terms are as defined previously. All records of females are then multiplied by the inverse of this ratio in the mixed-model equations.
In addition, genetic evaluations were computed for each sex separately using the appropriate variance components derived from the single-sex REML analyses. The genetic base for all evaluations was the mean of calves born in 2000. Genetic trends were computed for the complete population as the regression of estimated breeding values (EBV) of all animals on their birth dates. Phenotypic trends for the first and last weight records were computed as the regression of YG on the birth dates of animals with records. In the regression of last weight, only animals with at least five weight records were included. Reliabilities of the EBV were estimated using the algorithm of Misztal and Wiggans (Reference Misztal and Wiggans1988), as corrected by Misztal et al. (Reference Misztal, Lawlor, Short and Wiggans1991).
Correlations were computed among the single-sex and both-sex evaluations for all bulls with reliabilities >0.5. In addition, correlations were also computed between the both-sex evaluations and the mean of the male and female calf evaluations for each bull. Correlations were also computed between sire evaluations with reliabilities >0.5 for YG, and all traits included in the Israeli breeding index, PD07, maternal and direct effects on calving traits, and 17 conformation traits: total score, total udder, legs, dairy character, size, claw, rump angle, rump width, body depth, height, rear legs, teat length, teat placement, udder depth, udder height, udder attachment and ligament. The REML analysis of data set 4 included those conformation traits with absolute values of correlations for EBV with YG >0.2 and rump angle, because of the affect associated with this trait on dystocia (Cue et al., Reference Cue, Monardes and Hayes1990).
Genetic evaluations for milk, fat, protein, SCS, fertility and persistency were derived by the multitrait animal model as described (Weller and Ezra, Reference Weller and Ezra2004; Weller et al., Reference Weller, Ezra and Leitner2006). Genetic evaluations for fat and protein percent were derived from the genetic evaluations of milk, fat and protein as described by Weller and Ezra (Reference Weller and Ezra2004). Genetic evaluations for herd life and conformation traits were computed by single-trait animal models (Settar and Weller, Reference Settar and Weller1999). Genetic evaluations for first parity dystocia and calf mortality were computed by single-trait sire and maternal grandsire models, as described by Weller and Gianola (Reference Weller and Gianola1989).
Results and discussion
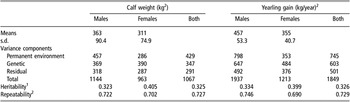
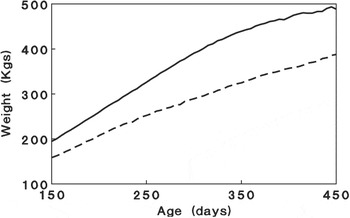
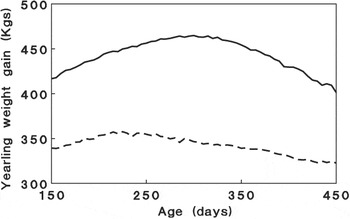
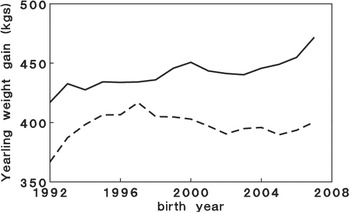
Means and standard deviations (s.d.) for weight and YG are given in Table 5 by sex. As expected, both means and s.d. are greater for males for both traits. Mean weight and mean YG as functions of age for males and females are given in Figures 1 and 2. Means were computed for each 5-day interval. The difference between the sexes increased until around 400 days, at which point the difference was about 110 kg. YG was greatest for males at approximately 300 days and for females at 225 days. Mean YG by birth year and sex based on the first record per animal for data set 1 are given in Figure 3. There is a clear positive phenotypic trend for males, but not for females. Average difference between males and females was approximately 50 kg, which is less than the difference of 100 kg in Table 5 derived from data set 2 based on all records.
REML estimates of variance components, heritability and repeatability for corrected calf weight and yearling weight gain computed from data set 2

REML = restricted maximum likelihood.
1Genetic variance component divided by total variance.
2Genetic + permanent environment variance components divided by total variance.
Mean weight × age and sex from data set 2. —, males; - -, females.

Mean yearling weight gain × age and sex from data set 2. —, males; - -, females.

Mean yearling weight gain × birth year and sex derived from the first record of each animal in data set 1. —, males; - -, females.

Square root, linear and quadratic effects of age on weight and YG computed separately for each sex were all significant (P < 0.01). These values were used to correct the trait values prior to the REML analyses. The REML estimates of variance components, heritability and repeatability for age-corrected calf weight and YG computed for each sex separately and for both sexes jointly are also given in Table 5. As most previous studies show, heritability for weight is within the range of 0.25–0.4 (Giannotti et al., Reference Giannotti, Packer and Mercadante2005). Although variance components and repeatabilities were higher for males, heritabilities were higher for females for both traits. Although s.e. of the heritabilities were not computed, s.e. for growth rate from previous studies were in the range of 0.03 to 0.05 for smaller samples (MacNeil, Reference MacNeil2003; Brotherstone et al., Reference Brotherstone, Coffey and Banos2007).
The variance components for the combined sex analysis were very similar to the values for females. This reflects the fact that there were more female records than male records, and that the genetic correlation between the sexes is very high. This question will be considered again below. After correction for age, genetic correlations between the two traits were 0.99 for both sexes, and the phenotypic correlations were 0.95. This is as expected, considering that YG is a simple function of weight and age. Thus, at constant age the correlation between YG and weight has to be unity. Thus, all further analyses were computed only on YG.
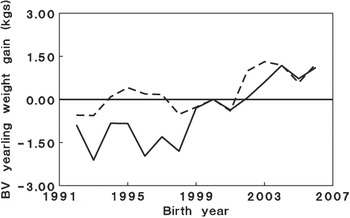
Mean EBV for YG by birth year and sex from data set 1 are plotted in Figure 4. A positive genetic trend is evident for both sexes; thus genetically corrected YG increased since 1993. The genetic trend was positive at 0.161 kg/year, while the phenotypic trends for first and last records per cow at −0.615 and −0.847 kg/year were both negative, when all calves with records are included and weighted equally. Although the genetic trend was statistically significant (P < 0.0001), a gain of 1.6 kg in 10 years is of very minor economic importance.
Mean BV for yearling weight gain × birth year and sex from data set 1. —, males; - -, females.

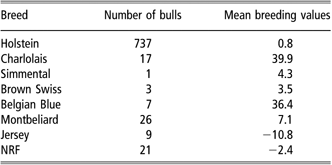
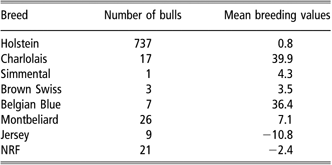
Mean breeding values for yearling growth rate and number of bulls by breed of sire are given in Table 6. As expected, mean breeding values were considerably higher for the beef breeds: Charlolais and Belgian Blue and lower for the Jerseys. The difference between mean EBV for Charlolais and Jersey was 50 kg.
Mean breeding values for yearling weight gain (kg/year) and number of bulls by breed of sire
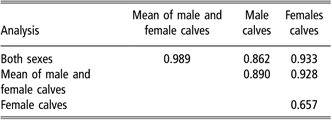
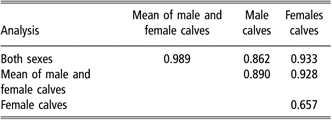
Correlations among EBV of 465 bulls with reliabilities >0.5 in the separate-sex analyses and the joint analyses are given in Table 7. Also listed is the correlation between the three evaluations and the mean EBV of the male and female calf evaluations. The correlation between the both-sex evaluation and the mean of the separate-sex evaluations was 0.99. This supports the validity of the assumptions of both-sex evaluations; specifically that the genetic correlation between the sexes is close to unity. The correlation between the male and female EBV was 0.66, but these evaluations were based on two completely different sets of weight records. In this case, if the actual genetic correlation is unity then the correlation between the EBV should be approximately equal to the mean of the square roots of the product of the two mean reliabilities for each bull. This value was 0.73; thus the genetic correlation is high, but probably not complete.
Correlations among genetic evaluations of 465 bulls for yearling weight gain with reliabilities >0.5 in all three analyses
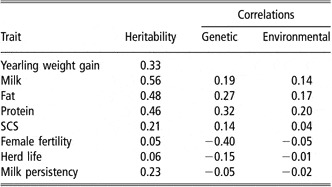
Genetic and environmental correlations by the REML analysis of data set 3 are given in Table 8. In general, the YG rate was positively economically correlated with milk production traits, but negatively correlated economically with the secondary traits, SCS, fertility and herd life. Both positive and negative correlations have been obtained between cow size and milk production (Brotherstone et al., Reference Brotherstone, Coffey and Banos2007). The trait with the genetic correlation with the highest absolute value was female fertility, −0.4. Brotherstone et al. (Reference Brotherstone, Coffey and Banos2007) found a genetic correlation between growth during weaning and mastitis, but not with fertility disorders. Hansen et al. (Reference Hansen, Cole, Marx and Seykora1999) also found higher fertility in the small cow size selection line as compared with the large size selection line.
Heritabilities and genetic and environmental correlations with yearling weight gain by the REML analysis of data set 3

REML = restricted maximum likelihood; SCS = somatic cell score.
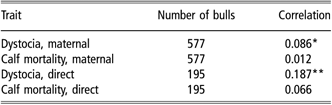
Correlations between breeding values for YG and calving traits for bulls with reliabilities >0.5 for both traits are given in Table 9. Correlations were significant with dystocia both as sire of cow and as sire of calf, but not for calf mortality, even though these traits are highly correlated genetically (Weller and Gianola, Reference Weller and Gianola1989). In both cases, the correlations with dystocia were ‘positive,’ that is higher YG was associated with more dystocia.
Correlations between breeding values for yearling weight gain and calving traits for bulls with reliabilities > 0.5 for both traits
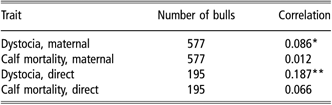
*P <0.05; **P <0.01.
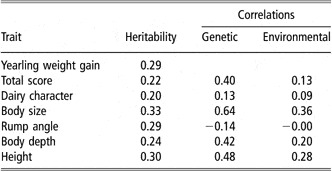
Genetic and environmental correlations by the REML analysis of data set 4 are given in Table 10 for conformation traits with absolute values of EBV correlations >0.2 with YG and rump angle. With respect to rump angle, the lower the rear pins relative to the front pins, the higher the score. Cows with low rump angle scores have more dystocia (Cue et al., Reference Cue, Monardes and Hayes1990). This corresponds to the current results that show a negative correlation between YG and rump angle, and a ‘positive’ correlation between YG and dystocia. As expected, the absolute values of the genetic correlations were generally greater than the correlations among the EBV. The one exception was dairy character. The highest genetic correlation was between YG and body size, 0.64. The absolute values of the environmental correlations were all lower than the genetic correlations, and in the same directions.
Heritabilities and genetic and environmental correlations with yearling weight gain by the REML analysis of data set 4

REML = restricted maximum likelihood.
Although YG is positively correlated with all three milk production traits, YG is highly correlated with mature cow size, and smaller cows require less feed for maintenance. Therefore, a case can be made for the application of some selection pressure to reduce YG, considering that YG has a small positive genetic trend, and has economically unfavorable genetic correlations with SCS, female, fertility and dystocia.
Conclusions
YG of male and female calves is highly correlated genetically; thus, records from both sexes can be combined into a joint genetic analysis. Furthermore, YG is highly correlated genetically with various measures of mature cow size. Similar to mature cow size, YG is positively correlated with milk production, but negatively correlated with fertility and cow survival. YG is also correlated with increased dystocia and SCS. In Israel, there was a positive genetic trend of 0.16 kg/year for YG.
Acknowledgements
This research was supported by grants from the Israel milk marketing board. We thank Ignacy Misztal for use of his animal model REML program.