1. Introduction
The advancement of microdroplet-based instruments has heightened the demand for the generation of uniform and size-controlled droplets (Zhu & Wang Reference Zhu and Wang2017; Miwa et al. Reference Miwa, Dimatteo, De Rutte, Ghosh and Di Carlo2022; Zhang, Gu & Xu Reference Zhang, Gu and Xu2024b; Liao et al. Reference Liao, Wu, Lu, Wang, Xu and Huang2025). Microdroplets are usually generated through passive breakup of larger droplets flowing through T-junction microchannels under constant inlet velocity or pressure conditions (Link et al. Reference Link, Anna, Weitz and Stone2004; Jullien et al. Reference Jullien, Tsang Mui Ching, Cohen, Menetrier and Tabeling2009; Leshansky et al. Reference Leshansky, Afkhami, Jullien and Tabeling2012; Deng, Wu & Chen Reference Deng, Wu and Chen2024). In this process, surface-active agents (surfactants) are commonly introduced to modulate the interfacial tension between the immiscible two fluids and optimise the droplet breakup dynamics (Zhu et al. Reference Zhu, Kou, Yao, Wu, Yao and Sun2019). Although previous studies (Hoang et al. Reference Hoang, Portela, Kleijn, Kreutzer and Van Steijn2013; Chen & Deng Reference Chen and Deng2017; Chen, Xue & Hu Reference Chen, Xue and Hu2019) have reported that the neck contraction of clean droplet transitions from an inertia-dominated to an interfacial tension-dominated regime, the prerequisite for this transformation remains controversial. Furthermore, the effect of surfactants on this transformation and prerequisite has not been explored. Consequently, a systematic study of surfactant-free and surfactant-laden droplet breakup in T-junction microchannels and the resulting surfactant effects is essential for optimising the droplet breakup processes and advancing droplet-based microfluidic device development.
Numerous studies have significantly advanced our understanding of the surfactant-free droplet breakup dynamics in T-junction microchannels, revealing the neck breakup mechanism and the prerequisite for spontaneous breakup. Hoang et al. (Reference Hoang, Portela, Kleijn, Kreutzer and Van Steijn2013) performed three-dimensional numerical simulations to study the droplet passive breakup in a T-shaped microchannel under constant inlet velocity condition. They found that the droplet neck experienced spontaneous and rapid breakup once its thickness fell below a critical value due to Rayleigh–Plateau instability (Plateau Reference Plateau1873; Rayleigh Reference Rayleigh1878; De Menech et al. Reference De Menech, Garstecki, Jousse and Stone2008). They further reported that the spontaneous neck breakup occurred when the local curvature of the droplet bottom neck exceeded that of other interfacial regions in the channel midplane. This phenomenon exhibits a breakup mechanism analogous to the end-pinching mechanism (Stone, Bentley & Leal Reference Stone, Bentley and Leal1986). Meanwhile, Hoang et al. (Reference Hoang, Portela, Kleijn, Kreutzer and Van Steijn2013) demonstrated that the critical neck thickness for spontaneous droplet breakup is determined by the height-to-width ratio
 $\chi$
of the rectangular channel, while being independent of both the capillary number and the viscosity ratio between the dispersed and continuous phases. Their findings revealed that, when
 $\chi$
satisfied
 $1/3\leq \chi \leq 1$
and the initial dimensionless droplet length
 ${l_{0}}^{*}$
(normalised by channel width) exceeded 2.8, the critical neck thickness followed the same scaling relationship as proposed by van Steijn & Kleijn (Reference Van Steijn and Kleijn2009) for rapid neck collapse during droplet generation in T-junction microchannels. This agreement led Hoang et al. (Reference Hoang, Portela, Kleijn, Kreutzer and Van Steijn2013) to conclude that the breakup mechanism was analogous to the backward-flow mechanism (van Steijn & Kleijn Reference Van Steijn and Kleijn2009). Chen & Deng (Reference Chen and Deng2017) systematically investigated the droplet dynamic in T-junction microchannels using a two-dimensional phase-field lattice Boltzmann model. Their study revealed that the internal vortices within droplets play a crucial role in determining droplet neck breakup. Specifically, droplet neck breakup is suppressed when the vortex intensity inside the droplet exceeds a critical threshold value. The vortex-intensity criterion is used to determine whether the droplet breakup in general, rather than to determine the critical neck thickness during spontaneous neck breakup. Additionally, higher droplet viscosity was shown to reduce internal velocity gradients, which suppressed vortex formation. This effect consequently decreased deformation resistance and simultaneously promoted neck breakup. Chen et al. (Reference Chen, Xue and Hu2019) numerically studied the droplet breakup in a T-junction microchannel. They found that the instability of the fluid thread was triggered when the capillary pressure at the neck centre matched the pressure inside the fluid thread. In their study, the internal pressure is calculated based on the curvature radius of the circular arcs in the cross-section of the columnar region.
Both the challenges in precise measurement of the critical droplet morphology required for spontaneous breakup and the discrepancies among numerical methods contribute to inconsistent findings regarding the prerequisite for neck spontaneous breakup. To date, there are two criteria that determine the critical neck thickness: (I) dominance of the neck curvature over all other interfacial regions (Hoang et al. Reference Hoang, Portela, Kleijn, Kreutzer and Van Steijn2013); and (II) pressure balance between the capillary pressure at the neck centre and the internal neck pressure (Chen et al. Reference Chen, Xue and Hu2019). Droplet neck contraction is governed by the capillary force and the pressure difference across the neck interface. Due to the influence of the inlet velocity, the droplets are asymmetric. Therefore, how to select the appropriate capillary pressure and pressure difference still requires further exploration. Furthermore, although extensive studies have examined the effect of surfactants on droplet generation (Kalli, Chagot & Angeli Reference Kalli, Chagot and Angeli2022; Kiratzis et al. Reference Kiratzis, Kovalchuk, Simmons and Vigolo2022; Kovalchuk & Simmons Reference Kovalchuk and Simmons2023) and breakup (Zhang et al. Reference Zhang, Wang, Chen, Shen and Cui2024a ) in microchannels, the influence of surfactants on both the critical neck thickness and its underlying mechanism remain unexplored.
In this paper, we numerically study the flow of surfactant-free and surfactant-laden droplets through regular and irregular T-junction microchannels. Stop-flow simulations are employed to determine the dimensionless critical neck thickness
 $\delta _\textit{cr}^{*}$
required for droplet spontaneous breakup. For the regular T-junctions, the effect of the width-to-height ratio
 $\chi$
of the microchannel on the critical neck thickness is studied for both surfactant-free and surfactant-laden systems. The critical neck thicknesses in the surfactant-free and surfactant-laden systems are compared at the identical
 $\chi$
, and used to determine the surfactant mechanism. The effect of surfactant concentration on
 $\delta _\textit{cr}^{*}$
is studied to optimise surfactant dosage. For the irregular T-junctions, two geometric parameters, i.e. the dimensionless constriction depth
 $d^{*}$
and length
 $l^{*}$
, characterise the constriction segment. We study the influence of
 $d^{*}$
and
 $l^{*}$
on
 $\delta _\textit{cr}^{*}$
in both surfactant-free and surfactant-laden systems. Based on the simulation results, four empirical formulas for predicting the variation of
 $\delta _\textit{cr}^{*}$
with
 $d^{*}$
and
 $l^{*}$
in the two systems are proposed.
2. Problem statement
In this paper, the passive breakup of surfactant-free and surfactant-laden droplets in regular and irregular T-junction microchannels is simulated. The regular T-junction microchannel (figure 1
a) is composed of a vertical entrance channel of length
 $L_{1}=150\,{\unicode{x03BC}} \text{m}$
and width
 $W=30\,{\unicode{x03BC}} \text{m}$
, and two horizontal branch channels of the same width. The length of the horizontal channel is
 $L=200\,{\unicode{x03BC}} \text{m}$
, and the vertical channel is centrally positioned with the horizontal channel. The height of the microchannel is varied to obtain different height-to-width ratios (
 $\chi =H/W$
). For the irregular T-junction microchannel (figure 1
a), a constriction section is added to the upper wall of the regular T-junction microchannel. The contour of the upper wall of the irregular T-junction is defined by the function
 $z(x)$
, which is written as
 \begin{equation} z\left(x\right)=\left\{\begin{array}{ll} 240.5-\dfrac{d}{2}\left[1+\cos \dfrac{2\pi \left(x-x_{c}\right)}{l}\right], & x_{c}-\dfrac{l}{2}\lt x\lt x_{c}+\dfrac{l}{2},\\ 240.5, & \text{otherwise}, \end{array}\right. \end{equation}
where
 $x_{c}$
is the position of the T-junction centre in the
 $x\hbox{-}$
direction. The centre of the constriction is centrally located at the horizontal microchannel. Two geometrical parameters, i.e. depth (
 $d$
) and length (
 $l$
), are introduced to represent the constriction shape. Figure 1(b) displays the variation in the shape of the T-junction microchannels with the constriction depth
 $d$
, where the constriction length is fixed at
 $l=W$
. The values of
 $d$
along the arrow direction are
 $d=0 , 0.05W , 0.1W , 0.2W , 0.3W$
and
 $0.4W$
, respectively. Figure 1(c) shows the microchannel shapes for various constriction lengths, where the constriction width is set to
 $d=0.2W$
. Along the arrow direction, the values of
 $l$
are
 $l=0.5W , 0.75W , W , 1.25W , 1.5W , 1.75W$
and
 $2W$
, respectively.
(a) Schematic illustration of droplet passing through both regular (
 $d=0$
) and irregular (
 $d\neq 0$
) T-junction microchannels. (b) Cross-sectional profiles (
 $x{-}z$
midplane) of irregular T-junctions with different values of constriction depth
 $d$
at a fixed constriction length
 $l=W$
. (c) Cross-sectional profiles (
 $x{-}z$
midplane) of irregular T-junctions with different values of constriction length
 $l$
at a fixed constriction depth
 $d=0.2W$
.

Consistent with previous studies (Link et al. Reference Link, Anna, Weitz and Stone2004; Jullien et al. Reference Jullien, Tsang Mui Ching, Cohen, Menetrier and Tabeling2009; Chen & Deng Reference Chen and Deng2017; Zhang et al. Reference Zhang, Wang, Chen, Shen and Cui2024a
), the densities of the droplet and matrix fluid are set as
 $\rho ^{B}=\rho ^{R}=1000\text{ kg}\boldsymbol{\cdot }\mathrm{m}^{-3}$
; the interfacial tension in the absence of surfactants is set as
 $\sigma _{0}=0.005\, \mathrm{N}\boldsymbol{\cdot }\mathrm{m}$
; the dynamic viscosities of the droplet and matrix fluid are set as
 $\mu ^{B}=\mu ^{R}/8=0.001\text{ Pa}\boldsymbol{\cdot }\mathrm{s}$
. A constant inlet velocity
 $u_{\textit{in}}$
is applied at the bottom inlet, while atmospheric pressure
 $P_{0}$
is maintained at both the right and left branch outlets (figure 1). Under the influence of the inlet velocity, a droplet with an initial length
 $l_{0}$
in the vertical channel enters the T-junction and breaks up into two daughter droplets. For dimensionless conversion from physical to lattice Boltzmann (LB) parameters, three reference scales are selected, i.e. the mass scale
 $M_{0}=10^{-15}\text{ kg}$
, length scale
 $L_{0}=10^{-6}\mathrm{m}$
and time scale
 $T_{0}=10^{-7}\mathrm{s}$
. A physical parameter of dimension
 $(\mathrm{kg})^{n1}(\mathrm{s})^{n2}(\mathrm{m})^{n3}$
is divided by
 $(M_{0})^{n1}(T_{0})^{n2}(L_{0})^{n3}$
to obtain its dimensionless LB parameter. The resulting LB parameters are given below:
 $W_{\textit{LB}}=W/L_{0}=40 , \rho _{\textit{LB}}^{B}=\rho _{\textit{LB}}^{R}=\rho ^{B}/(M_{0}/L_{0}^{3})=1, {} \sigma _{\textit{LB}}=\sigma _{0}/(M_{0}/T_{0}^{2})=0.0375$
and
 $\mu _{\textit{LB}}^{B}=\mu _{\textit{LB}}^{R}/8=\mu ^{B}/(M_{0}/L_{0}T_{0})=0.1$
, where the ‘LB’ subscript identifies LB parameters versus their physical parameters. For the surfactant-laden system, the bulk surfactant concentration is taken as
 $\psi _{b}=0.1$
. Unless otherwise specified, the mobility is fixed at
 $M_{\psi }=0.001$
, the bulk surfactant solubility is taken as
 $E_{x}=0.117$
the elasticity number is taken as
 $E_{0}=0.5$
and the diffusivity is taken as
 $\textit{Pi}=1.35$
(Soligo et al. Reference Soligo, Roccon and Soldati2019, Reference Soligo, Roccon and Soldati2020).
The problem can be described using three dimensionless parameters, i.e. the capillary number
 $\textit{Ca}$
, Reynolds number
 $\textit{Re}$
and viscosity ratio
 $\lambda$
, which are written as (Zhang et al. Reference Zhang, Wang, Chen, Shen and Cui2024a
)
 \begin{equation} \textit{Ca}=\frac{\mu ^{R}u_{\textit{in}}}{\sigma _{0}}, \textit{Re}=\frac{\rho ^{R}\textit{Wu}_{\textit{in}}}{\mu ^{R}}, \lambda =\frac{\mu ^{R}}{\mu ^{B}}. \end{equation}
In the considered flow regime, the Reynolds number remains low (
 $\textit{Re}\approx 0.02$
), indicating that the viscous force dominates over the inertial force. Unless otherwise specified, the dimensionless initial droplet length and capillary number are set to
 $l_{0}^{*}=l_{0}/W=3.5$
and
 $\textit{Ca}=0.01$
, respectively. In this paper, the numerical results for surfactant-free and surfactant-laden systems are compared at an identical
 $\textit{Ca}$
value. It is known that the effects of surfactants are twofold: (I) interfacial tension reduction caused by surfactant adsorption at the fluid–fluid interface, and (II) Marangoni stress induced by interfacial tension gradients along the fluid–fluid interface. In our study, the dimensionless initial droplet length is fixed at
 ${l_{0}}^{*}=3.5$
. Under this configuration, the droplet completely obstructs the horizontal microchannel, leading to a nearly uniform surfactant distribution along the tangential direction of the droplet interface. This uniformity significantly weakens the Marangoni stress. Notably, this comparative approach has been widely adopted in both experimental studies (Chagot et al. Reference Chagot, Quilodrán-Casas, Kalli, Kovalchuk, Simmons, Matar, Arcucci and Angeli2022; Kalli & Angeli Reference Kalli and Angeli2022) and numerical simulations (Xu, Bian & Liang Reference Xu, Bian and Liang2023; Zhou et al. Reference Zhou, Xing, Liu and Yan2023; Ba et al. Reference Ba, Liu, Li and Yang2024).
3. Numerical method
In this paper, our recently developed LB method (Zhang et al. Reference Zhang, Cui, Liu, Chen, Zhang and Li2023a, Reference Zhang, Wang, Chen, Shen and Cui2024a) is employed to simulate the flow of surfactant-free and surfactant-laden droplets in both regular and irregular T-junction microchannels. In this method, the colour-gradient model is used to solve the flows of two immiscible fluids and an additional LB model is used to solve the evolution of surfactant concentration. The two models are coupled via a modified Langmuir equation of state (Liu et al. Reference Liu, Zhang, Ba, Wang and Wu2020; Zhang et al. Reference Zhang, Liu, Wei, Hou and Jiang2021a ), enabling surfactant concentration to attain or surpass the critical micelle concentration (CMC). This method is briefly summarised below.
In colour-gradient model, two distribution functions (
 $f_{i}^{B}$
for blue fluid and
 $f_{i}^{R}$
for red fluid) are introduced, where the subscript
 $i$
represents the
 $i\mathrm{th}$
lattice velocity direction. First, the total distribution function
 $f_{i}=f_{i}^{B}+f_{i}^{R}$
undergoes a collision step, which written as (Jiang et al. Reference Jiang, Yang, Boek and Tsuji2021)
 \begin{equation} f_{i}^{\dagger }\left(\boldsymbol{x},t\right)=f_{i}\left(\boldsymbol{x},t\right)+\varOmega _{i}\left(\boldsymbol{x},t\right)+\overline{F}_{i}, \end{equation}
where
 $f_{i}(\boldsymbol{x},t)$
and
 $f_{i}^{\dagger }(\boldsymbol{x},t)$
are the pre-collision and post-collision distribution functions towards the
 $i\mathrm{th}$
lattice velocity direction at spatial coordinate
 $\boldsymbol{x}$
and time
 $ t ;\overline{F}_{i}$
is the forcing term. Here,
 $\varOmega_{i}(\boldsymbol{x},t)$
is the multiple-relaxation-time collision operator, and its expression is written as follows (Zhang, Liu & Ba Reference Zhang, Liu and Ba2019):
 \begin{equation} \varOmega_{i}\left(\boldsymbol{x},t\right)=-\sum _{\!j}\big(\boldsymbol{M}^{-1}\boldsymbol{SM}\big)_{\textit{ij}}\big(f_{\!j}\big(\boldsymbol{x},t\big)-f_{\!j}^{\textit{eq}}\big(\boldsymbol{x},t\big)\big), \end{equation}
where the transformation matrix
 $\boldsymbol{M}$
, diagonal relaxation matrix
 $\boldsymbol{S}$
and equilibrium distribution function
 $f_{i}^{\textit{eq}}$
can be found in Liu et al. (Reference Liu, Zhang, Ba, Wang and Wu2020).
The interfacial force
 $\overline{F}_{i}$
in (3.1) is defined as (Yu & Fan Reference Yu and Fan2010)
 \begin{equation} \overline{F}_{i}=\sum _{\!j}\left(\boldsymbol{I}-\frac{1}{2}\boldsymbol{M}^{-1}\boldsymbol{SM}\right)_{\textit{ij}} w_{\!j}\left[\frac{\boldsymbol{e}_{\!j}-\boldsymbol{u}}{c_{s}^{2}}+\frac{\left(\boldsymbol{e}_{\!j}\boldsymbol{\cdot }\boldsymbol{u}\right)\boldsymbol{e}_{\!j}}{c_{s}^{4}}\right]\boldsymbol{\cdot }\boldsymbol{F}_{\!s}\delta _{t}, \end{equation}
where
 $\boldsymbol{I}$
is a
 $9\times 9$
unit matrix. The interfacial force
 $\boldsymbol{F}_{\!s}$
combines interfacial tension and Marangoni stress from uneven interfacial tension (Zhang et al. Reference Zhang, Liu, Wei, Hou and Jiang2021a
)
 \begin{equation} \boldsymbol{F}_{\!s}=-\frac{1}{2}\sigma \left(\psi \right)k\boldsymbol{\nabla \!}\rho ^{N}+\frac{1}{2}|\boldsymbol{\nabla \!}\rho ^{N}|\boldsymbol{\nabla} _{s}\sigma \left(\psi \right), \end{equation}
where
 $\sigma (\psi )$
is the interfacial tension. The local interface curvature
 $k=-(\boldsymbol{I}-\boldsymbol{n}\otimes \boldsymbol{n})\boldsymbol{\cdot }\boldsymbol{\nabla }\boldsymbol{\cdot }\boldsymbol{n}=-\boldsymbol{\nabla }\boldsymbol{\cdot }\boldsymbol{n}$
is computed based on the interfacial unit normal vector
 $\boldsymbol{n}=-\boldsymbol{\nabla \!}\rho ^{N}/| \boldsymbol{\nabla \!}\rho ^{N}|$
(Liu et al. Reference Liu, Ba, Wu, Li, Xi and Zhang2018). The index function
 $\rho ^{N}=(\rho ^{R}-\rho ^{B})/(\rho ^{R}+\rho ^{B})$
is used to identify the position of the fluid–fluid interface.
Consistent with previous studies (Zhang, Liu & Zhang Reference Zhang, Liu and Zhang2021b
; Gu et al. Reference Gu, Zhang, Liu and Wu2023), a modified Langmuir equation of state is used to describe the relationship between
 $\sigma (\psi )$
and dimensionless surfactant concentration
 $\psi$
, which is written as
 \begin{equation} \sigma \left(\psi \right)=\max \left\{\sigma _{\textit{min}}, \sigma _{0}\left[1+E_{0}\log \left(1-\psi \right)\right]\right\}\!, \end{equation}
where the elasticity number
 $E_{0}$
represents the strength of the surfactant action; for a fixed concentration, a higher
 $E_{0}$
corresponds a stronger reduction in interfacial tension. Here,
 $\sigma _{0}$
is the interfacial tension in the absence of surfactants;
 $\sigma _{\textit{min}}$
is the minimum interfacial tension, which is set as
 $\sigma _{0}/3$
to avoid non-physical values of
 $\sigma (\psi )$
. The similar treatment has been widely adopted in the literature (Shih et al. Reference Shih, Wu, Chang and Lin2011; Zhang et al. Reference Zhang, Cui, Liu, Chen, Zhang and Li2023a).
Subsequently, a recolouring step is executed to segregate the red and bule fluids and maintain a reasonable diffused interface. Finally, a streaming step is implemented to transport
 $f_{i}^{B}$
and
 $f_{i}^{R}$
to the adjacent lattice nodes. The implement process of the two steps follows the methodology described by Zhang et al. (Reference Zhang, Liu and Ba2019). Macroscopic properties (
 $\rho$
and
 $\boldsymbol{u}$
) are derived from the post-streaming functions, i.e.
 $\rho ^{k}(\boldsymbol{x},t)=\sum _{i}f_{i}^{k}(\boldsymbol{x},t)$
and
 $\rho \boldsymbol{u}(\boldsymbol{x},t)=\sum _{i}f_{i}^{k}(\boldsymbol{x},t)\boldsymbol{e}_{i}+\boldsymbol{F}_{\!s}(\boldsymbol{x},t)\delta _{t}/2$
, where k represents either B or R.
The transportation of soluble surfactants in the bulk phase and droplet interface is governed by the Cahn–Hilliard equation (Soligo et al. Reference Soligo, Roccon and Soldati2019, Reference Soligo, Roccon and Soldati2020; Zong et al. Reference Zong, Zhang, Liang, Wang and Xu2020)
 \begin{equation} \frac{\partial \psi }{\partial t}+\boldsymbol{u}\boldsymbol{\cdot }\boldsymbol{\nabla }\psi =\boldsymbol{\nabla }\boldsymbol{\cdot }\left(M_{\psi }\boldsymbol{\nabla \!}\mu _{\psi }\right), \end{equation}
where
 $M_{\psi }$
is mobility. The chemical potential
 $\mu _{\psi }$
is written as
 \begin{equation} \mu _{\psi }=\textit{Pi}\log\! \left(\frac{\psi }{1-\psi }\right)-\frac{\big[1-\big(\rho ^{N}\big)^{2}\big]^{2}}{4}+\frac{\big(\rho ^{N}\big)^{2}}{2E_{x}}, \end{equation}
where the parameters
 $\textit{Pi}$
and
 $E_{x}$
are used to control the bulk surfactant diffusivity and solubility, respectively.
The Cahn–Hilliard equation is solved by using a LB method, which is written as (Liang et al. Reference Liang, Shi, Guo and Chai2014; Zhang et al. Reference Zhang, Liu, Wei, Hou and Jiang2021a )
 \begin{align} & g_{i}\big(\boldsymbol{x}+\boldsymbol{e}_{i}\delta _{t}, t+\delta _{t}\big)-g_{i}\big(\boldsymbol{x}, t\big) \nonumber \\ & \quad =-\dfrac{1}{\tau _{g}}\big[g_{i}\big(\boldsymbol{x}, t\big)-g_{i}^{\textit{eq}}\big(\boldsymbol{x}, t\big)\big]+w_{i}\dfrac{\boldsymbol{e}_{i}\boldsymbol{\cdot }\boldsymbol{u}}{c_{s}^{2}}\partial _{t}\psi \delta t, \end{align}
where
 $g_{i}$
is the distribution function of
 $\psi$
. The dimensionless relaxation time
 $\tau _{g}$
is taken as 1 (Wang, Liu & Zhang Reference Wang, Liu and Zhang2016). Here,
 $g_{i}^{\textit{eq}}$
is the equilibrium distribution function of
 $g_{i}$
, which can be found in Wang et al. (Reference Wang, Liu and Zhang2016). The dimensionless surfactant concentration
 $\psi$
is calculated by
 $\psi (\boldsymbol{x},t)=\sum _{i}g_{i}(\boldsymbol{x},t)$
.
In this paper, the static contact angle is fixed at
 $\theta _{0}=0^{\circ}$
in the absence of surfactants, indicating completely hydrophilic walls. Under this configuration, the droplet interface does not intersect with the channel walls and therefore does not form a distinct contact angle. This configuration implies that, even if surfactants adsorption occurs on the channel walls, it would not affect the apparent contact angle. Therefore, we assume that the interfacial tension between the fluids and channel walls is not modified by surfactants, which is consistent with previous works (Yao et al. Reference Yao, Chen, Wang, Zhang, Zeng and Liu2025; Zhao et al. Reference Zhao, Zhang, Wang and Liu2025). The dependence of the dynamic contact angle
 $\theta (\psi )$
on the dimensionless surfactant concentration
 $\psi$
can be derived and written as
 $\theta (\psi )=\arccos [\sigma _{0}\cos \theta _{0}/\sigma (\psi )]$
(Zhang et al. Reference Zhang, Liu, Wei, Hou and Jiang2021a
). It should be noted that this expression may yield non-physical values for
 $| \sigma _{0}\cos \theta _{0}/\sigma (\psi )| \gt 1$
when the channel walls are not completely hydrophilic. To prevent this, a modified Langmuir equation of state has to be used, which reads as
 $\sigma (\psi )=\max \{\sigma _{\textit{min}}, \sigma _{0}[1+E_{0}\log (1-\psi )]\}$
, where the minimum saturated value of the interfacial tension
 $\sigma _{\textit{min}}$
varies for different combinations of fluid and surfactants. In this paper, we simply set
 $\sigma _{\textit{min}}=\sigma _{0}/3$
. A similar treatment has been widely adopted in the literature (Shih et al. Reference Shih, Wu, Chang and Lin2011; Zhang et al. Reference Zhang, Cui, Liu, Chen, Zhang and Li2023a). Subsequently, the ‘predictor–corrector’ wetting boundary condition is used to enforce
 $\theta (\psi )$
on an arbitrary solid surface. The details of the implementation steps can be found in previous works (Xu, Liu & Valocchi Reference Xu, Liu and Valocchi2017; Akai, Bijeljic & Blunt Reference Akai, Bijeljic and Blunt2018; Zhang et al. Reference Zhang, Cui, Liu, Chen, Zhang and Li2023a,b
). It should be noted that the analytical solution for the surfactant concentration distribution across a two-phase interface, as derived by Soligo, Roccon & Soldati (Reference Soligo, Roccon and Soldati2020), has been widely adopted for verifying numerical methods. Our previous work (Zhang et al. Reference Zhang, Cui, Liu, Chen, Zhang and Li2023a
) has also demonstrated that the present numerical method can accurately capture the evolution of surfactant concentration.
4. Grid independence test
In this section, continuous simulations are first performed to study the effect of grid resolution on the temporal evolution of the droplet neck thickness in a T-junction microchannel. Subsequently, stop-flow simulations are conducted to access the impact of grid resolution on the critical neck thickness required for spontaneous droplet breakup.
4.1. Temporal evolution of the droplet neck thickness
Our previous work (Zhang et al. Reference Zhang, Wang, Chen, Shen and Cui2024a
) has demonstrated that a grid resolution of
 $W=30$
lattices can produce grid-independent results for a microfluidic T-junction with a height-to-width ratio of
 $\chi =1$
. Different height-to-width ratios are obtained by altering the microchannel height
 $H$
, while maintaining the microchannel width
 $W$
unchanged. In this paper,
 $\chi$
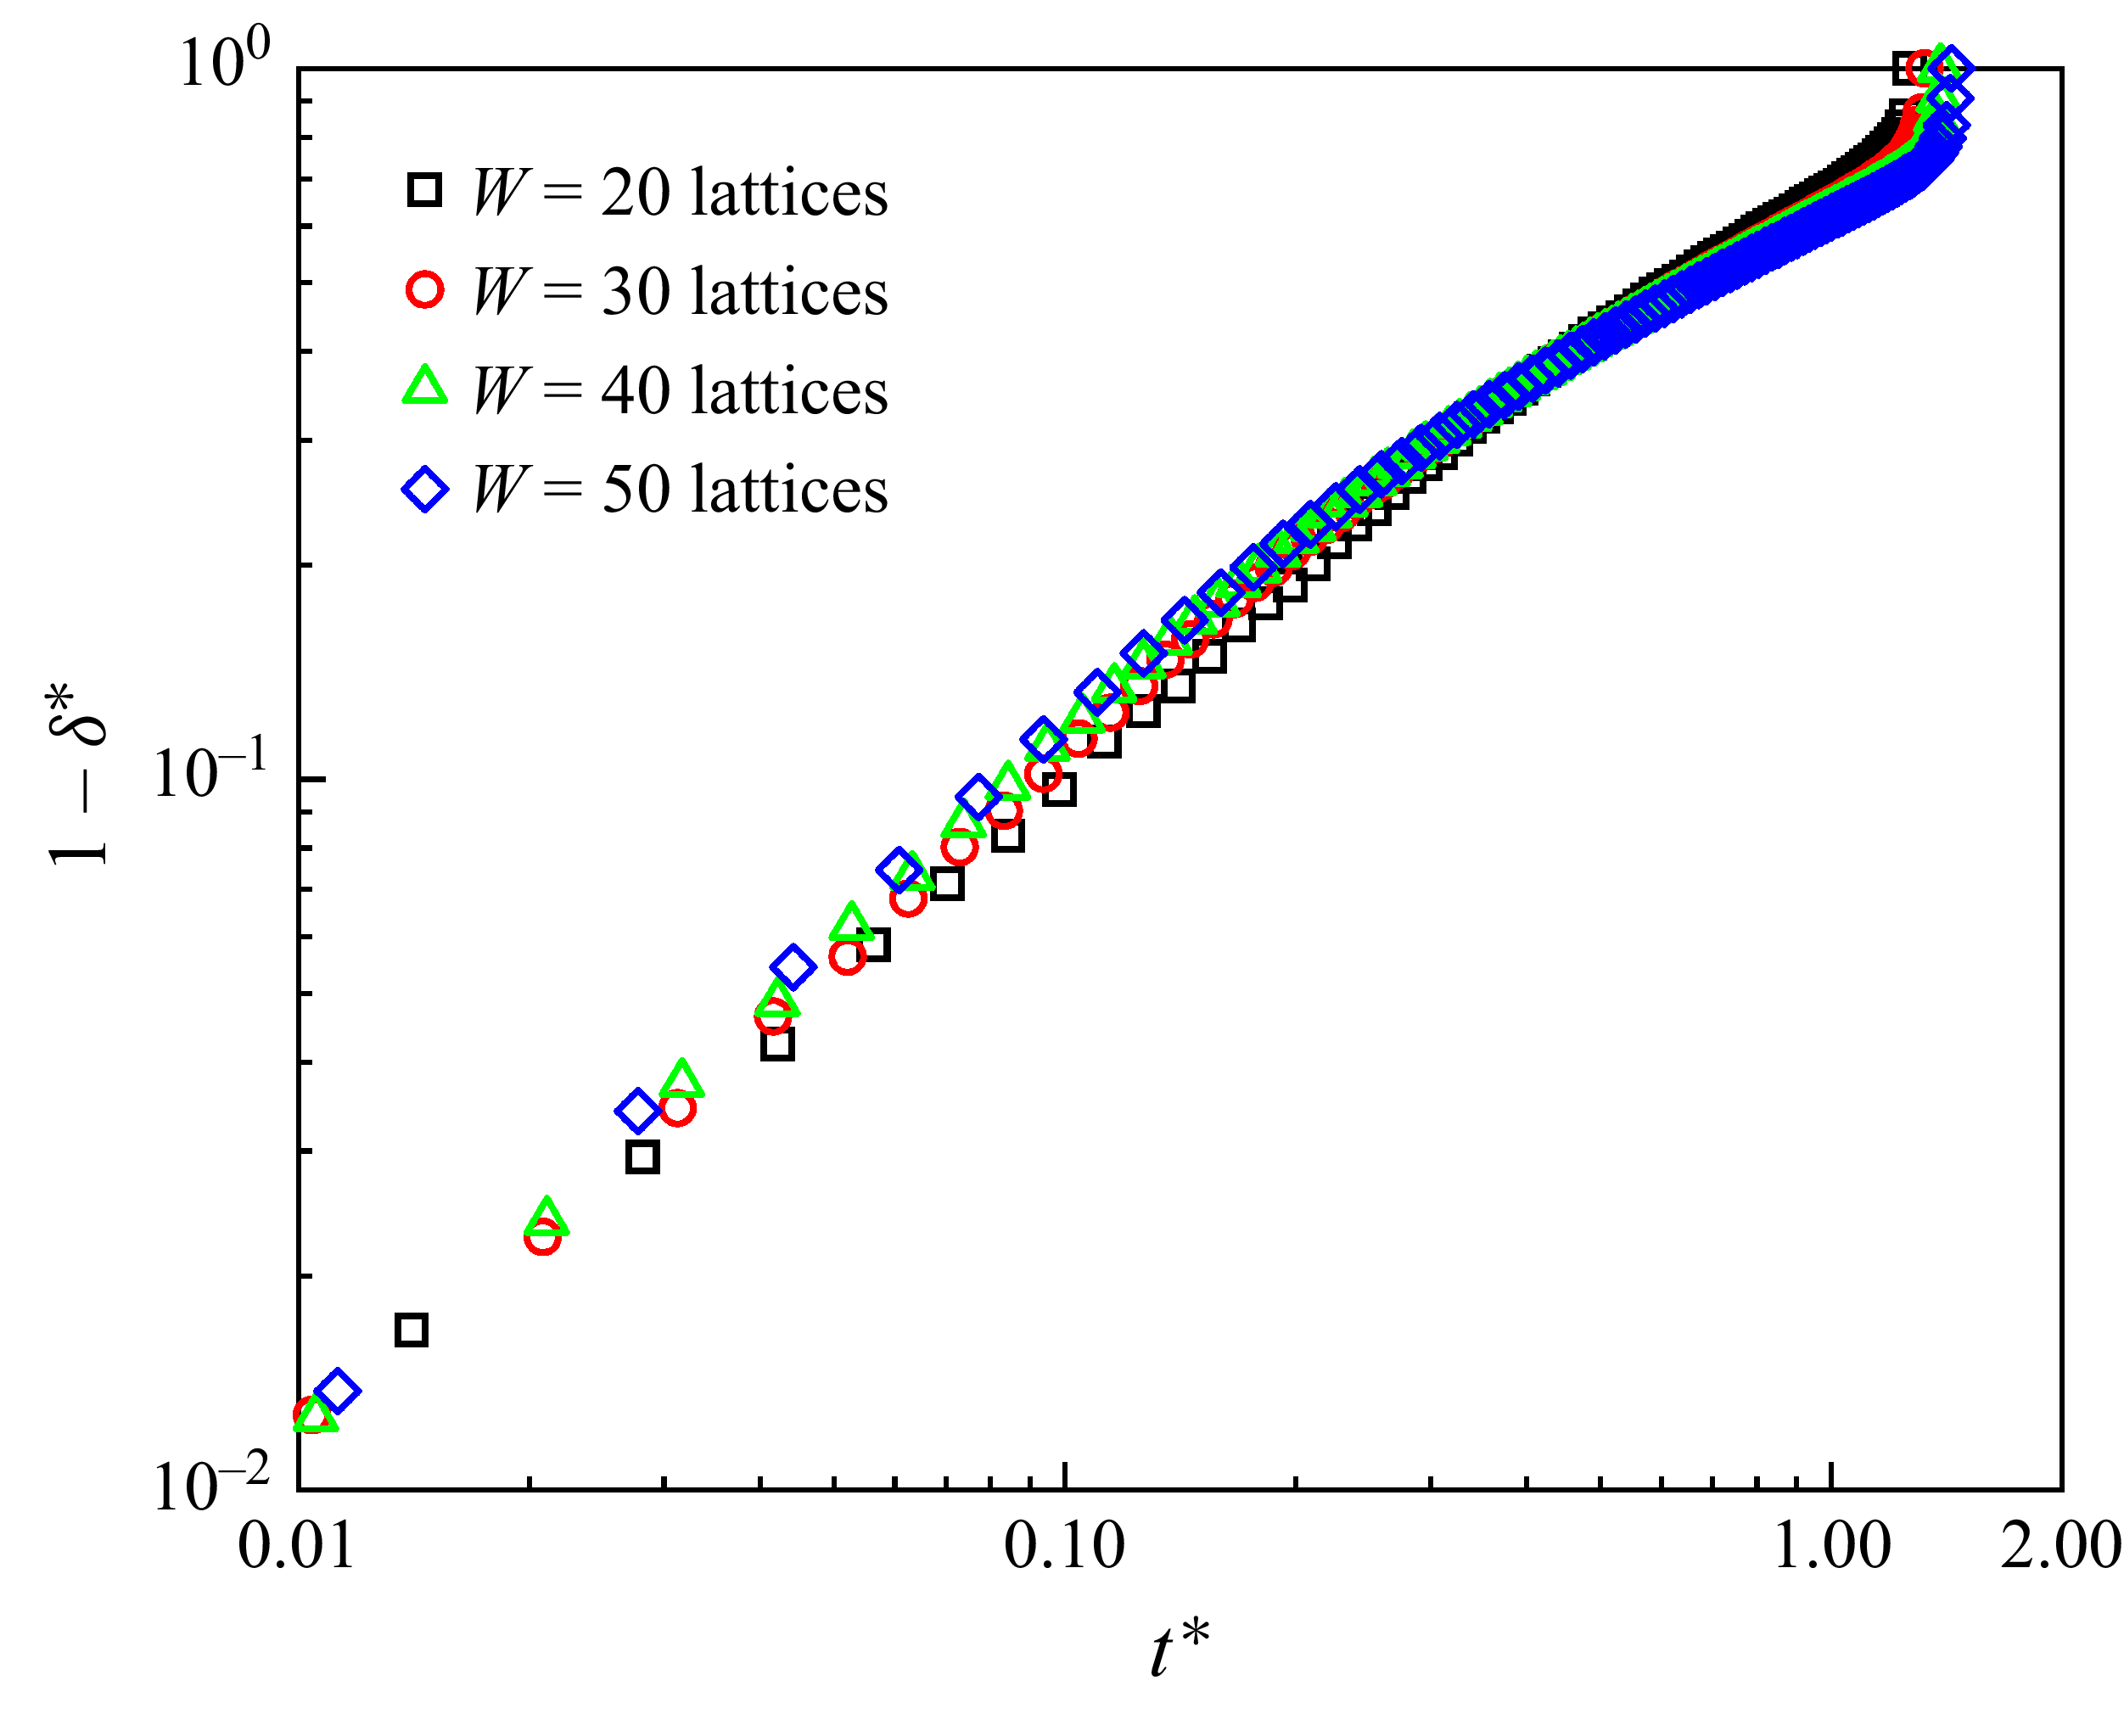
ranges from 0.4 to 1. To ensure sufficient grid resolution in the direction of the microchannel height, it is necessary to conduct a grid independence test for the minimum height-to-width ratio. Figure 2 shows the temporal evolution of the dimensionless droplet neck thickness
 $\delta ^{*}$
for the microchannel with
 $\chi =0.4$
at three different grid resolutions in the surfactant-free system. Here,
 $\delta ^{*}$
is defined as
 $\delta ^{*}=\delta /W$
, where
 $\delta$
denotes the droplet neck thickness measured in lattice units in the
 $y{-}z$
middle plane (the inset). As depicted in this figure, there is a progressive convergence of numerical results towards those obtained for
 $W=50$
lattices with increasing grid resolution. Furthermore, the numerical results for
 $W=40$
lattices essentially coincide with those for
 $W=50$
lattices, suggesting that the grid-independent results can be obtained for
 $W=40$
lattices.
Variation of the dimensionless neck thickness
 $\delta ^{*}$
with the dimensionless time
 $t^{*}$
for the microchannel with height-to-width ratio
 $\chi =0.4$
at three different grid resolutions in the surfactant-free system. In this figure,
 $\delta ^{*}$
and
 $t^{*}$
are defined as
 $\delta ^{*}=\delta /W$
and
 $t^{*}=\textit{Ca}\sigma _{0}t/(\mu ^{R}W)$
, respectively. The black squares, red circles, green triangles and blue diamond symbols correspond to the microchannel widths of
 $W=20$
, 30, 40 and 50 lattices, respectively. Other parameters are taken as:
 $\psi _{b}=0$
and
 $\chi =0.4$
.

Next, the effect of the grid resolution on the temporal evolution of the neck of a surfactant-laden droplet is studied, as depicted in figure 3. The numerical parameters are set to the same values as those used in figure 2, except for
 $\psi _{b}=0.1$
. In this figure, the microchannel widths of
 $W=20$
, 30, 40 and 50 lattices are represented by the black squares, red circles, green triangles and blue diamond symbols, respectively. From this figure, it can be observed that the numerical results gradually converge to the results obtained for the
 $W=50$
lattices with increasing grid resolution, and the results for
 $W=40$
lattices and
 $W=50$
lattices essentially coincide. This indicates that the grid resolution for
 $W=40$
lattices is sufficient to produce grid-independent results, consistent with the surfactant-free system (figure 2).
Variation of the dimensionless neck thickness
 $\delta ^{*}$
with the dimensionless time
 $t^{*}$
at three different grid resolutions for the surfactant-laden system. Other simulation parameters are taken as:
 $\psi _{b}=0.1$
and
 $\chi =0.4$
.

4.2. Critical droplet neck thickness for spontaneous breakup
Since this paper focuses on the onset of droplet spontaneous breakup, it is necessary to further investigate the effect of the grid resolution on the critical neck thickness
 $\delta _\textit{cr}$
required for droplet spontaneous breakup. We adopt stop-flow simulations (Stone et al. Reference Stone, Bentley and Leal1986; Blanchette & Bigioni Reference Blanchette and Bigioni2006; Hoang et al. Reference Hoang, Portela, Kleijn, Kreutzer and Van Steijn2013; Chen et al. Reference Chen, Xue and Hu2019) to determine the values of
 $\delta _\textit{cr}$
for both surfactant-free and surfactant-laden droplets. In stop-flow simulations, the droplet shape and surfactant concentration distribution at a specified time are first extracted from continuous simulations. Then, the velocity in the computational domain is set to zero, the pressures at the two outlets as well as the velocity at the inlet are set to atmospheric pressure
 $P_{0}$
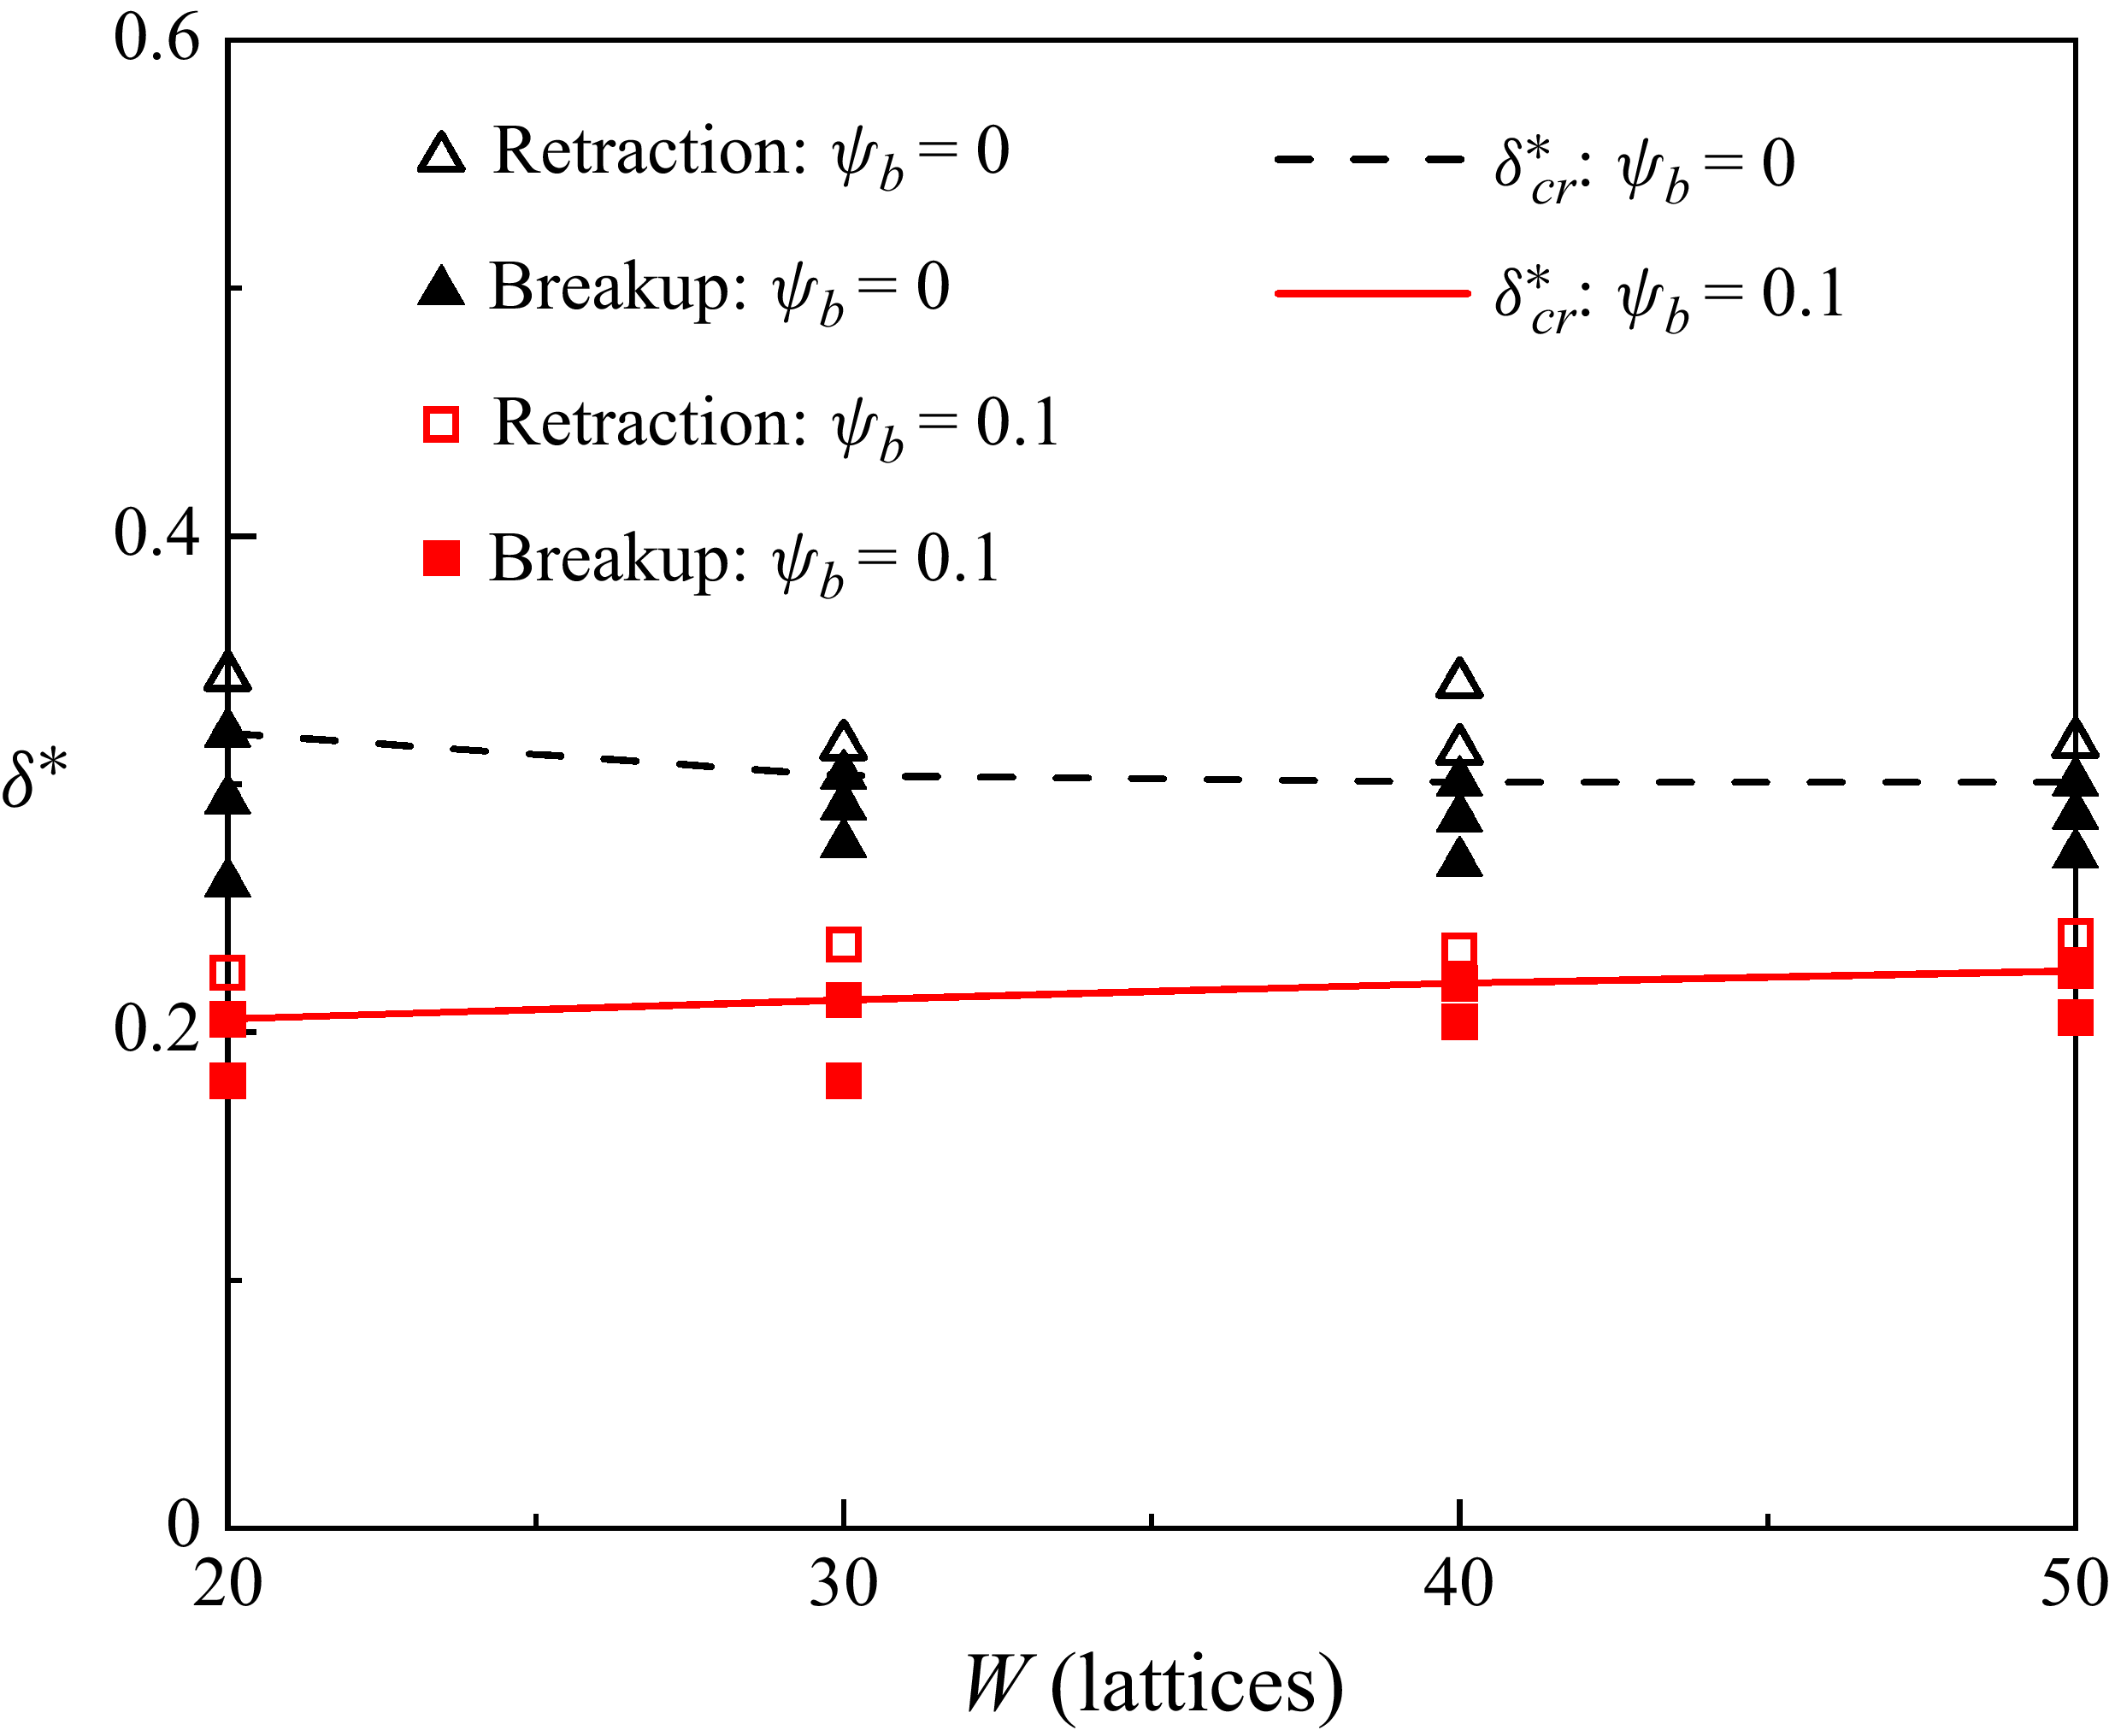
and zero, respectively, and the distribution functions are initialised using their equilibrium values. Finally, the simulations are restarted. This approach eliminates the inertial force, allowing interfacial tension and non-equilibrium pressure to influence the droplet neck thickness. Figure 4 displays the variation of the dimensionless critical neck thickness (
 $\delta _\textit{cr}^{*}=\delta _\textit{cr}/H$
) with the microchannel width
 $W$
for both surfactant-free and surfactant-laden droplets, where
 $\delta _\textit{cr}^{*}$
is defined as the maximum dimensionless neck thickness that enables spontaneous breakup. In this figure, the black and red symbols denote the surfactant-free and surfactant-laden systems, respectively. The empty and solid symbols indicate the droplet neck retraction and breakup, respectively. In both systems, the dimensionless critical neck thickness gradually converges to the value for
 $W=50$
lattices, with the result for
 $W=40$
lattices showing an essentially identical value to that for
 $W=50$
lattices. To achieve a balance between the computational efficiency and the precision required to accurately determine (I) the temporal evolution of droplet neck thickness (figures 2 and 3) and (II) the dimensionless critical neck thickness for spontaneous droplet breakup (figure 4), a microchannel width of
 $W=40$
lattices is chosen for both surfactant-free and surfactant-laden systems in subsequent simulations.
Effect of grid resolution on the dimensionless critical droplet neck thickness
 $\delta _\textit{cr}^{*}$
for both surfactant-free and surfactant-laden systems. The black and red symbols represent the surfactant-free and surfactant-laden droplets, respectively, while the empty and solid symbols correspond to droplet neck retraction and breakup, respectively. The black dashed line and red solid line represent the values of
 $\delta _\textit{cr}^{*}$
for the surfactant-free and surfactant-laden droplets, respectively.

5. Results and discussion
In this section, we investigate the dynamic behaviour of droplets traversing both regular and irregular T-junction microchannels, as illustrated in figure 1. Stop-flow simulations (described in § 4.2) are conducted to determine the dimensionless critical neck thickness
 $\delta _\textit{cr}^{\mathrm{*}}$
required for spontaneous droplet breakup in these two types of T-junctions. The influence of surfactants on
 $\delta _\textit{cr}^{\mathrm{*}}$
is evaluated by comparing the surfactant-free and surfactant-laden systems under the same dimensionless parameters.
5.1. Onset of the spontaneous breakup of droplets in regular T-junctions
This subsection examines the influence of surfactants on the onset of spontaneous droplet breakup in regular T-junction microchannels (figure 1
a). We evaluate the role of surfactants by comparing the dimensionless critical neck thickness
 $\delta _\textit{cr}^{\mathrm{*}}$
for spontaneous droplet breakup between the surfactant-free and surfactant-laden systems across varying height-to-width ratios (
 $\chi$
) of the microchannels. Furthermore, we analyse the effect of the surfactant concentration on
 $\delta _\textit{cr}^{\mathrm{*}}$
. Finally, we discuss (I) the prerequisite for achieving
 $\delta _\textit{cr}^{\mathrm{*}}$
and (II) how surfactants influence this prerequisite.
5.1.1. Effect of microchannel height-to-width ratio
We first analyse the onset of spontaneous droplet breakup in a square T-junction microchannel, i.e.
 $\chi =1$
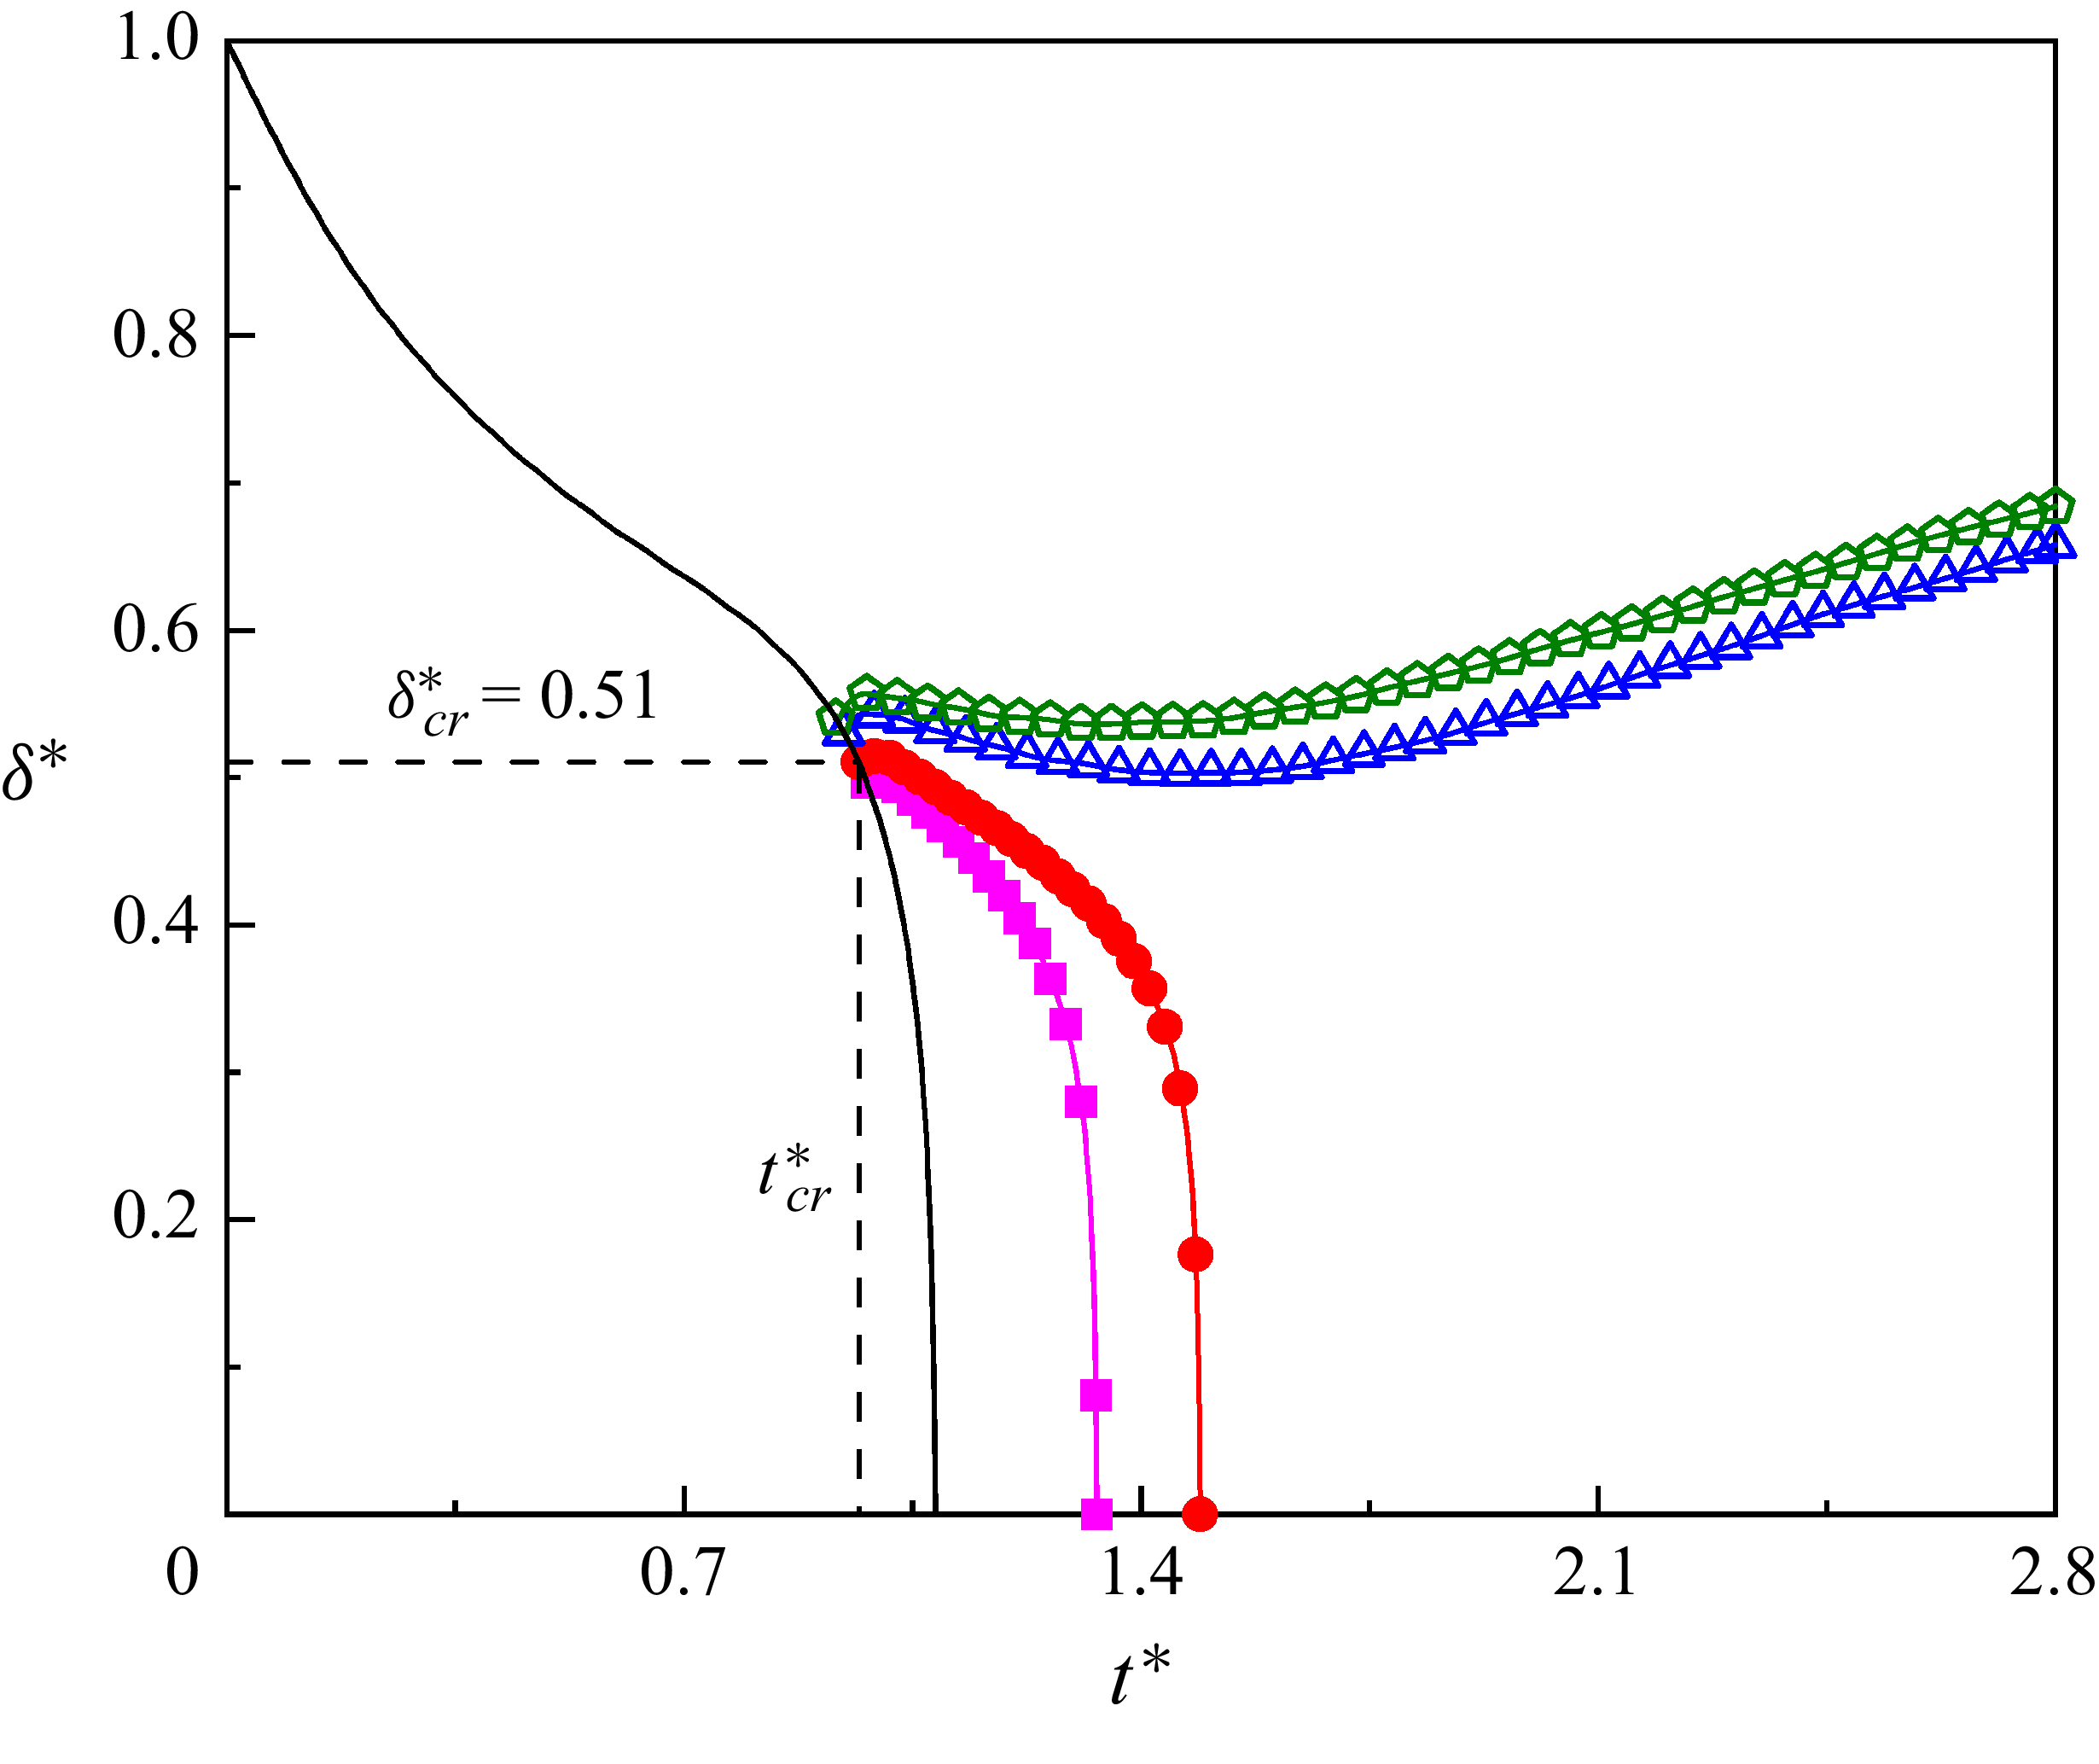
. Figure 5 displays the temporal evolution of the dimensionless neck thickness
 $\delta ^{*}$
for a surfactant-free droplet. In this figure,
 $t_\textit{cr}^{*}$
represents the time when
 $\delta ^{*}$
decreases to the critical neck thickness
 $\delta _\textit{cr}^{*}$
. The solid black line represents continuous simulation results, while the coloured lines with symbols correspond to stop-flow simulation results. The intersections between the coloured lines and the black line indicate the time points at which the continuous simulations are stopped. When the flow is stopped prior to
 $t_\textit{cr}^{*}$
(lines with empty symbols),
 $\delta ^{*}$
increases monotonically after a brief time interval, indicating that the droplet is restored to its original shape. Conversely, when the flow is stopped at or after
 $t_\textit{cr}^{*}$
(lines with solid symbols),
 $\delta ^{*}$
first increases slightly but then undergoes rapid thinning to zero, confirming droplet neck breakup. It can be observed from this figure that
 $\delta _\textit{cr}^{*}$
is approximately 0.51, consistent with reported values of 0.52 (Chen et al. Reference Chen, Xue and Hu2019) and 0.53 (Hoang et al. Reference Hoang, Portela, Kleijn, Kreutzer and Van Steijn2013). As shown in the figure, the value of
 $\delta _\textit{cr}^{*}$
identified from the stop-flow simulation (marked by the red circular symbols with a line) matches the neck thickness at which accelerated thinning occurs in the continuous simulation. During stop-flow simulations,
 $\delta ^{*}$
exhibits non-monotonic behaviour with
 $t^{*}$
. This phenomenon can be explained by the temporal evolution of the droplet morphology, as illustrated in figure 6.
Temporal evolution of the dimensionless neck thickness
 $\delta ^{*}$
in continuous (black solid line) and stop-flow (coloured lines with symbols) simulations, where
 $\delta ^{*}$
is defined as
 $\delta ^{*}=\delta /W$
. The dimensionless time
 $t^{*}$
is defined as
 $t^{*}=\textit{Ca}\sigma _{0}t/(\mu ^{R}W)$
. Other simulation parameters are set as:
 $\chi =1$
and
 $\psi _{b}=0$
.

Temporal evolution of droplet interface profiles (
 $\rho ^{N}=0$
) in the
 $x-z$
midplane (left panel) and
 $y-z$
midplane (right panel) when the flow is stopped (a) just before and (b) at
 $t_\textit{cr}^{*}$
. Along the arrow direction,
 $t^{*}$
increases with equal intervals.

Figures 6(a) and 6(b) show the temporal evolution of the droplet interface profiles (
 $\rho ^{N}=0$
) just before and at
 $t_\textit{cr}^{*}$
, with the left and right panels displaying the
 $x{-}z$
and
 $y{-}z$
midplane profiles, respectively. Along the arrow direction, the dimensionless time
 $t^{*}$
increases in equal intervals of 0.3516 (figure 6
a) and 0.0938 (figure 6
b). When the flow is stopped just before
 $t_\textit{cr}^{*}$
(figure 6
a), the lower interface of the droplet neck gradually moves towards the inlet, while the upper interface of the droplet neck initially contracts rapidly toward the inlet but then remains essentially unchanged (left panel). When the flow is stopped at
 $t_\textit{cr}^{*}$
(figure 6
b), the upper interface of the droplet neck gradually moves towards the inlet and eventually undergoes breakup (left panel). We also observe that the mass centre of the droplet neck migrates toward the microchannel centre as
 $t^{*}$
increases when the flow is stopped either before or at
 $t_\textit{cr}^{*}$
(right panel). A similar phenomenon has been previously reported by Chen et al. (Reference Chen, Xue and Hu2019). Due to both the asymmetric evolution of the droplet neck and the initial residual pressure field, the neck thickness exhibits non-monotonic variation during the stop-flow process (as indicated by the coloured line with symbols in figure 5).
Subsequently, we turn our attention to the rectangular T-junction microchannels. Hoang et al. (Reference Hoang, Portela, Kleijn, Kreutzer and Van Steijn2013) reported that the dimensionless critical neck thickness
 $\delta _\textit{cr}^{*}$
for spontaneous breakup of a surfactant-free droplet depends on the height-to-width ratio (
 $\chi =H/W$
) of the microchannel, which can be written as
 \begin{equation} \delta _\textit{cr}^{*}=\frac{\chi }{\chi +1}. \end{equation}
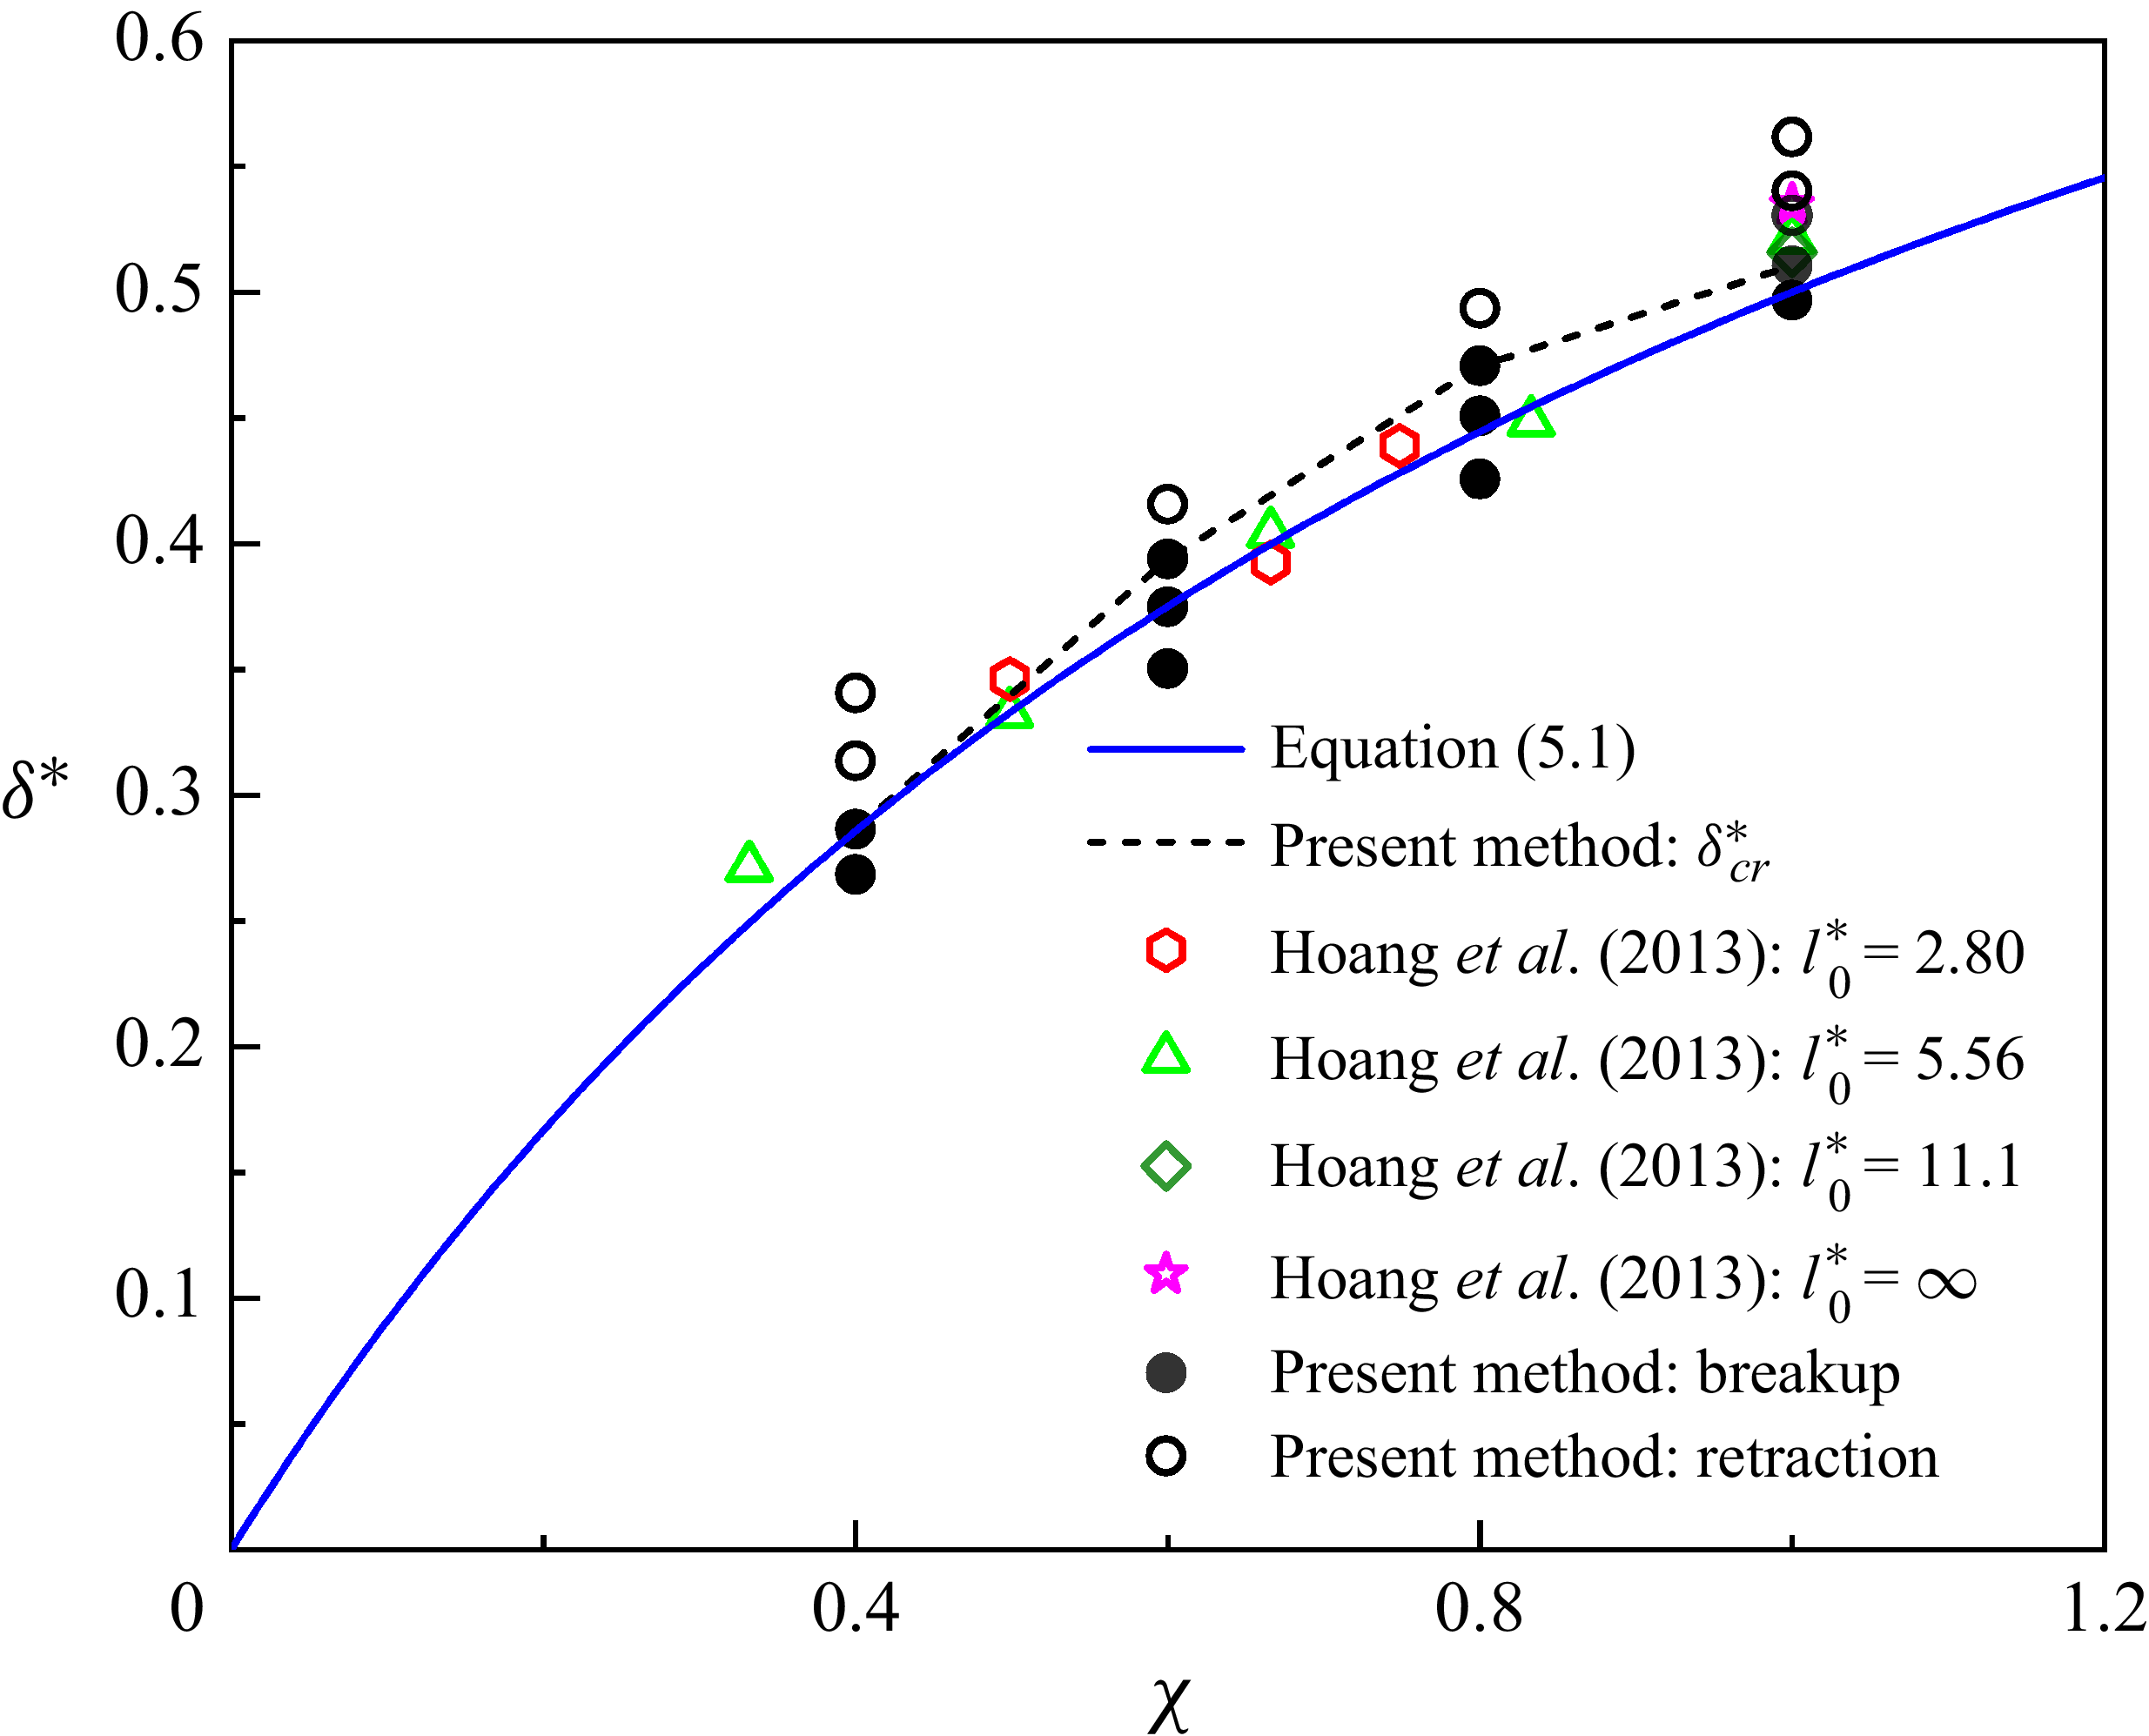
Figure 7 displays the variation of the dimensionless critical neck thickness
 $\delta _\textit{cr}^{*}$
for a surfactant-free droplet with the height-to-width ratio
 $\chi$
of the microfluidic T-junction. In this figure, the black dashed line, coloured symbols and blue solid line represent the dimensionless critical neck thickness obtained by the present method, Hoang et al. (Reference Hoang, Portela, Kleijn, Kreutzer and Van Steijn2013) and equation (5.1), respectively. It can be observed from this figure that our numerical results are consistent with those reported by Hoang et al. (Reference Hoang, Portela, Kleijn, Kreutzer and Van Steijn2013), and predictions form equation (5.1). We also observe that
 $\delta _\textit{cr}^{\mathrm{*}}$
monotonically increases with increasing
 $\chi$
. Note that equation (5.1) was previously proposed by van Steijn & Kleijn (Reference Van Steijn and Kleijn2009) to predict the rapid collapse in neck thickness during droplet generation in microfluidic T-junction. Based on the same relationship, Hoang et al. (Reference Hoang, Portela, Kleijn, Kreutzer and Van Steijn2013) suggested that the breakup mechanism was similar to that in droplet generation, i.e. backward-flow mechanism (van Steijn & Kleijn Reference Van Steijn and Kleijn2009). Although equation (5.1) can be used to predict the variation of
 $\delta _\textit{cr}^{\mathrm{*}}$
with
 $\chi$
, it lacks rigorous theoretical justification. Therefore, further investigation of the droplet breakup mechanism in microfluidic T-junction is necessary.
Variation of the dimensionless critical neck thickness
 $\delta _\textit{cr}^{*}$
with the height-to-width ratio
 $\chi$
for the surfactant-free system. The empty and solid circular symbols represent the numerical results obtained from stop-flow simulations for droplet neck retraction and spontaneous breakup, respectively. Other symbols correspond to the critical neck thicknesses reported by Hoang et al. (Reference Hoang, Portela, Kleijn, Kreutzer and Van Steijn2013) for various initial dimensionless droplet lengths
 $l_{0}^{*}$
and
 $\chi$
. The blue solid line represents the analytical solution predicted by (5.1), while the black dashed line denotes the critical neck thickness determined by the present method.

We investigate the mechanism of spontaneous neck breakup of the surfactant-free droplet by analysing the relationship between the capillary force and Laplace pressure difference. Figure 8 shows the temporal evolution of the capillary pressure
 $\sigma _{0}\kappa$
on the droplet interface (
 $\rho ^{N}=0$
) in the
 $y{-}z$
midplane versus the polar angle
 $\alpha$
for (i)
 $\chi =0.4$
, (ii)
 $\chi =0.6$
, (iii)
 $\chi =0.8$
and (iv)
 $\chi =1$
. The centroid angles of the triggering regions are
 $\alpha =1.4978$
, 2.9158, 2.8966 and 3.1042 for
 $\chi =0.4 , \chi =0.6 , \chi =0.8$
and
 $\chi =1$
, respectively. The local interface curvature
 $\kappa$
is calculated by
 $k=-(\boldsymbol{I}-\boldsymbol{n}\otimes \boldsymbol{n})\boldsymbol{\cdot }\boldsymbol{\nabla }\boldsymbol{\cdot }\boldsymbol{n}=-\boldsymbol{\nabla }\boldsymbol{\cdot }\boldsymbol{n}$
(3.4), which considers the influence of curvature in the third dimension. The mean interface curvature (
 $\kappa _{m}$
) is then calculated by
 $\kappa _{m}=\int _{0}^{2\pi }\kappa /(2\pi )\boldsymbol{\cdot }{\rm d}\alpha$
. Here,
 $\alpha$
is defined as the angle between the negative
 $z-\text{axis}$
and the radius vector from the droplet centre (see the inset of figure 8
a). In this figure, the time interval
 $\Delta t^{*}$
is set to 0.023. It should be noted that the negative values of
 $\sigma _{0}\kappa$
indicate an inward-directed capillary pressure (from the droplet exterior to its interior). The coloured dashed lines represent the mean capillary pressure
 $\sigma _{0}\kappa _{m}$
for each corresponding
 $t^{*}$
. Near the critical time
 $t_\textit{cr}^{*}$
, the Laplace pressure difference
 $\Delta p$
between the interior and exterior of the droplet acts outward to counteract the inward-directed collapse driven by
 $\sigma _{0}\kappa _{m}$
, where
 $\Delta p$
can be estimated as
 $-\sigma \kappa _{m}$
. As shown in the shaded regions, the values of
 $| \sigma _{0}\kappa |$
are lower than
 $| \sigma _{0}\kappa _{m}|$
when
 $t^{*}\lt t_\textit{cr}^{*}$
, but exceed
 $| \sigma _{0}\kappa _{m}|$
once
 $t^{*}\geq t_\textit{cr}^{*}$
. This indicates that the capillary pressure in the shaded region (
 $| \sigma _{0}\kappa _{m}|$
) is lower than
 $\Delta p$
when
 $t^{*}\lt t_\textit{cr}^{*}$
, but exceeds that of
 $\Delta p$
when
 $t^{*}\geq t_\textit{cr}^{*}$
. It is known that capillary pressure promotes droplet neck contraction, while the Laplace pressure difference opposes contraction. Thus, we propose that droplet neck collapse is induced when the local capillary pressure in the shaded regions surpasses the Laplace pressure difference. These shaded regions are defined as triggering regions, where the inward-promoting capillary pressure surpasses the outward-resisting Laplace pressure difference. This cross-over marks a critical transition in the local force balance that initiates the neck collapse.
Capillary pressure
 $\sigma _{0}\kappa$
as a function of polar angle
 $\alpha$
in the
 $y{-}z$
midplane at different dimensionless times (
 $t^{*}$
) for (a)
 $\chi =0.4$
, (b)
 $\chi =0.6$
, (c)
 $\chi =0.8$
and (d)
 $\chi =1$
, respectively. The coloured dashed lines represent the mean capillary pressure
 $\sigma _{0}\kappa _{m}$
for each corresponding
 $t^{*}$
.

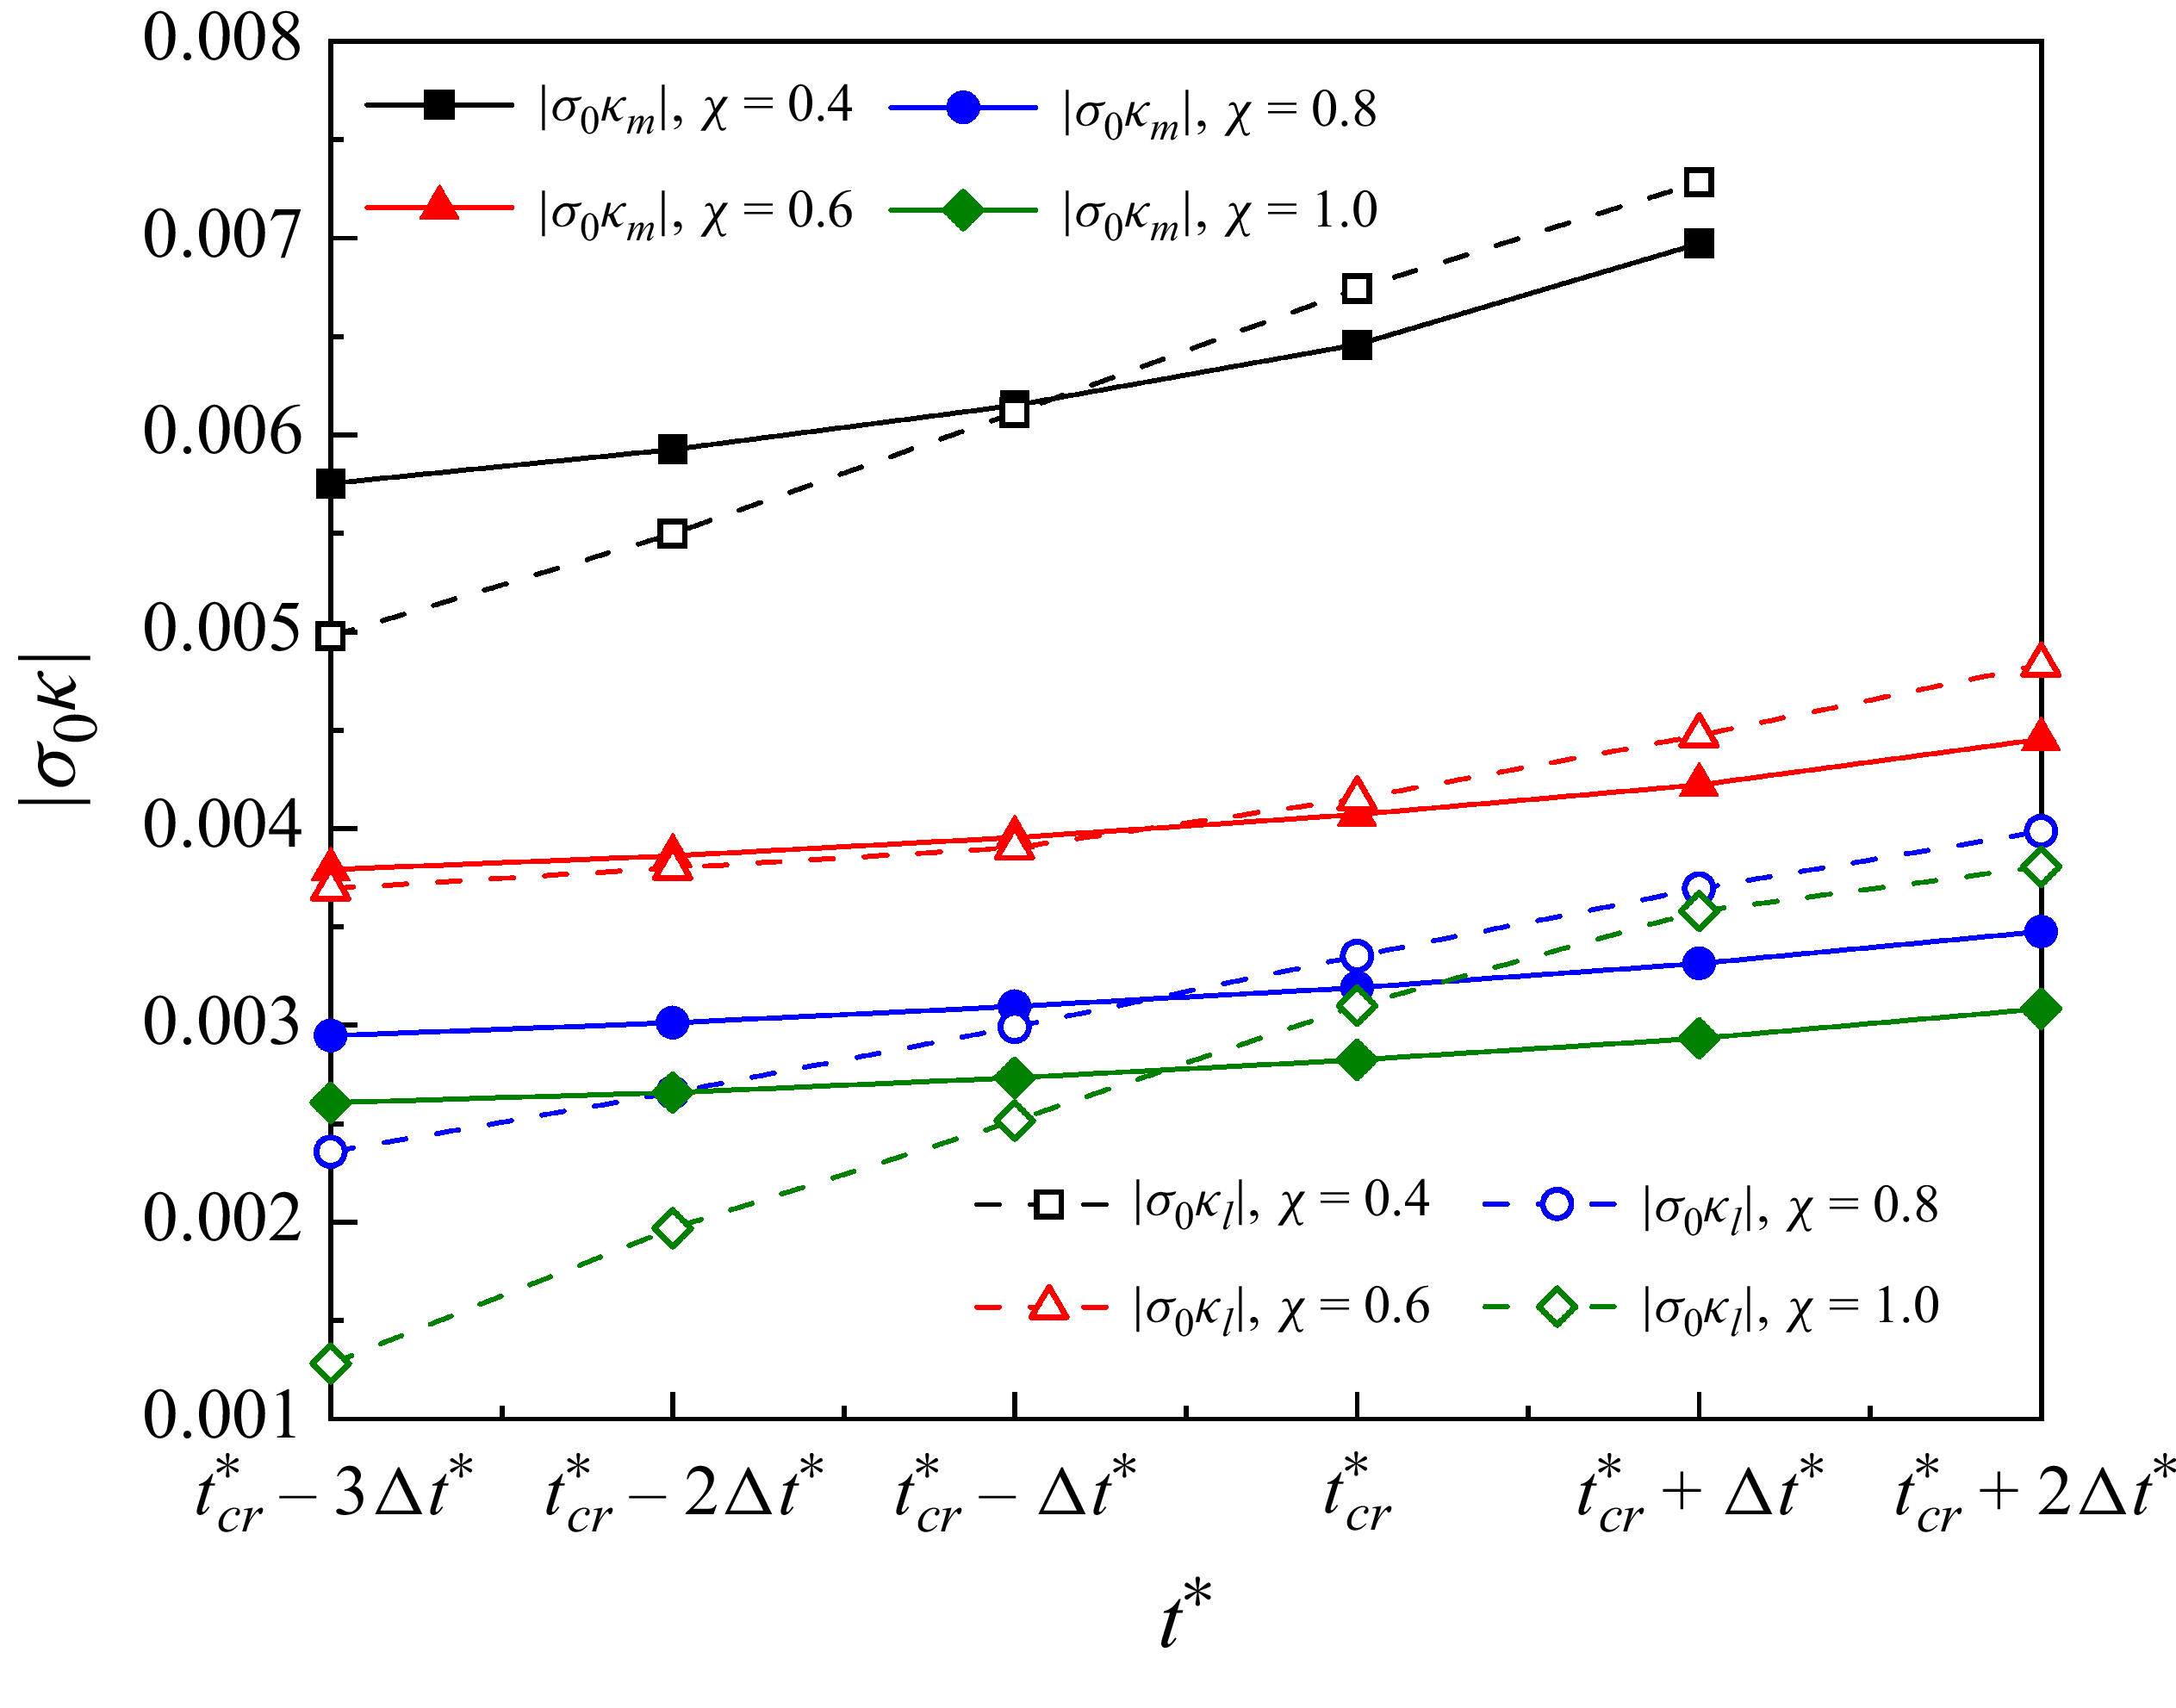
To verify that the droplet neck collapse occurs in these triggering regions (as shown in figure 8), figure 9 examines the temporal evolution of capillary pressures. Specifically, it compares the absolute values of the mean capillary pressure
 $|\sigma _{0}\kappa _{m}|$
of the droplet neck and the local capillary pressure
 $|\sigma _{0}\kappa _{l}|$
at the centroid of the triggering region across varying microchannel height-to-width ratios (
 $\chi$
). It can be observed that the values of
 $| \sigma _{0}\kappa _{m}|$
and
 $| \sigma _{0}\kappa _{l}|$
both increase with increasing
 $t^{*}$
. This trend stems from the neck constriction process, where the reduction in neck thickness leads to corresponding decreases in both the absolute values of the local interfacial curvature
 $|\kappa _{l}|$
in the triggering region and the mean curvature
 $|\kappa _{m}|$
of the neck. In all
 $\chi$
cases considered, the values of
 $| \sigma \kappa _{l}|$
are less than those of
 $| \sigma \kappa _{m}|$
when
 $t^{*}\lt t_\textit{cr}^{*}$
, but exceed those of
 $| \sigma \kappa _{m}|$
once
 $t^{*}\geq t_\textit{cr}^{*}$
. When
 $t^{*}\lt t_\textit{cr}^{*}$
, the necking stage is quasi-stable (Garstecki, Stone & Whitesides Reference Garstecki, Stone and Whitesides2005; Chen et al. Reference Chen, Xue and Hu2019), and the Laplace pressure difference
 $\Delta p$
between the inside and outside of the droplet neck can be estimated as
 $|\sigma \kappa _{m}|$
. However, when
 $t^{*}\geq t_\textit{cr}^{*}$
, the necking stage becomes unstable. The rate of neck contraction increases with increasing
 $t^{*}$
(figure 5), causing
 $\Delta p$
to be overestimated by
 $|\sigma \kappa _{m}|$
, i.e.
 $\Delta p\lt |\sigma \kappa _{m}|$
. This indicates that the Laplace pressure difference
 $\Delta p$
is larger than the local capillary pressure
 $|\sigma \kappa _{l}|$
when
 $t^{*}\lt t_\textit{cr}^{*}$
, but
 $\Delta p$
becomes less than
 $|\sigma \kappa _{l}|$
after
 $t^{*}\geq t_\textit{cr}^{*}$
. This suggests that the droplet neck will collapse once the local capillary pressure at the triggering region exceeds
 $\Delta p$
.
The absolute values of the mean capillary pressure
 $|\sigma _{0}\kappa _{m}|$
inside the droplet neck and the local capillary pressure
 $|\sigma _{0}\kappa _{l}|$
at the centroid of the triggering region as a function of the dimensionless time
 $t^{*}$
across different height-to-width ratios (
 $\chi$
) in the
 $y{-}z$
midplane. The solid symbols connected by solid lines represent
 $\sigma _{0}\kappa _{m}$
, while the empty symbols connected by dashed lines represent
 $\sigma _{0}\kappa _{l}$
.

(a) Variation of the absolute value of the local interfacial curvature
 $| \kappa |$
with the horizontal distance
 $D$
from the centreline of the vertical channel, and (b) temporal evolution of the dimensionless neck thicknesses from the side view
 $\delta _{s}^{*}$
(measured at the red circle). Other simulation parameters are set as:
 $\chi =1$
and
 $\psi _{b}=0$
.

According to Hoang et al. (Reference Hoang, Portela, Kleijn, Kreutzer and Van Steijn2013), the spontaneous neck breakup occurs when the neck curvature exceeds the curvature in other interfacial regions on the droplet bottom interface. The work of Chen & Deng showed that the spontaneous neck breakup occurs when the pressure balance between the capillary pressure at the neck centre and the internal neck pressure. We perform comparison of the two criteria using our simulation data. Figure 10(a) shows the distribution of the absolute value of the local interfacial curvature
 $| \kappa |$
along the horizontal distance
 $D$
from the vertical channel centreline near the dimensionless critical breakup time
 $t_\textit{cr}^{*}=0.9680$
. As shown in this figure, the neck curvature (
 $D=0$
) is larger than the curvature in other interfacial regions when
 $t^{*}\geq 0.9914$
, which is later than
 $t_\textit{cr}^{*}$
. Figure 10(b) shows the temporal evolution of the dimensionless neck thicknesses from the side view
 $\delta _{s}^{*}$
, measured at the location marked by the red circle. In their paper, the internal pressure is calculated based on the curvature radius (
 $\delta _{g}^{*}/2$
) of the circular arcs in the cross-section of the columnar region (marked by the white circle), while the capillary pressure is calculated based on the neck curvature radius (
 $\delta _{s}^{*}/2$
) from the side view (marked by the red circle). It can be observed that the values of
 $\delta _{s}^{*}$
are larger than
 $\delta _{g}^{*}$
, suggesting the internal pressure is not balanced by the capillary pressure. This discrepancy may arise from the specific locations chosen for calculating the two pressures. The results show that our approach offers greater accuracy, as evidenced by the comparison between figures 8 and 10(b).
Figures 11(a) and 11(b) show the droplet shapes along with the corresponding cross-sectional profiles in the
 $x{-}z$
and
 $y{-}z$
midplanes, captured at the critical dimensionless time
 $t_\textit{cr}^{*}$
for four microchannel height-to-width ratios (
 $\chi$
). Along the arrow direction, the values of
 $\chi$
are 0.4, 0.6, 0.8 and 1.0, respectively. Under the constant inlet velocity condition, the droplet morphology becomes asymmetric (figure 11
a). As
 $\chi$
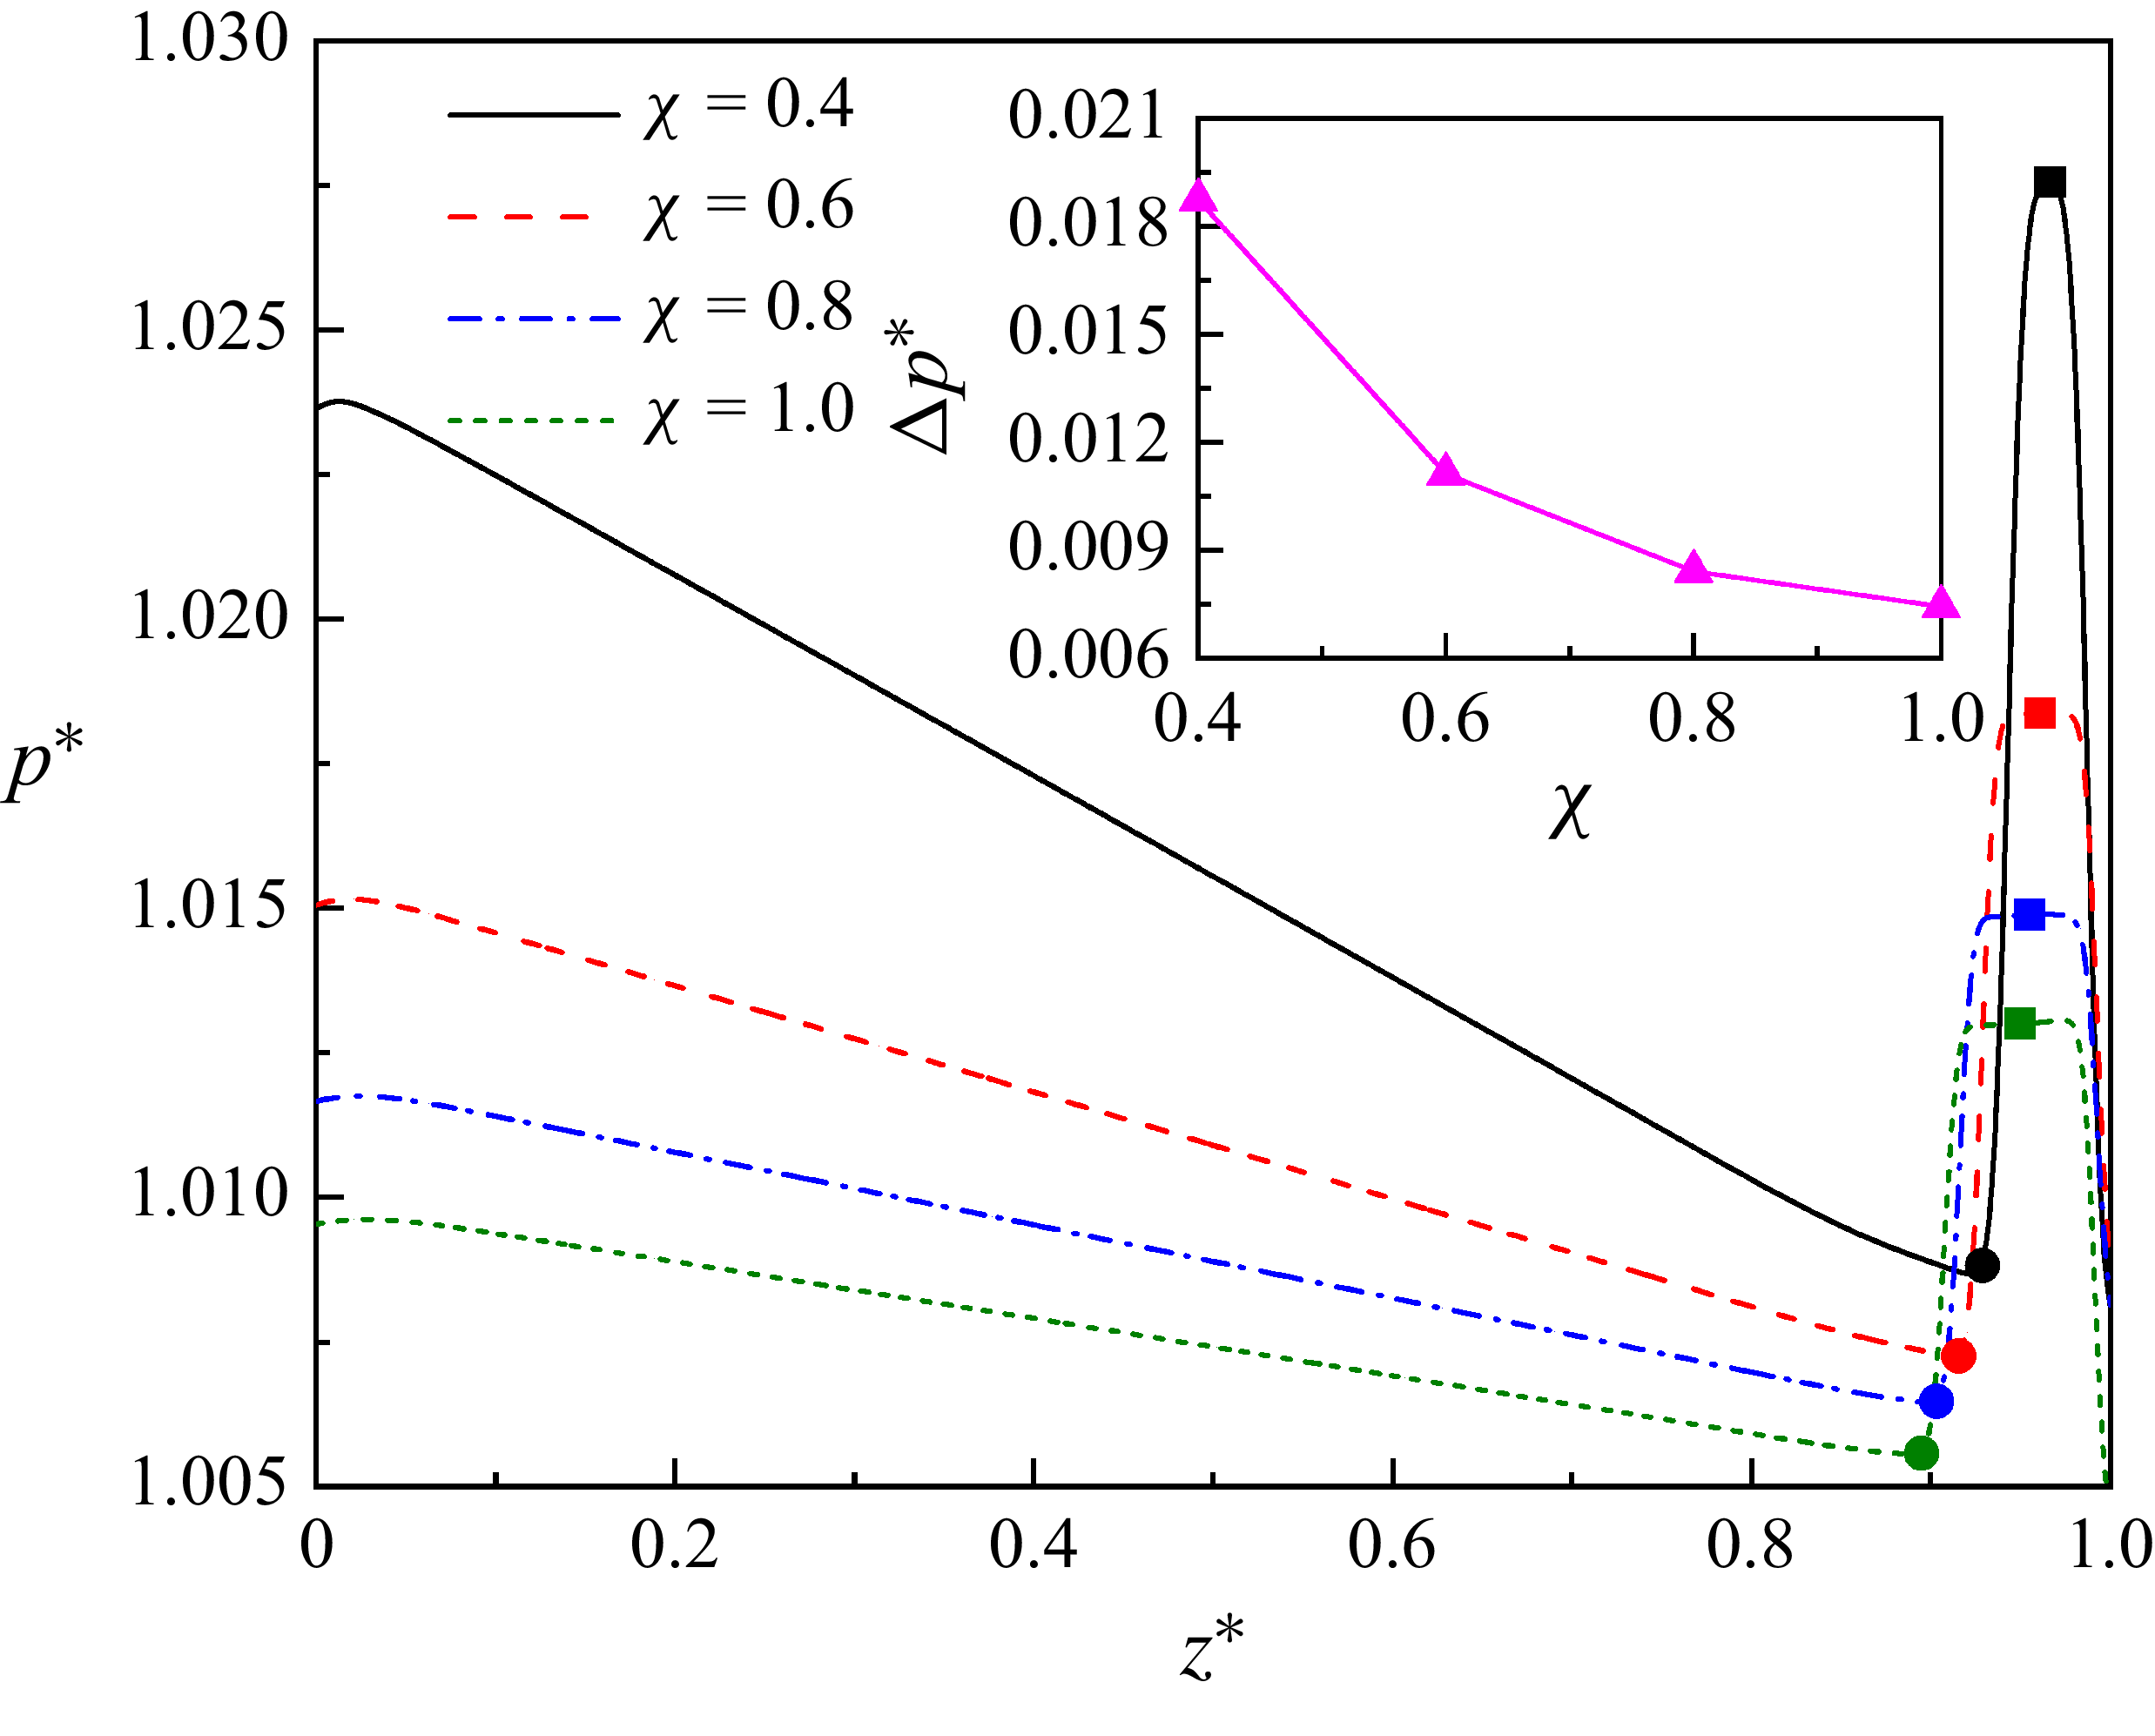
decreases, the droplet experiences greater restriction from the microchannel walls, resulting in increased pressure inside the droplet (see figure 12) and consequently an enhanced Laplace pressure difference between the inside and outside of the droplet. To balance the enhanced Laplace pressure difference, a higher capillary pressure is needed. Since the capillary pressure is inversely proportional to the curvature radius, the mean radius of the droplet neck required for spontaneous droplet breakup increases with increasing
 $\chi$
(figure 11
b). A quantitative analysis is provided in figure 7.
(a) Droplet shapes at the critical dimensionless time
 $t_\textit{cr}^{*}$
for different height-to-width ratios (
 $\chi$
) of the microfluidic T-junction. (b) Corresponding droplet interface profiles (matching panel a), shown in the
 $x{-}z$
midplane (left panel) and
 $y{-}z$
midplane (right panel). In the right subplot, coloured curves represent cross-sectional droplet shapes for different
 $\chi$
values, with the matching straight lines representing the microchannel walls at each corresponding value of
 $\chi$
.

Dimensionless pressure (
 $p^{*}=p/p_{0}$
) distribution along the centreline of the vertical channel for various height-to-width ratios (
 $\chi$
) at the critical dimensionless time
 $t_\textit{cr}^{*}$
in the clean system. Square and circular symbols denote the dimensionless internal (measured at the neck centre) and external (evaluated three lattice grids below the neck) droplet pressures, respectively. The inset shows the variation of the dimensionless pressure difference
 $\Delta p^{*}$
between the internal and external of the droplet with
 $\chi$
. Other parameters are:
 $\psi _{b}=0 , \textit{Ca}=0.01 , \textit{Re}=0.0234$
and
 ${l_{0}}^{*}=3.5$
.

Figure 12 presents the dimensionless pressure (
 $p^{*}=p/p_{0}$
) along the centreline of the vertical microchannel for different height-to-width ratios (
 $\chi$
) at the critical dimensionless time
 $t_\textit{cr}^{*}$
in the clean system. Here,
 $p_{0}$
denotes the initial pressure, and
 $z^{*}=0$
and
 $z^{*}=1$
correspond to the positions at the bottom inlet and the top wall, respectively. The square and circular symbols mark the dimensionless internal droplet pressure (measured at the neck centre) and the dimensionless external droplet pressure (measured three lattice grids below the bottom interface of the neck), respectively. As clearly shown in the figure, the dimensionless internal droplet pressure increases as the height-to-width ratio
 $\chi$
decreases. The inset further plots the dimensionless pressure difference
 $\Delta p^{*}$
as a function of
 $\chi$
, where
 $\Delta p^{*}$
is defined as the dimensionless pressure difference between the internal and external of the droplet neck. It is evident that
 $\Delta p^{*}$
increases monotonically as
 $\chi$
decreases, confirming that the Laplace pressure difference indeed grows with a reducing height-to-width ratio.
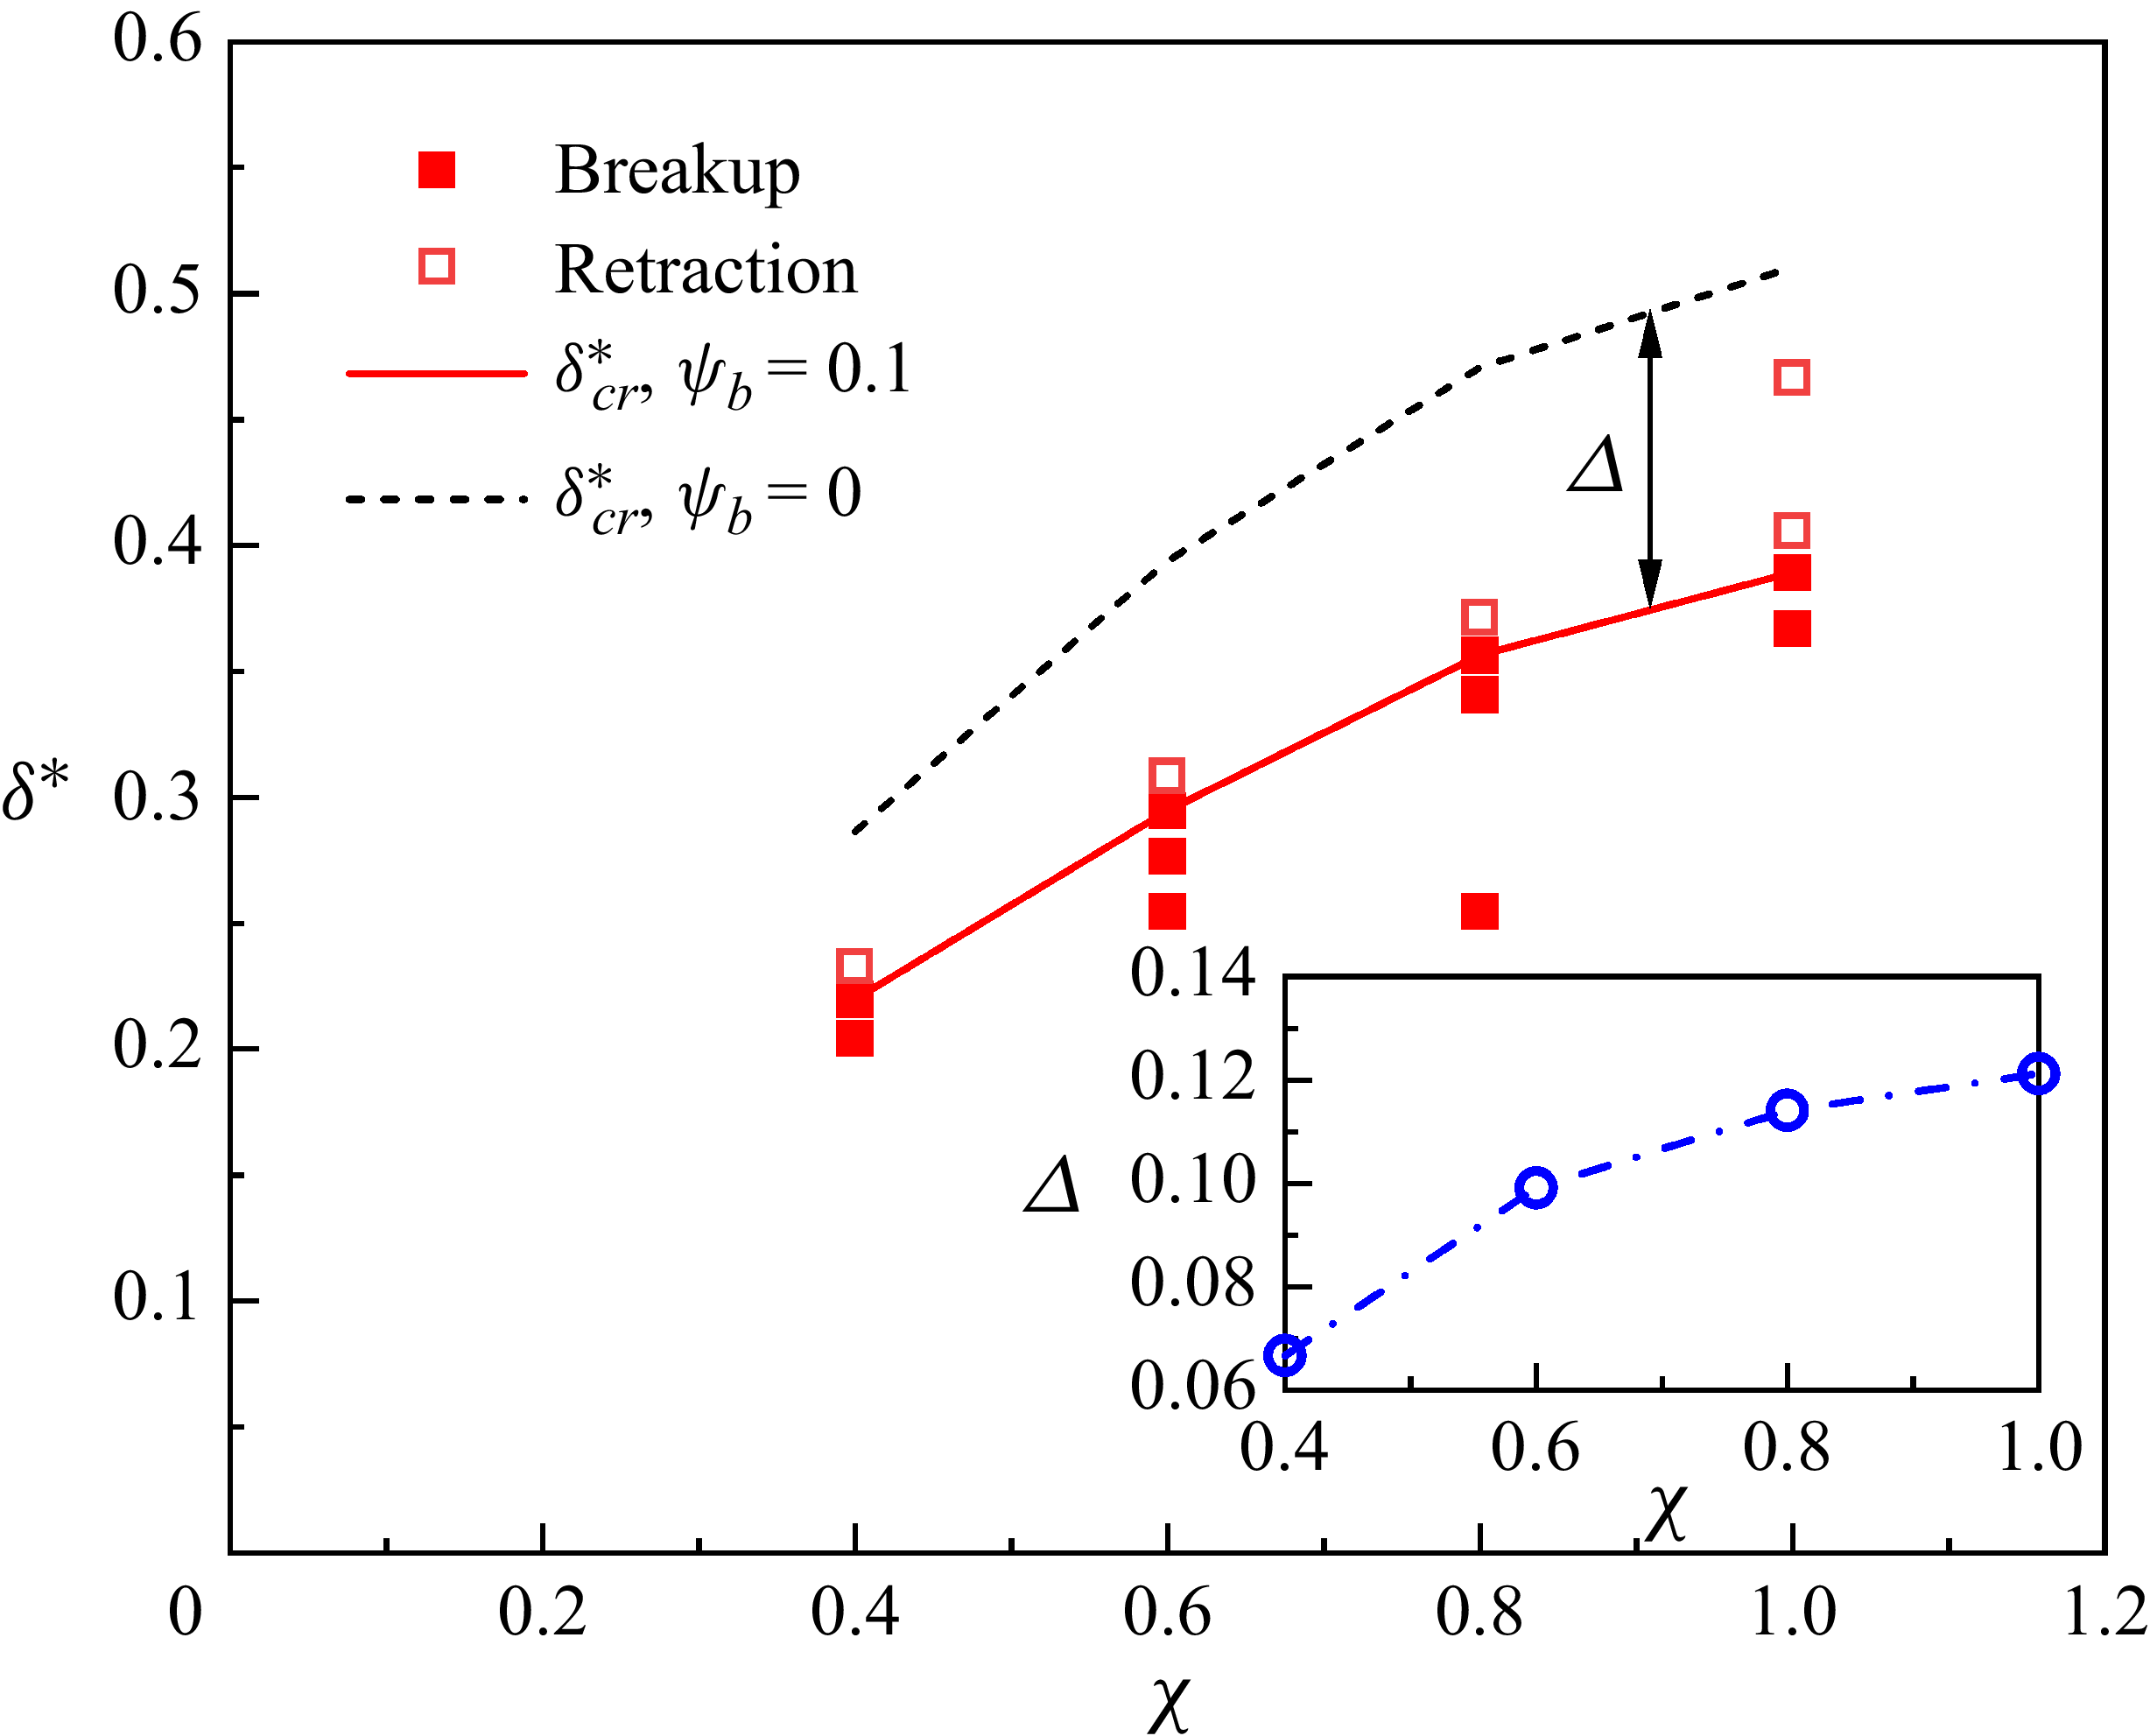
Figure 13 displays the dimensionless critical neck thickness
 $\delta _\textit{cr}^{*}$
as a function of the microchannel height-to-width ratio
 $\chi$
for both surfactant-free (
 $\psi _{b}=0$
) and surfactant-laden (
 $\psi _{b}=0.1$
) systems, where the solid and empty symbols represent neck breakup and retraction, respectively. The inset shows the variation of the difference in
 $\delta _\textit{cr}^{*}$
between the two systems (
 $\varDelta$
) with
 $\chi$
. As can be observed from this figure, the addition of surfactants leads to a reduction in
 $\delta _\textit{cr}^{*}$
. The capillary pressure
 $|\sigma (\psi )\kappa |$
, which drives the contraction of the droplet neck, is proportional to the interfacial tension
 $[\sigma (\psi )]$
. The addition of surfactants reduces
 $\sigma (\psi )$
, leading to a reduction in the capillary pressure
 $|\sigma (\psi )\kappa |$
. Therefore, a higher absolute value of the interfacial curvature (i.e. a smaller neck radius) is needed for spontaneous breakup of the droplet neck. Additionally, as
 $\chi$
increases,
 $\varDelta$
increases (see the inset of figure 13), suggesting that the effect of the surfactants is more pronounced. We first attempt to explain this phenomenon by examining the adsorption of surfactants at the droplet interface in cases with different
 $\chi$
values. Following the previous work (Badalassi, Ceniceros & Banerjee Reference Badalassi, Ceniceros and Banerjee2003), the interface region is defined as the distance from
 $\rho ^{N}=-0.9$
to 0.9, where
 $\rho ^{N}$
is the index function (see (3.4)). Note that such an interface thickness contains 98.5 % of the interfacial stress. Thus, the average dimensionless surfactant concentration
 $\psi _{av}$
in the
 $y-z$
midplane, where
 $\rho ^{N}$
is between −0.9 and 0.9 (see figure 16), is recorded for different
 $\chi$
cases at the critical dimensionless time
 $t_\textit{cr}^{*}$
. The values of
 $\psi _{av}$
are 0.4748, 0.4884, 0.4859 and 0.4756 for
 $\chi =0.4$
, 0.6, 0.8 and 1, respectively. The nearly identical amounts of adsorbed surfactants at the droplet interface indicate that the observed growth of
 $\varDelta$
with increasing
 $\chi$
must be caused by another factor. The capillary pressure
 $|\sigma (\psi )\kappa |$
is proportional to both the interfacial tension
 $\sigma (\psi )$
and absolute value of the curvature
 $|\kappa |$
. As
 $\chi$
increases, the critical neck thickness increases, leading to a reduction in
 $|\kappa |$
. This means that the contribution of the curvature to the capillary force is reduced, while that of the interfacial tension is enhanced. Although surfactants achieve comparable interfacial tension reductions (with essentially identical
 $\psi _{av}$
values) across all
 $\chi$
cases considered, their efficacy becomes more pronounced at higher
 $\chi$
values (figure 14).
Variation of the dimensionless critical neck thickness
 $\delta _\textit{cr}^{*}$
with the height-to-width ratio
 $\chi$
for the surfactant-free (black dashed line) and surfactant-laden (red solid line) systems. The empty and solid square symbols represent the numerical results obtained from the stop-flow simulations for surfactant-laden droplet neck retraction and breakup, respectively. The red solid line corresponds to the critical values for the surfactant-laden system. The critical values for the surfactant-free system, as depicted by the black dashed lines in figure 7, are also plotted for comparison. The inset shows the variation of the difference in
 $\delta _\textit{cr}^{*}$
between the two systems with
 $\chi$
.

Local interfacial curvature
 $\kappa$
as a function of polar angle
 $\alpha$
in the
 $y{-}z$
midplane at different dimensionless times (
 $t^{*}$
) for (a) height-to-width ratio
 $\chi =0.4$
, (b)
 $\chi =0.6$
, (c)
 $\chi =0.8$
and (d)
 $\chi =1$
, respectively. The coloured dashed lines represent the mean curvature
 $\kappa _{m}$
for each corresponding
 $t^{*}$
. Other parameters are taken as:
 $\textit{Ca}=0.01$
and
 $\psi _{b}=0.1$
.

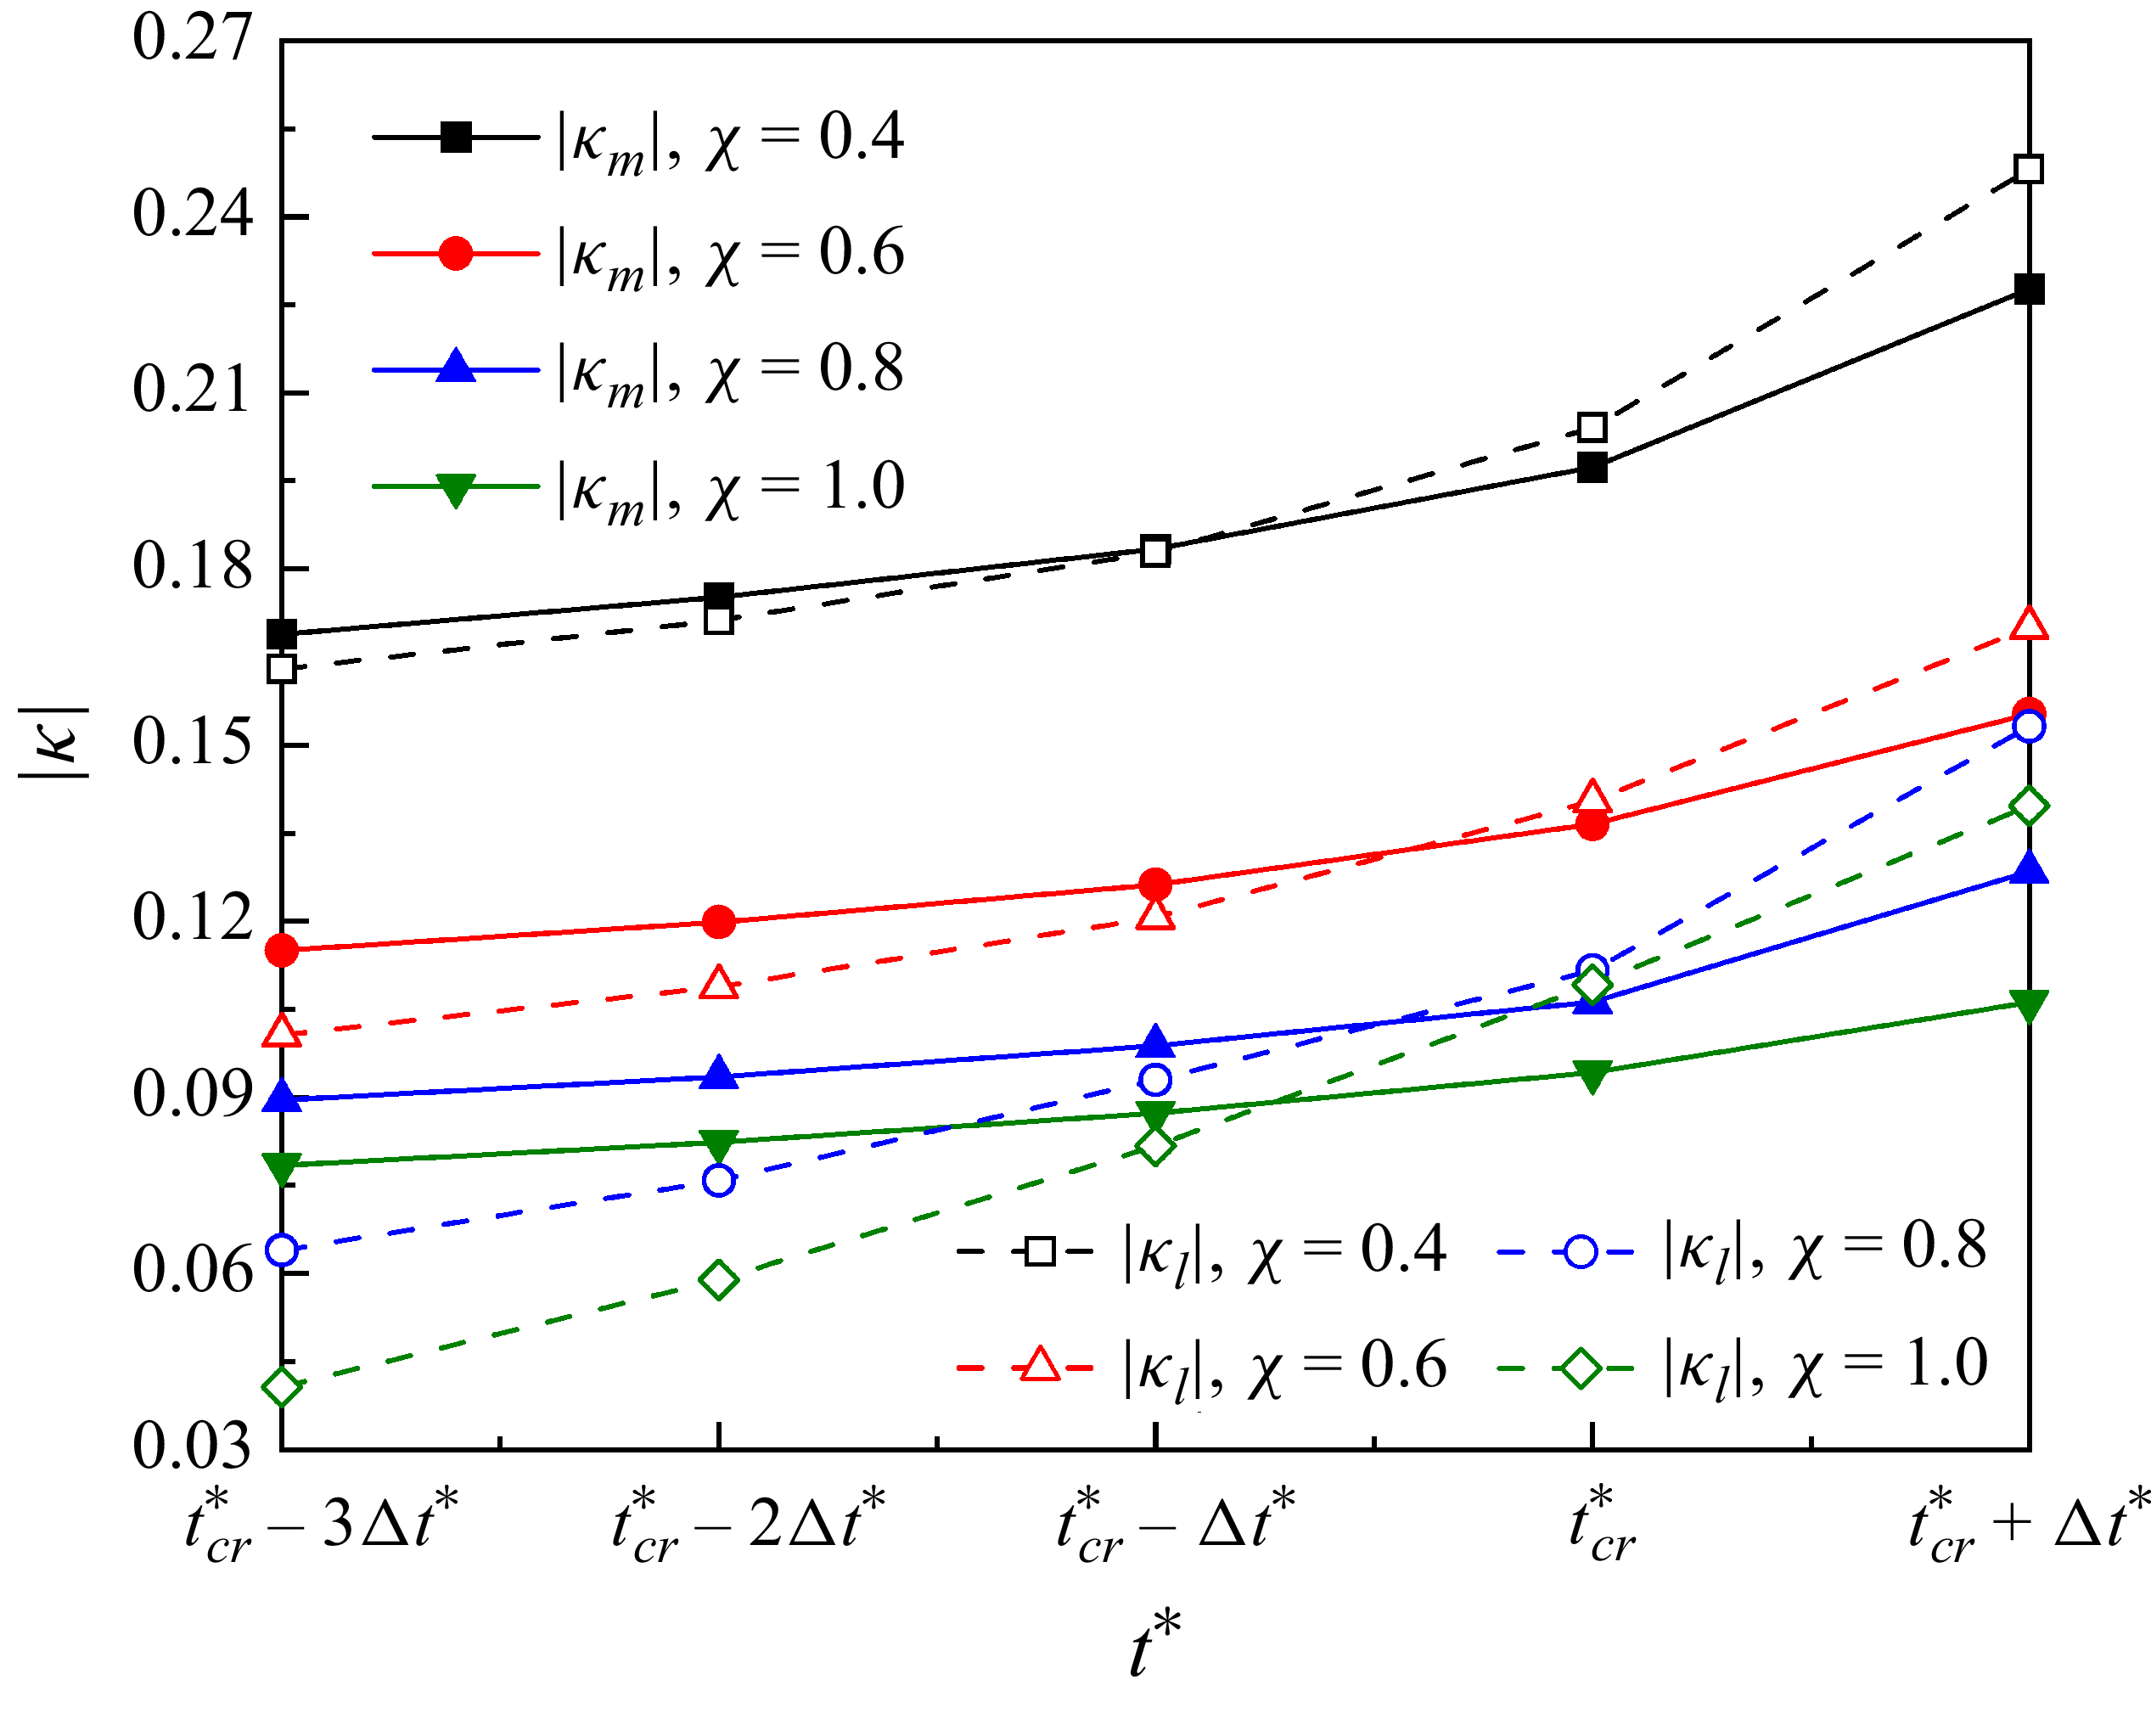
Temporal evolution of the absolute mean interface curvature
 $|\kappa _{m}|$
in the droplet neck and the local interface curvature
 $|\kappa _{l}|$
at the centroid of the triggering region across different height-to-width ratios (
 $\chi$
) in the
 $y{-}z$
midplane. Solid symbols connected by solid lines represent
 $|\kappa _{m}|$
, while empty symbols connected by dashed lines denote
 $|\kappa _{l}|$
. Other parameters are taken as:
 $\textit{Ca}=0.01$
and
 $\psi _{b}=0.1$
.

Distribution of the dimensionless surfactant concentration
 $\psi$
in the
 $y{-}z$
midplane at the critical dimensionless time
 $t_\textit{cr}^{*}$
for different height-to-width ratio of (a)
 $\chi =0.4$
and (b)
 $\chi =1$
, respectively.

In the surfactant-laden system, the local capillary pressure on the droplet interface (
 $\rho ^{N}=0$
) is calculated by
 $\sigma (\psi )\kappa$
, and the Laplace pressure difference is estimated as
 $-\sigma (\psi )\kappa _{m}$
. Since both terms depend on the interfacial tension
 $\sigma (\psi )$
, the choice of an appropriate
 $\sigma (\psi )$
is critical. The surfactant concentration distribution is non-uniform along the interface normal direction (see figure 16 as an example), implying a corresponding non-uniformity in
 $\sigma (\psi )$
. Therefore, how to appropriately select
 $\sigma (\psi )$
remains challenging. However, we note that the surfactant concentration is nearly uniform along the tangential direction of the droplet interface (figure 16), owing to the complete blockage of the channel by the droplet. This allows us to approximate the relative magnitudes of the local capillary pressure
 $\sigma (\psi )\kappa$
and Laplace pressure difference
 $-\sigma (\psi )\kappa _{m}$
by comparing the absolute values of the local curvature
 $| \kappa |$
and the mean curvature
 $| \kappa _{m}|$
.
Figure 15 shows the distribution of the local interfacial curvature
 $\kappa$
on droplet interface (
 $\rho ^{N}=0$
) in the
 $y-z$
midplane along the polar angle
 $\alpha$
at different height-to-width values (
 $\chi$
) for (i)
 $0.4$
, (ii)
 $0.6$
, (iii)
 $0.8$
and (iv)
 $1$
, respectively. Other parameters are taken as:
 $\textit{Ca}=0.01 , \psi _{b}=0.1$
and
 $\Delta t^{*}=0.023$
. The coloured dashed lines represent the mean interfacial curvature
 $\kappa _{m}$
at corresponding times. In these triggering regions (shaded areas), we observe that the values of
 $| \kappa |$
are lower than
 $| \kappa _{m}|$
when
 $t^{*}\lt t_\textit{cr}^{*}$
, but exceed
 $| \kappa _{m}|$
once
 $t^{*}\geq t_\textit{cr}^{*}$
. This indicates that the local capillary pressure suppresses Laplace pressure difference beyond
 $t_\textit{cr}^{*}$
, triggering neck collapse. This finding is consistent with the behaviour in the surfactant-free cases (figure 9).
Figure 16 illustrates how the dimensionless surfactant concentration varies across the
 $y-z$
midplane at the critical dimensionless time
 $t_\textit{cr}^{*}$
for varying height-to-width ratios of (i)
 $\chi =0.4$
and (ii)
 $\chi =1$
, respectively. The two black curved lines represent the index function
 $\rho ^{N}=-0.9$
and 0.9, respectively. As can be observed from this figure, the region with high surfactant concentration is within the range of
 $-0.9\leq \rho ^{N}\leq 0.9$
. Additionally, the surfactant concentration non-uniformly varies in the normal direction of the droplet interface, and reaches its maximum value near the contour line of
 $\rho ^{N}=0$
.
5.1.2. Effect of surfactant parameters
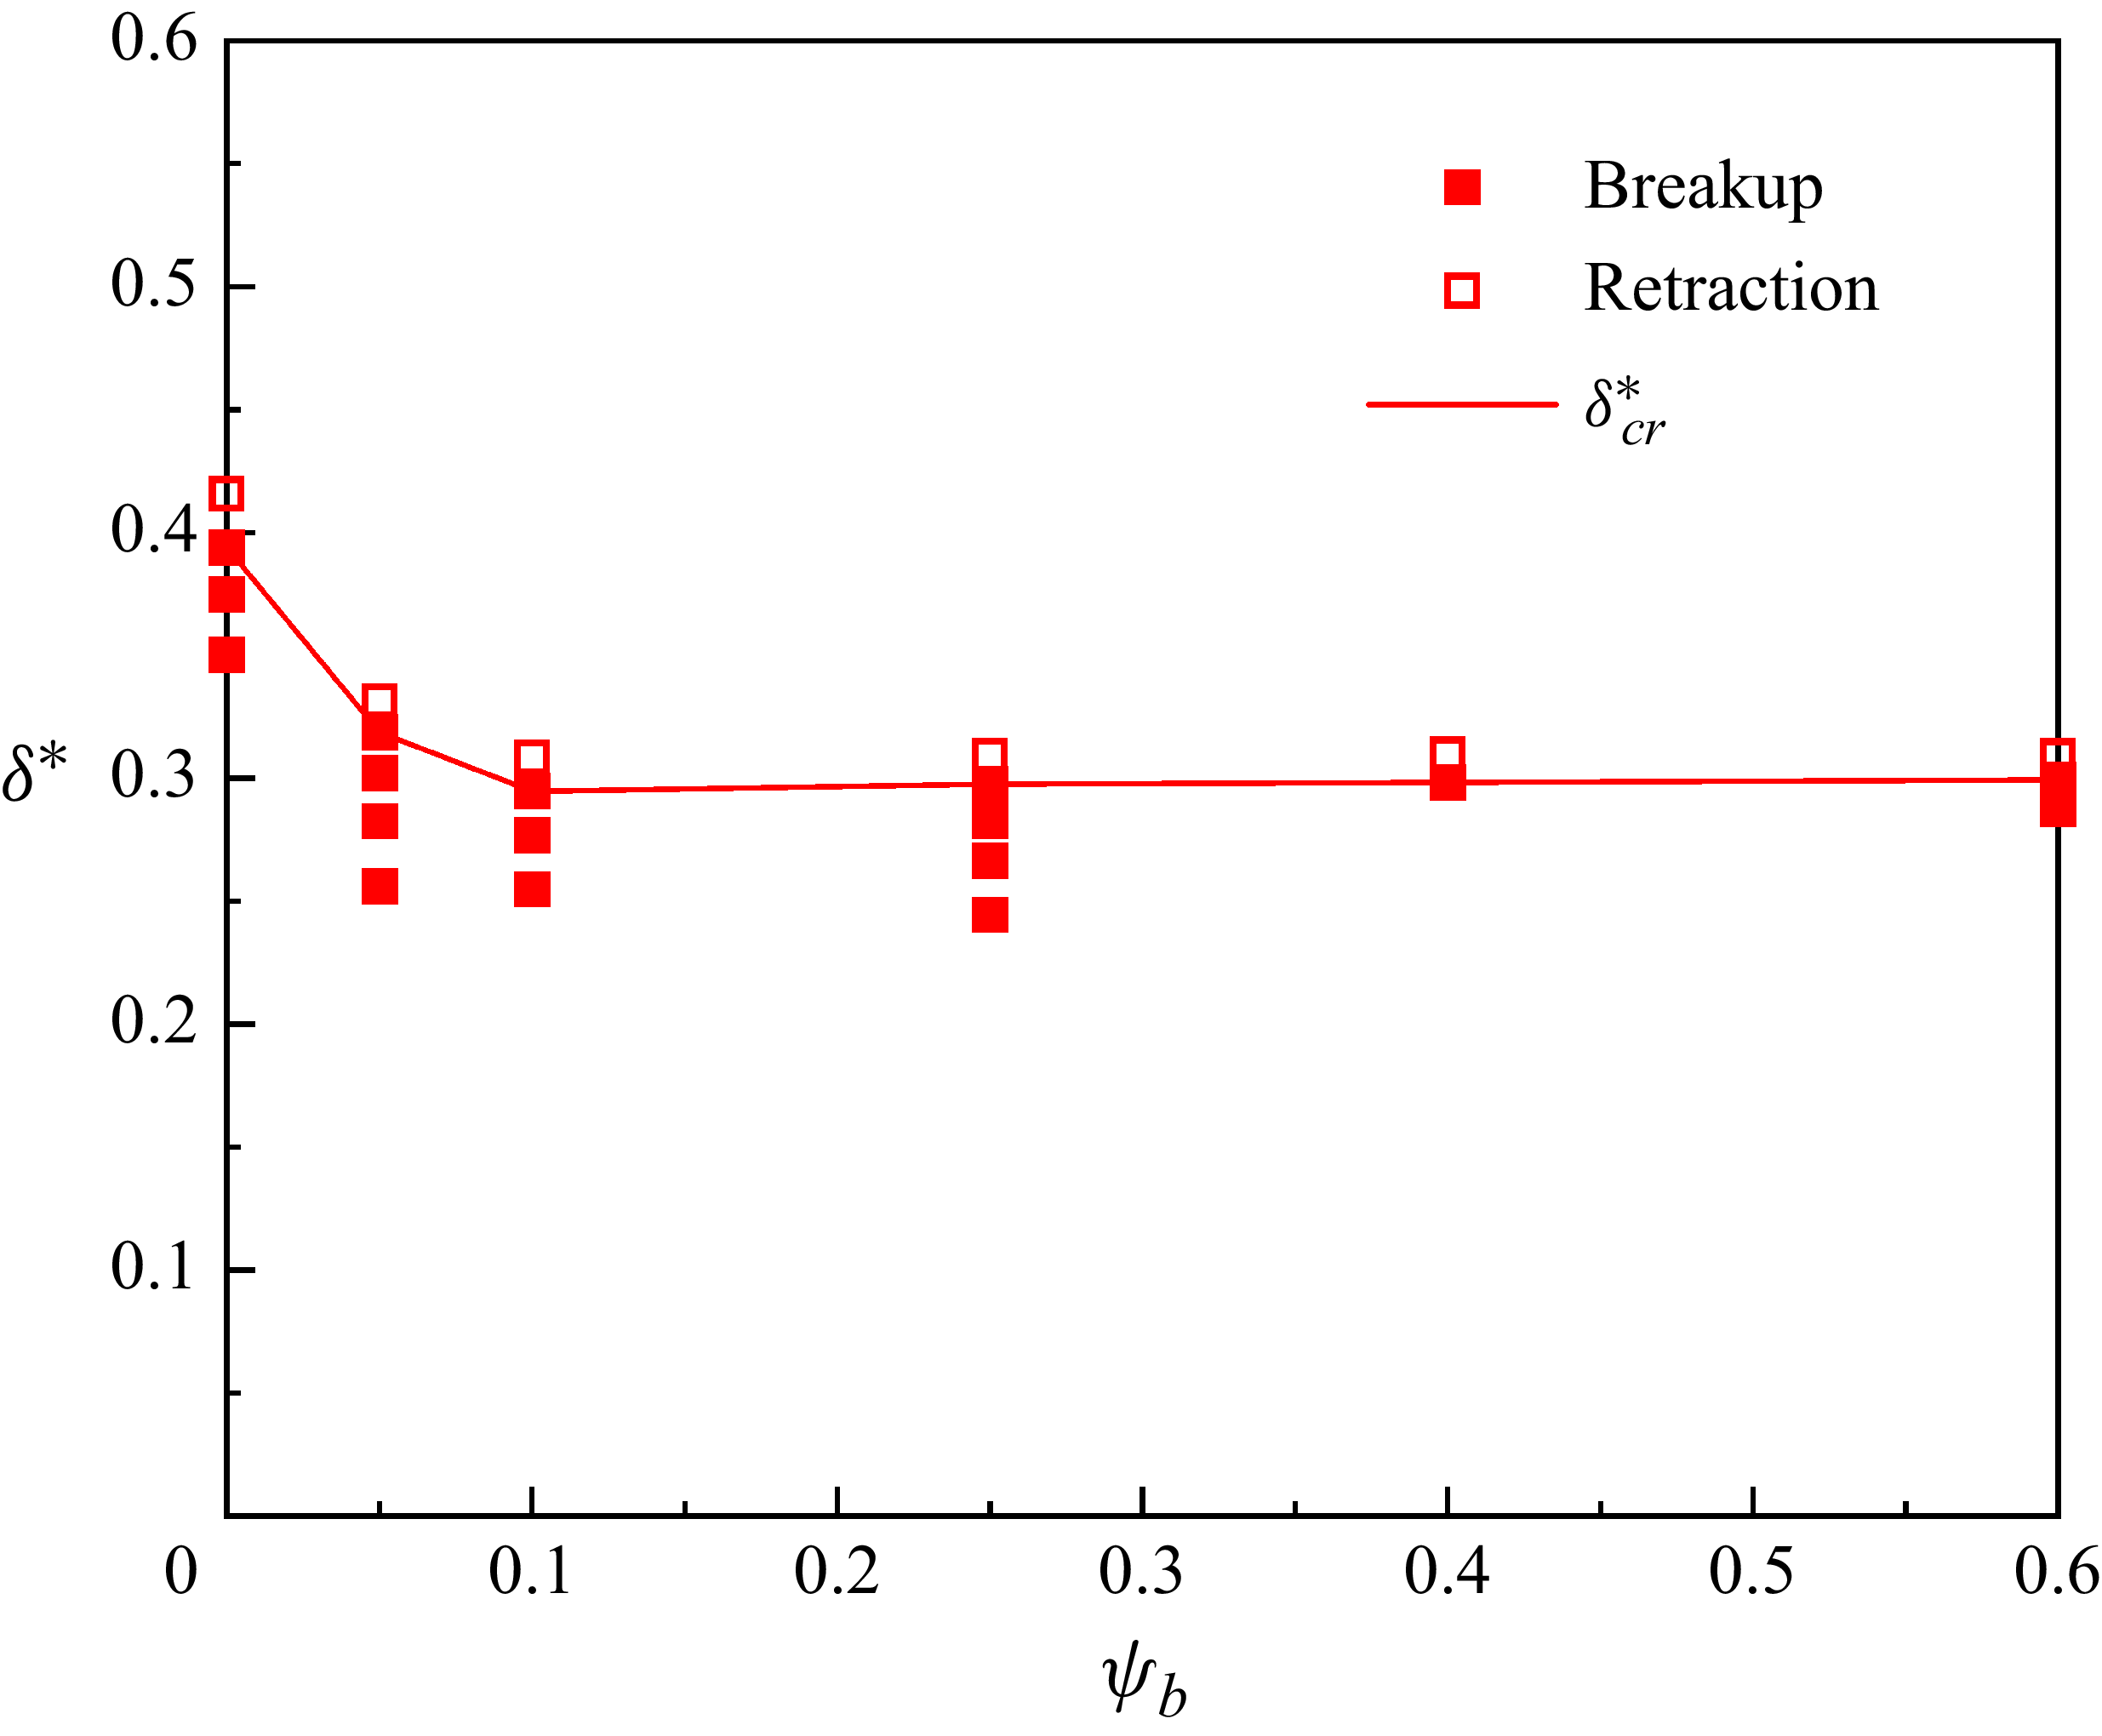
Although surfactants can regulate the critical neck thickness for spontaneous droplet breakup (figure 13), their toxicity (Badmus et al. Reference Badmus, Amusa, Oyehan and Saleh2021; Zhang et al. Reference Zhang, Gao, Peng, Qi, Liu and Jing2025) necessitates the determination of an optimal concentration. Figure 17 shows the evolution of the dimensionless critical neck thickness
 $\delta _\textit{cr}^{*}$
with the dimensionless bulk surfactant concentration
 $\psi _{b}$
, where
 $\psi _{b}$
varies from 0.05 to 0.6. As
 $\psi _{b}$
increases,
 $\delta _\textit{cr}^{*}$
decreases rapidly at first and then remains basically unchanged. These phenomena can be explained by the surfactant adsorption at the droplet interface (i.e.
 $\rho ^{N}$
is between −0.9 and 0.9). The average dimensionless surfactant concentration
 $\psi _{av}$
in the
 $y{-}z$
midplane is recorded for different values of
 $\psi _{b}$
at the critical dimensionless time
 $t_\textit{cr}^{*}$
. The values of
 $\psi _{av}$
are 0.3204, 0.4884, 0.7324, 0.8440 and 0.9206 for
 $\psi _{b}=0.05$
, 0.1, 0.25, 0.4 and 0.6, respectively. Additionally, the CMC is
 $1-\exp [-2/(3E_{0})]=0.7364$
for the given elasticity number of
 $E_{0}=0.5$
. As
 $\psi _{b}$
increases from 0 to 0.1,
 $\psi _{av}$
increases, indicating that the interfacial tension
 $\sigma (\psi )$
decreases. To achieve the capillary pressure
 $|\sigma (\psi )\kappa |$
required for spontaneous breakup, a higher absolute value of the curvature
 $|\kappa |$
is needed, which corresponds to a smaller neck thickness. When
 $\psi _{b}\geq 0.25$
, the value of
 $\psi _{av}$
has approached or exceeded the CMC, showing that the interfacial tension
 $\sigma (\psi )$
has been reduced to the minimum interfacial tension
 $\sigma _{min}$
. Therefore, variations in
 $\psi _{b}$
have no significant influence on the critical neck thickness.
The dimensionless critical neck thickness
 $\delta _\textit{cr}^{*}$
as a function of the dimensionless bulk surfactant concentration
 $\psi _{b}$
, where the height-to-width ratio is set to
 $\chi =0.6$
.

Subsequently, we systematically investigate the influence of the minimum interfacial tension
 $\sigma _{\textit{min}}$
, elasticity number
 $E_{0}$
, mobility
 $M_{\psi }$
and diffusivity
 $\textit{Pi}$
on the dimensionless critical neck thickness
 ${\delta _\textit{cr}}^{*}$
. Unless otherwise specified, the parameters used in our simulations are:
 $\textit{Ca}=0.01 , \textit{Re}=0.0234 , \lambda =8 , \sigma _{\textit{min}}=\sigma _{0}/3 , E_{0}=0.5 , M_{\psi }=0.001$
and
 $\textit{Pi}=1.35$
. Figure 18(a) shows the effect of the dimensionless interfacial tension
 $\sigma _{\textit{min}}/\sigma _{0}$
on
 ${\delta _\textit{cr}}^{*}$
(solid red line). Here, the empty and solid square symbols represent the droplet neck retraction and breakup, respectively. It can be observed that
 ${\delta _\textit{cr}}^{*}$
decreases slightly as
 $\sigma _{\textit{min}}/\sigma _{0}$
decreases. This is because a lower
 $\sigma _{\textit{min}}$
reduces the interfacial tension, which in turn requires a larger Laplace pressure difference (corresponding to a smaller neck radius) to overcome the pressure difference between the inside and outside of the droplet neck. Figure 18(b) depicts the variation of
 ${\delta _\textit{cr}}^{*}$
with the elasticity number
 $E_{0}$
. As
 $E_{0}$
increases,
 ${\delta _\textit{cr}}^{*}$
first decreases and then remains nearly constant;
 $E_{0}$
represents the strength of the surfactant action. For a fixed surfactant concentration, a higher
 $E_{0}$
corresponds to a stronger reduction in interfacial tension. Figures 18(c) and 18(d) show the effects of mobility
 $M_{\psi }$
and diffusivity
 $\textit{Pi}$
on the dimensionless critical neck thickness
 ${\delta _\textit{cr}}^{*}$
. It can be observed that
 ${\delta _\textit{cr}}^{*}$
remains largely unchanged with variations in
 $M_{\psi }$
and
 $\textit{Pi}$
.
Effects of (a) dimensionless minimum interfacial tension
 $\sigma _{\textit{min}}/\sigma _{0}$
, (b) elasticity number
 $E_{0}$
, (c) mobility
 $M_{\psi }$
and (d) diffusivity
 $\textit{Pi}$
on the dimensionless critical neck thickness
 ${\delta _\textit{cr}}^{*}$
, where
 ${\delta _\textit{cr}}^{*}$
is denoted by the red solid lines. Droplet neck retraction and breakup are represented by the empty and solid symbols, respectively.

5.2. Onset of the spontaneous breakup of droplets in irregular T-junctions
This subsection examines the effect of surfactants on the onset of spontaneous droplet breakup in irregular T-junction microchannels with different depths and lengths of the constriction section (figure 1). We focus on the effect of surfactants on the critical neck thickness for spontaneous droplet breakup in various irregular T-junction microchannels.
5.2.1. Effect of constriction depth
Figure 19 illustrates the droplet profiles (
 $\rho ^{N}=0$
) in the
 $x-z$
midplane at the dimensionless critical time
 $t_\textit{cr}^{*}$
for varying dimensionless constriction depths of (i)
 $d^{*}=0$
, (ii)
 $d^{*}=0.05$
, (iii)
 $d^{*}=0.2$
and (iv)
 $d^{*}=0.4$
, respectively. In this figure, the red solid and black dashed lines represent the profiles of the surfactant-free and surfactant-laden droplet, respectively. Different values of
 $d^{*}$
are obtained from (2.1) by fixing the constriction length at
 $l=W$
(figure 1
b). As
 $d^{*}$
increases, the curvature of the upper part of the neck (the position marked by the black dot) increases in both surfactant-free and surfactant-laden systems. This occurs because the constriction section intensifies the deformation of the upper part of the droplet. Additionally, the dimensionless critical neck thickness
 $\delta _\textit{cr}^{*}$
appears to decrease with increasing
 $d^{*}$
in both systems. Notably,
 $\delta _\textit{cr}^{*}$
is smaller in the surfactant-laden system than in the surfactant-free system. The quantitative analysis of critical neck thickness evolution is presented below.
Droplet profiles (
 $\rho ^{N}=0$
) in the
 $x-z$
midplane at the dimensionless critical time
 $t_\textit{cr}^{*}$
for different dimensionless constriction depths of (a)
 $d^{*}=0$
, (b)
 $d^{*}=0.05$
, (c)
 $d^{*}=0.2$
and (d)
 $d^{*}=0.4$
, respectively. The black dashed and red solid lines represent the surfactant-free (
 $\psi _{b}=0$
) and surfactant-laden (
 $\psi _{b}=0.1$
) droplet profiles, respectively.

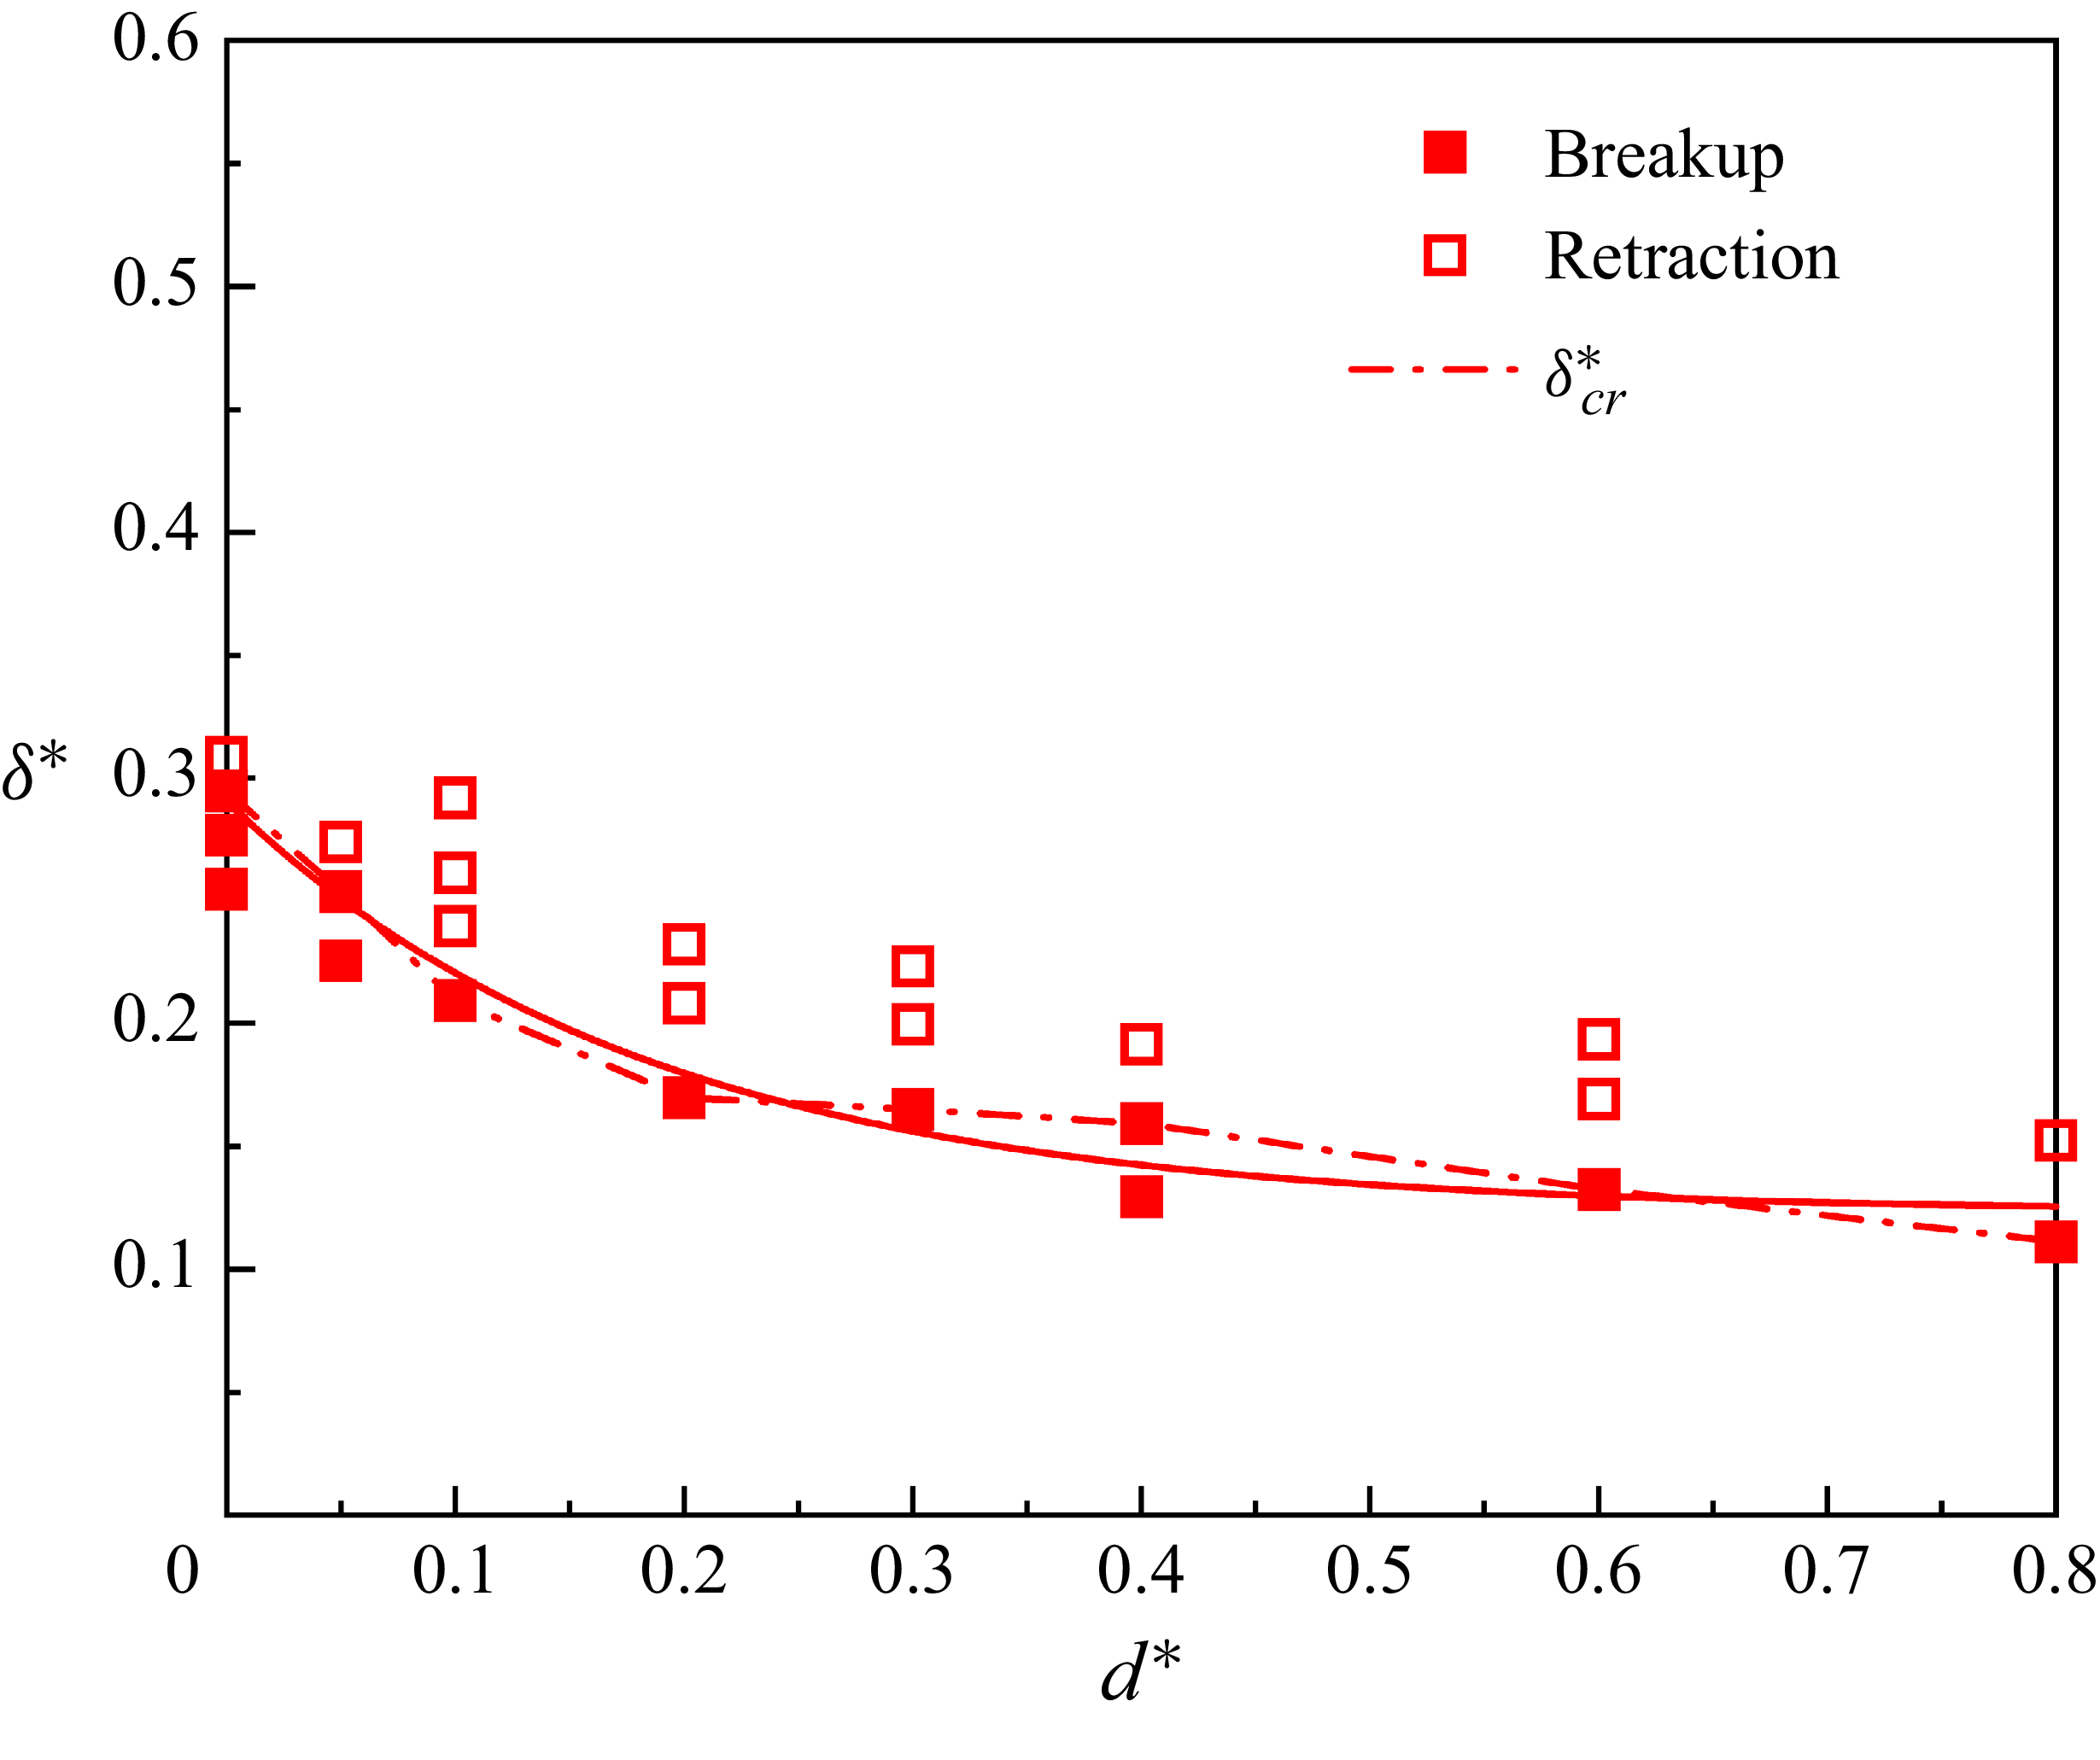
Figure 20 shows the variation of the dimensionless critical neck thickness (
 $\delta _\textit{cr}^{*}=\delta _\textit{cr}/W$
) for spontaneous droplet breakup with the dimensionless constriction depth
 $d^{*}$
for the surfactant-free system. It can be observed from this figure that
 $\delta _\textit{cr}^{*}$
monotonically decreases with increasing
 $d^{*}$
(the dashed line). Taking the interface position shown in figure 19 (black circle symbols) as an example, the local curvature is composed of the curvatures of the interface in two mutually perpendicular planes, i.e. the interface curvatures in the
 $x{-}z$
and
 $y{-}z$
midplanes. The direction of the capillary force in the top position of the droplet neck in the
 $x{-}z$
midplane is towards the outward normal direction of the interface, which is to prevent the contraction of the neck. However, the direction of the capillary force at the top position of the droplet neck in the
 $y{-}z$
midplane is toward the inward normal direction of the interface, which facilitates the contraction of the neck. As
 $d^{*}$
increases, the interface curvature in the
 $x{-}z$
midplane increases (figure 19), so the resistance to the neck contraction increases. To obtain the capillary force required for spontaneous neck breakup, an enhanced capillary force in the
 $y{-}z$
midplane is necessary, which corresponds to a larger curvature, i.e. a smaller radius, in the
 $y{-}z$
midplane. We also find that the simulated values of
 $\delta _\textit{cr}^{*}$
as a function of
 $d^{*}$
can be well described by a linear fit (coefficient of determination
 $R^{2}=0.98$
), which is expressed as
 $\delta _\textit{cr}^{*}=0.3765-0.3095d^{*}$
(the solid line).
Dimensionless critical neck thickness
 $\delta _\textit{cr}^{*}$
(the black dashed line) as a function of the dimensionless depth of the constricted section
 $(d^{*}=d/W)$
for the surfactant-free system. The simulated
 $\delta _\textit{cr}^{*}$
values versus
 $d^{*}$
are fitted using a linear relationship, represented by the black solid line. Other parameters are taken as:
 $\chi =0.6$
and
 $\psi _{b}=0$
.

Variation of the critical neck thickness
 $\delta _\textit{cr}^{*}$
(red dash-dotted line) with the dimensionless depth of the constricted channel
 $d^{*}$
for the surfactant-laden system. The simulated
 $\delta _\textit{cr}^{*}$
values are fitted with an exponential relationship (red solid line). Other parameters are taken as:
 $\chi =0.6$
and
 $\psi _{\mathrm{b}}=0.1$
.

Figure 21 shows the variation of the dimensionless critical neck thickness
 $\delta _\textit{cr}^{*}$
with the dimensionless constriction depth
 $d^{*}$
for the surfactant-laden system. Similar to the surfactant-free system,
 $\delta _\textit{cr}^{*}$
monotonically decreases with increasing
 $d^{*}$
in the surfactant-laden system. The reason for this phenomenon is the same as that illustrated in figure 19. Additionally, we find that the relationship between
 $\delta _\textit{cr}^{*}$
and
 $d^{*}$
no longer follows the linear pattern presented in the surfactant system. The simulated values of
 $\delta _\textit{cr}^{*}$
versus
 $d^{*}$
in the surfactant-laden system are well described by an exponential fit (coefficient of determination
 $R^{2}=0.97$
), given by
 ${\delta _\textit{cr}}^{*}=0.1234+0.1674\times e^{-{d^{*}}/0.1838}$
(red solid line). At the critical dimensionless time
 $t_\textit{cr}^{*}$
, the average dimensionless surfactant concentration
 $\psi _{av}$
within the range of
 $-0.9\leq \rho ^{N}\leq 0.9$
in the
 $y-z$
midplane is quantified. The measured values are
 $\psi _{av}=0.4884$
, 0.4871, 0.5057, 0.5083, 0.5041 and 0.5115 for
 $d^{*}=0$
, 0.05, 0.1, 0.2, 0.3 and 0.4, respectively. Among the six cases of dimensionless neck thickness
 $d^{*}$
, the surfactant concentration at the neck interface remains approximately constant, indicating that the interfacial tension
 $\sigma (\psi )$
is almost equal. The capillary pressure, given by
 $|\sigma (\psi )\kappa |$
, depends linearly on both the interfacial tension
 $\sigma (\psi )$
and the absolute value of the curvature
 $|\kappa |$
. As
 $d^{*}$
increases,
 $|\kappa |$
increases (i.e.
 $\delta _\textit{cr}^{*}$
decreases), leading to a greater contribution of the curvature to the capillary pressure. Conversely, the influence of
 $\sigma (\psi )$
on the capillary pressure correspondingly decreases. The presence of surfactants reduces
 $\delta _\textit{cr}^{*}$
, the weakening effect of surfactants is responsible for the observed decline in the rate of
 $\delta _\textit{cr}^{*}$
reduction with increasing
 $d^{*}$
.
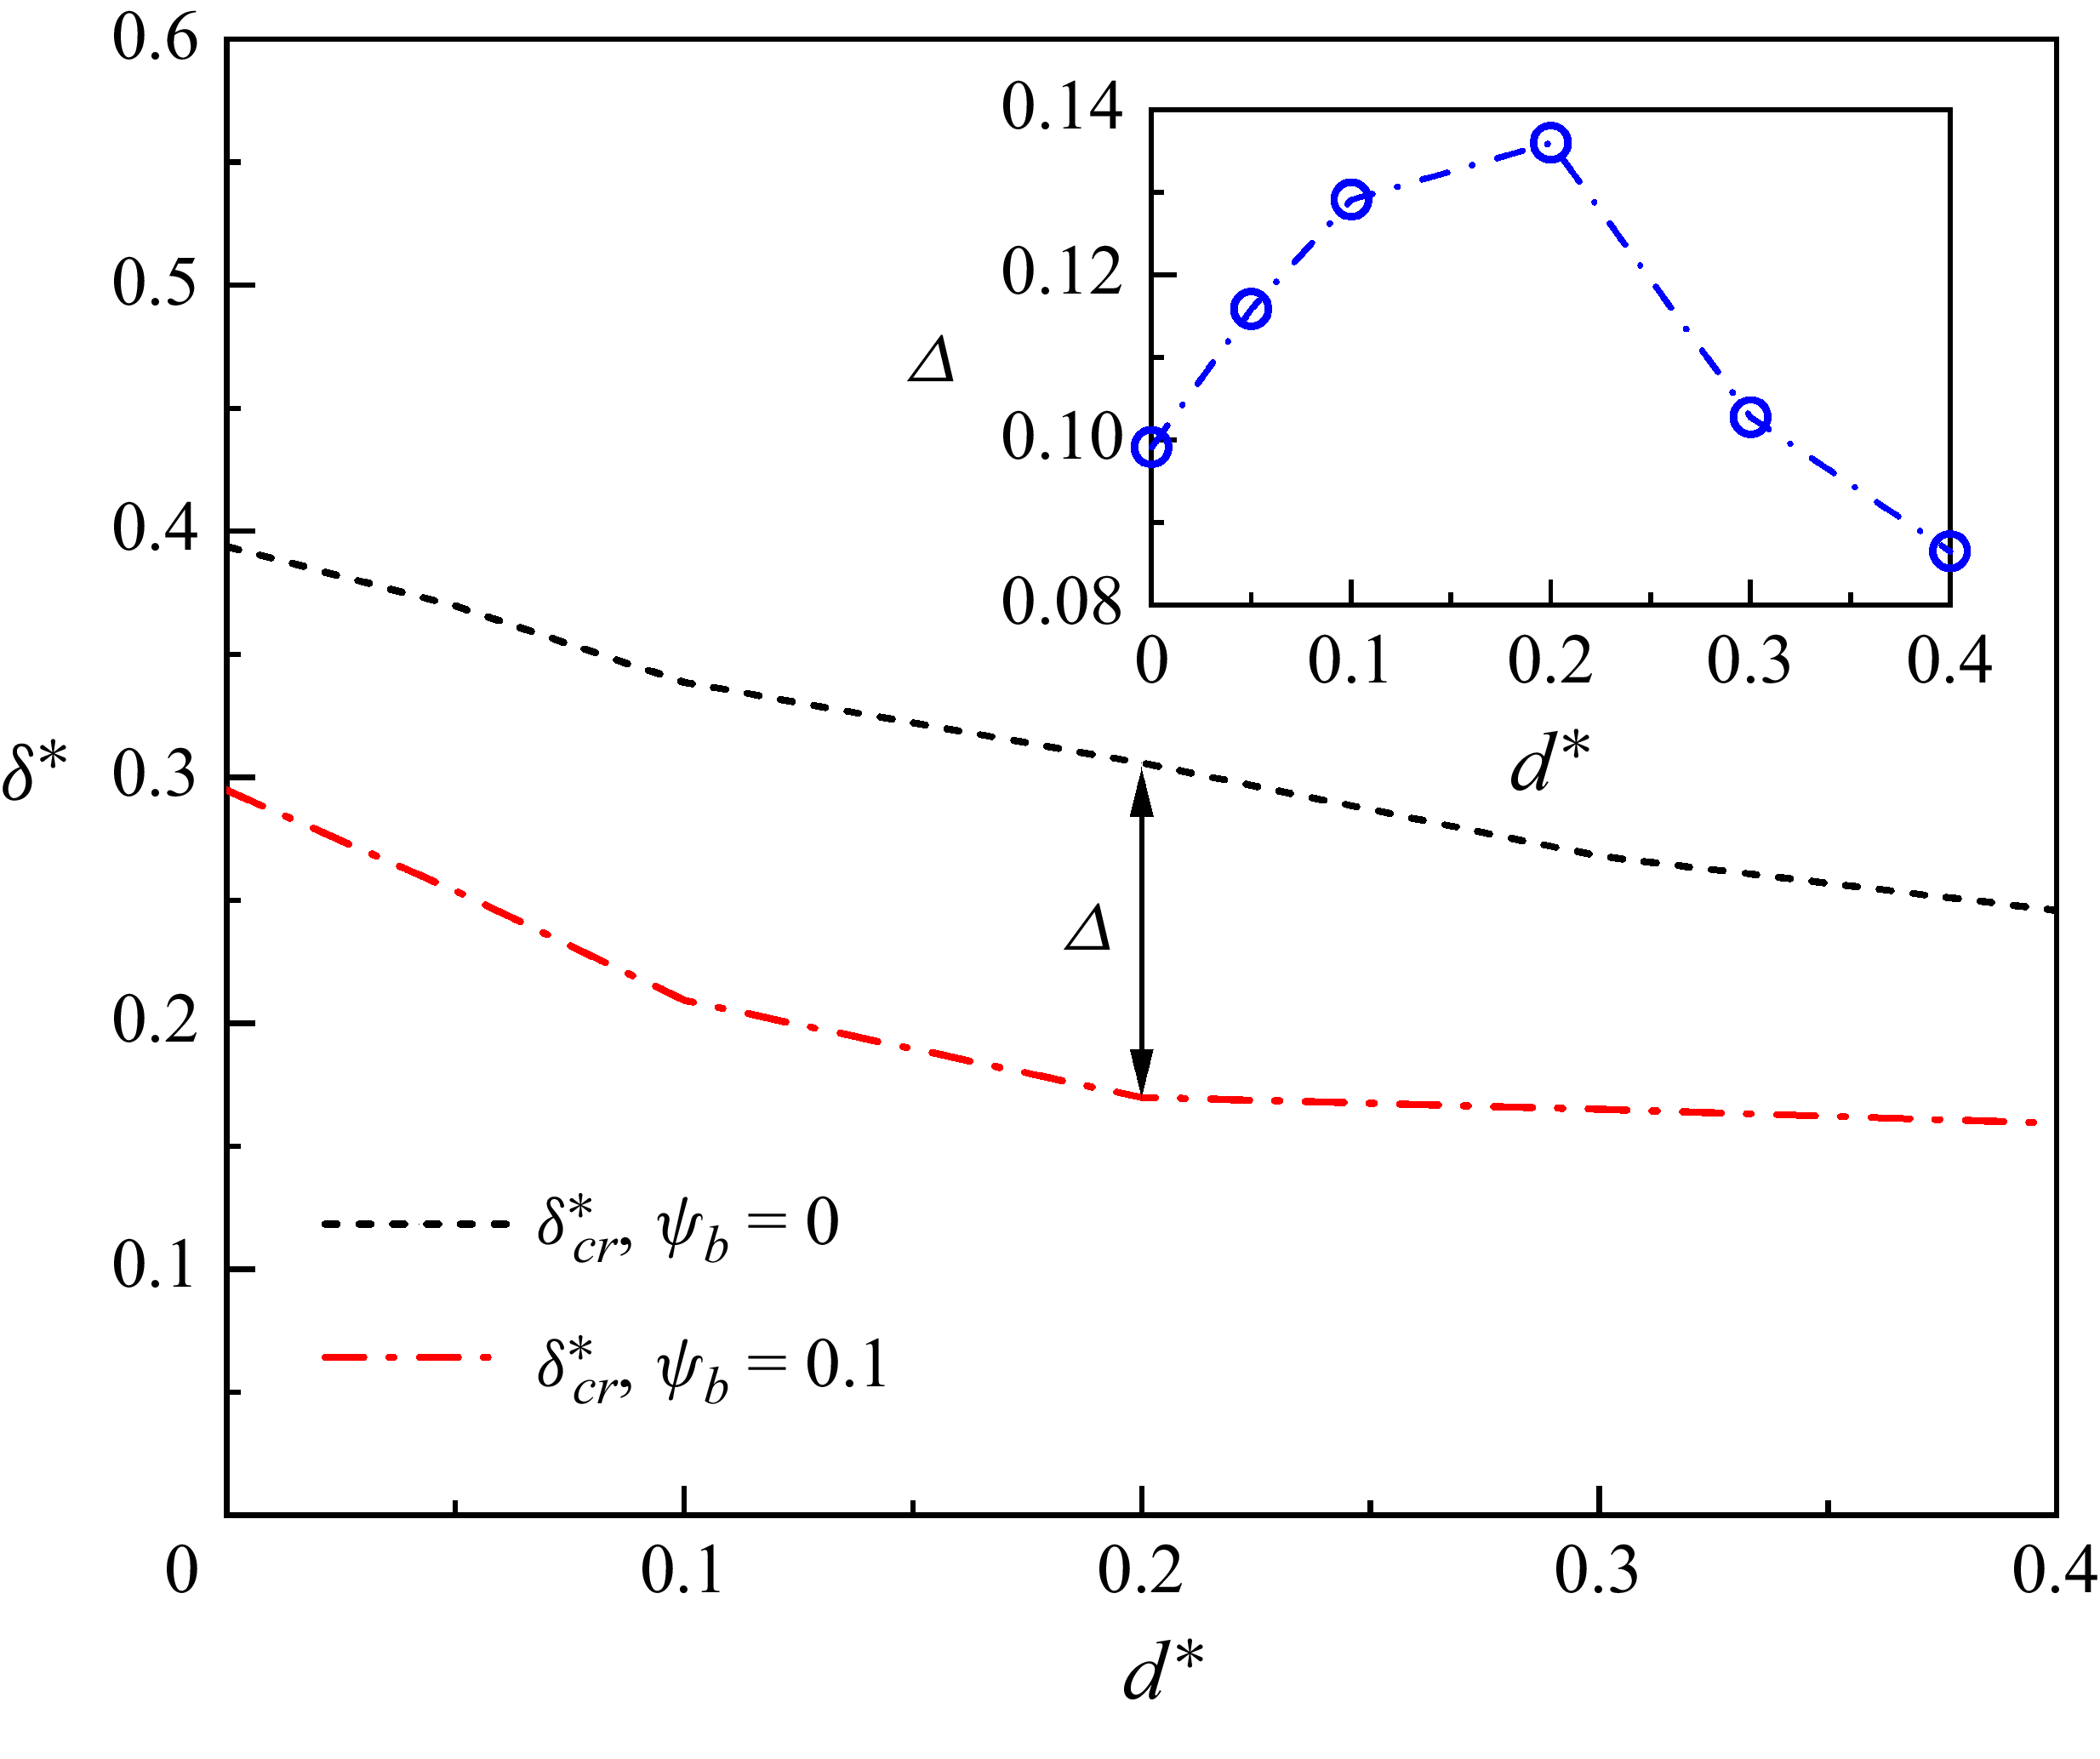
To highlight the differences in the dimensionless critical neck thickness
 $\delta _\textit{cr}^{*}$
across different dimensionless constriction depths (
 $d^{*}$
) between the surfactant-free and surfactant-laden systems, figure 22 shows the comparison of
 $\delta _\textit{cr}^{*}$
versus
 $d^{*}$
between the two systems. It should be noted that the two curves are directly taken from figures 20 and 21. The inset shows that the difference in
 $\delta _\textit{cr}^{*}$
between the two systems (
 $\varDelta$
) varies with
 $d^{*}$
. It can be observed from this inset that
 $\varDelta$
first increases and then decreases with increasing
 $d^{*}$
, and its maximum value is reached at
 $d^{*}=0.2$
. The initial increase may be attributed to the following factor: the local curvature at the bottom of the droplet neck in the
 $x{-}z$
midplane increases faster in the surfactant-laden system than in the surfactant-free system (see figure 19). This local curvature resists neck contraction, thus requiring a larger curvature in the
 $y{-}z$
midplane (i.e. a smaller
 $\delta _\textit{cr}^{*}$
) in the surfactant-laden system to generate sufficient capillary pressure for spontaneous neck breakup. The subsequent decrease occurs because the surfactant effects on
 $\delta _\textit{cr}^{*}$
gradually weaken with increasing
 $d^{*}$
, as illustrated in figure 20.
Comparison of the dimensionless critical neck thickness
 $\delta _\textit{cr}^{*}$
versus the dimensionless constriction depth
 $d^{*}$
between the surfactant-free (black dashed line) and surfactant-laden (red dash-dotted line) systems. The inset shows the difference in
 $\delta _\textit{cr}^{*}$
between the two systems (
 $\varDelta$
) as a function of
 $d^{*}$
.

5.2.2. Effect of constriction length
The effect of the constriction length
 $l$
on droplet dynamic behaviour is investigated. The value of
 $l$
is determined by (2.1) with a fixed constriction depth of
 $d=0.2W$
(see figure 1
c). Figure 23 shows the droplet profiles in the
 $x{-}z$
midplane at the dimensionless critical time
 $t_\textit{cr}^{*}$
for varying dimensionless constriction lengths of (i)
 $l^{*}=0.5$
, (ii)
 $l^{*}=1$
and (iii)
 $l^{*}=2$
, with a fixed height-to-width ratio
 $\chi =0.6$
. The droplet profiles for surfactant-free (
 $\psi _{b}=0$
) and surfactant-laden (
 $\psi _{b}=0.1$
) systems are depicted by black dashed and red solid curves, respectively. In both surfactant-free and surfactant-laden systems, the curvature at the top of the neck (the position where the black dot is located) in the
 $x{-}z$
midplane monotonically increases with increasing
 $l^{*}$
. This is because the constriction section intensifies the deformation of the upper part of the droplet. Additionally, the critical neck thickness
 $\delta _\textit{cr}^{*}$
seems to increase as
 $l^{*}$
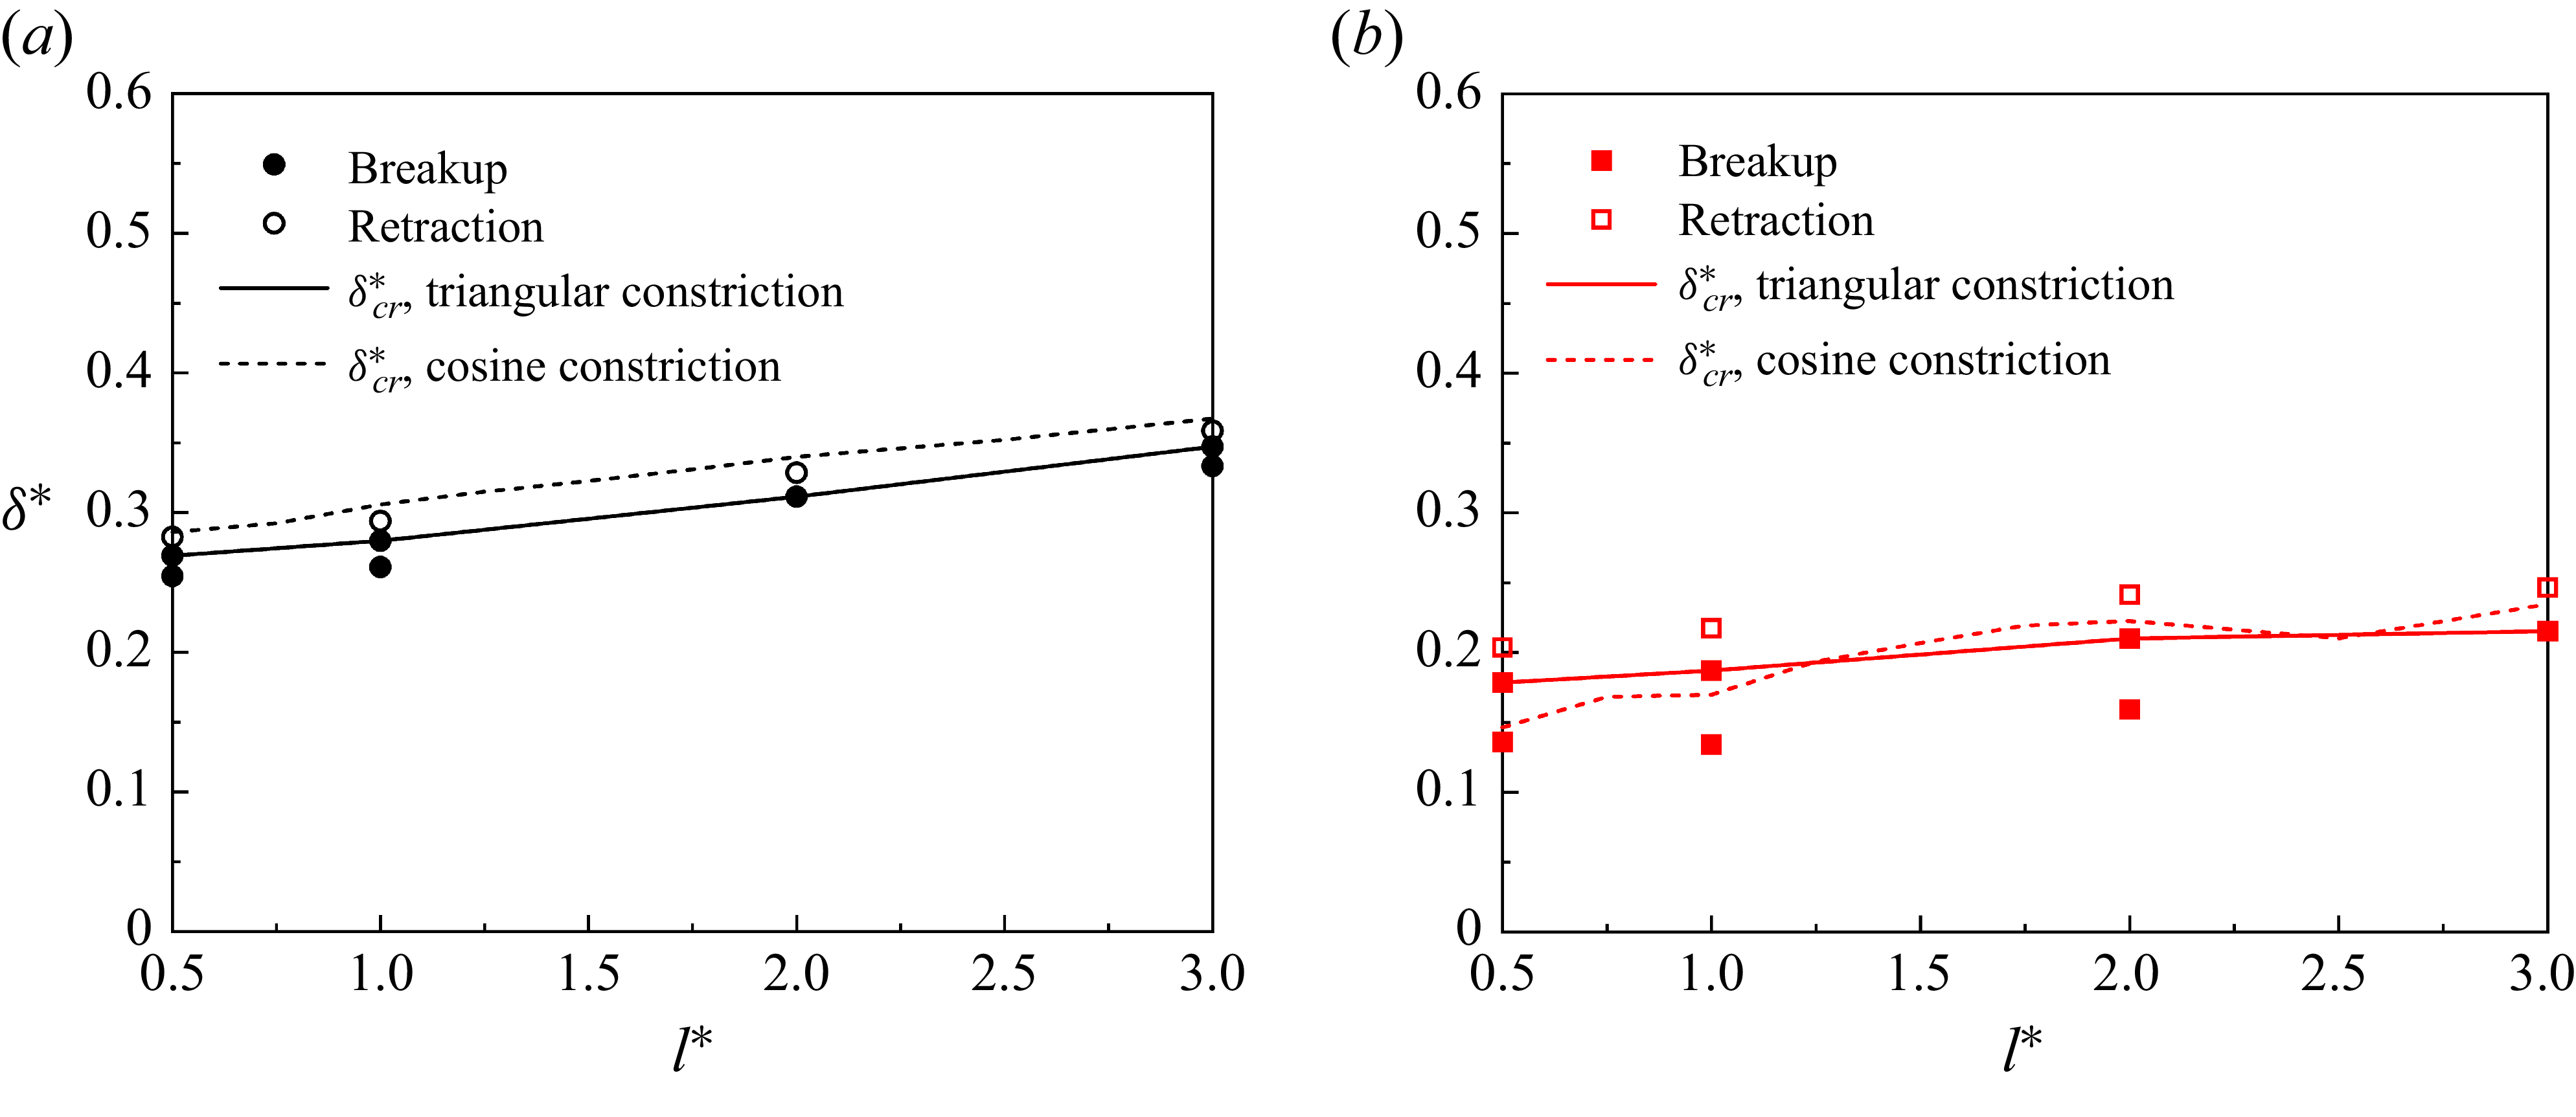
increases in both systems. Notably,
 $\delta _\textit{cr}^{*}$
is smaller in the surfactant-laden system than in the surfactant-free system. The quantitative comparison is given below.
Droplet profiles (
 $\rho ^{N}=0$
) in the
 $x{-}z$
midplane at the dimensionless critical time
 $t_\textit{cr}^{*}$
for varying dimensionless constriction lengths of (a)
 $l^{*}=0.5$
, (b)
 $l^{*}=1$
and (c)
 $l^{*}=2$
. The black dashed curves represent the surfactant-free droplet profiles, while the red solid curves correspond to the surfactant-laden droplet profiles.

Variation of the dimensionless critical neck thickness
 $\delta _\textit{cr}^{*}$
with the dimensionless constriction length
 $l^{*}$
for (a) the surfactant-free and (b) surfactant-laden systems. In both systems, the simulated
 $\delta _\textit{cr}^{*}$
data with respect to
 $l^{*}$
are fitted with linear relationship, and the resulting fitting lines are represented by the black (surfactant-free system) and red (surfactant-laden system) solid lines.

The dependence of the dimensionless critical neck thickness
 $\delta _\textit{cr}^{*}$
on the dimensionless constriction length
 $l^{*}$
is shown in figure 24(a) for the surfactant-free system and figure 24(b) for the surfactant-laden system. In both systems,
 $\delta _\textit{cr}^{*}$
monotonically increases with increasing
 $l^{*}$
. Correspondingly, the local curvature at the top of the neck in the
 $x{-}z$
midplane decreases with increasing
 $l^{*}$
(figure 23). This local curvature hinders neck retraction. Consequently, greater local curvature in the
 $x{-}z$
midplane necessitates smaller complementary curvature in the
 $y{-}z$
midplane (i.e. larger
 $\delta _\textit{cr}^{*}$
) to generate the capillary pressure required for spontaneous neck breakup. We find that the relationship between
 $\delta _\textit{cr}^{*}$
and
 $l^{*}$
follows a linear trend, described by the equation
 $\delta _\textit{cr}^{*}=0.2687+0.0342l^{*}$
(coefficient of determination
 $R^{2}=0.98$
) for the surfactant-free system (black solid line), and
 $\delta _\textit{cr}^{*}=0.1416+0.0344l^{*}$
(coefficient of determination
 $R^{2}=0.84$
) for the surfactant-laden system (red solid line). The slope of the fitting line is steeper in the surfactant-laden system than in the surfactant-free system, so the difference in
 $\delta _\textit{cr}^{*}$
between the two systems monotonically decreases with increasing
 $l^{*}$
. This indicates that the surfactant effects gradually weaken as
 $l^{*}$
increases.
6. Conclusions
In this study, we investigate the breakup of surfactant-free and surfactant-laden droplets in both regular and irregular T-junction microchannels under constant inlet velocity condition using our recently developed LB method (Zhang et al. 2024a, Reference Zhang, Cui, Liu, Chen, Zhang and Li2023a). First, we perform a grid independence test by examining both the temporal evolution of the neck thickness during droplet breakup and the critical neck thickness required for spontaneous droplet breakup, which helps determine the optimal grid resolution.
Then, the transport of droplets through the regular rectangular microchannels is investigated. In the surfactant-free system, the dimensionless critical neck thickness
 $\delta _\textit{cr}^{*}$
monotonically increases with the width-to-height ratio
 $\chi$
of the T-junction microchannel. The values of
 $\delta _\textit{cr}^{*}$
for various
 $\chi$
values obtained by the present method are consistent with both the empirical formula proposed by van Steijn & Kleijn (Reference Van Steijn and Kleijn2009) and the numerical results reported by Hoang et al. (Reference Hoang, Portela, Kleijn, Kreutzer and Van Steijn2013). Our results show that the prerequisite for spontaneous breakup of surfactant-free droplets is that the local capillary pressure in the triggering area exceeds the Laplace pressure difference across the droplet neck. The presence of surfactants reduces
 $\delta _\textit{cr}^{*}$
at a specified
 $\chi$
value. Moreover, as
 $\chi$
increases, the difference in
 $\delta _\textit{cr}^{*}$
between the two systems (
 $\varDelta$
) increases, indicating that the surfactant effects are gradually strengthened. Interestingly, although the average surfactant adsorption on the neck interface remains essentially constant, the enhanced interfacial tension dominance over the reduced curvature effect makes the surfactant influence gradually stronger with increasing
 $\chi$
.
Finally, we study surfactant-free and surfactant-laden droplets passing through an irregular T-junction microchannel with a constriction segment on the upper wall. The dimensionless constriction depth
 $d^{*}$
and length
 $l^{*}$
are used to characterise the constriction segment. Our results show that, as
 $d^{*}$
increases,
 $\delta _\textit{cr}^{*}$
linearly decreases in the surfactant-free system, while it decays exponentially in the surfactant-laden system. As
 $d^{*}$
increases, the enhanced curvature in the
 $x{-}z$
midplane increases resistance to neck contraction, which requires greater compensatory curvature (i.e. a smaller mean radius of curvature) in the
 $y{-}z$
midplane to achieve spontaneous neck breakup. The presence of surfactants decreases
 $\delta _\textit{cr}^{*}$
, and the magnitude of this reduction initially increases and then decreases with increasing
 $d^{*}$
. As
 $l^{*}$
increases,
 $\delta _\textit{cr}^{*}$
linearly increases in both the surfactant-free and surfactant-laden systems, and a steeper slope is observed in the surfactant-free system. As
 $l^{*}$
increases, the decreasing curvature in the
 $x{-}z$
midplane reduces neck retraction resistance, thereby requiring gradually smaller compensatory curvature in the
 $y{-}z$
midplane (i.e. larger mean radius of curvature) to maintain capillary pressure needed for spontaneous neck breakup. Furthermore, four empirical formulas are proposed to predict the
 $\delta _\textit{cr}^{*}$
values for varying constriction depths and lengths in the surfactant-free and surfactant-laden systems.
For this study, although the empirical correlations provide practical predictive capability and valuable physical insights, they also highlight a key limitation in the lack of a unified theoretical model. In future work, we will prioritise deriving a generalised physical framework capable of analytically describing the neck spontaneous breakup dynamics across complex geometries and surfactant conditions, with the empirical trends revealed here serving as essential benchmarks for validation.
Supplementary movies
Supplementary movies are available at https://doi.org/10.1017/jfm.2026.11098.
Funding
The authors acknowledge the financial support by the National Natural Science Foundation of China (Nos. 52306202, 12072257), the support of the Key Project of Natural Science Foundation of Heilongjiang Province (No. ZL2024E013) and the National Key R&D Program of China (No. 2022YFF0503500).
Declaration of interests
The authors report no conflict of interest.
Appendix A. The effect of dimensionless parameters
We investigate the effects of the capillary number
 $\textit{Ca}$
, Reynolds number
 $\textit{Re}$
, viscosity ratio
 $\lambda$
and dimensionless initial droplet length
 ${l_{0}}^{*}$
on the dimensionless critical neck thickness
 ${\delta _\textit{cr}}^{*}$
for both clean (black dotted line) and surfactant-laden (red solid line) systems, as depicted in Figure 25. Different values of
 $\textit{Ca}$
(
 $\lambda$
) are obtained by moderately adjusting the interfacial tension
 $\sigma _{0}$
(dispersed fluid viscosity
 $\mu ^{B}$
), while maintaining other parameters unchanged. Different values of
 $\textit{Re}$
are realised by changing the inlet velocity
 $u_{\textit{in}}$
and the continuous fluid viscosity
 $\mu ^{R}$
, while keeping other dimensionless parameters unchanged. As shown in figure 25(a), the values of
 ${\delta _\textit{cr}}^{*}$
in the clean system remains nearly constant with varying
 $\textit{Ca}$
values, and agrees well with the predictions of (5.1). These results are consistent with the numerical observations by Hoang et al. (Reference Hoang, Portela, Kleijn, Kreutzer and Van Steijn2013). In the surfactant-laden system,
 ${\delta _\textit{cr}}^{*}$
also shows little dependence on
 $\textit{Ca}$
. In both clean and surfactant-laden systems, the values of
 ${\delta _\textit{cr}}^{*}$
are found to be independent of
 $\textit{Re}$
(see Figure 25b). This behaviour can be explained as follows. The Reynolds number characterises the ratio of inertial to viscous forces, while the spontaneous neck breakup is governed by the local capillary pressure and the Laplace pressure difference in the triggering region, which is unaffected by the inertial forces. The inertial forces may play an important role in the neck-thinning process, but they do not affect the critical neck thickness. In addition,
 ${\delta _\textit{cr}}^{*}$
remains independent of
 $\lambda$
and
 ${l_{0}}^{*}$
in both clean and surfactant-laden systems.
Effects of (a) capillary number
 $\textit{Ca}$
, (b) Reynolds number
 $\textit{Re}$
, (c) viscosity ratio
 $\lambda$
and (d) dimensionless initial droplet length
 ${l_{0}}^{*}$
on the dimensionless critical neck thickness
 ${\delta _\textit{cr}}^{*}$
for clean (black dotted line) and surfactant-laden (red solid line) systems. The empty circular (square) symbols represent the clean (surfactant-laden) droplet neck retraction, whereas the solid circular (square) symbols correspond to the clean (surfactant-laden) droplet neck breakup. The blue line shows the analytical solution from (5.1).

Capillary pressure
 $\sigma _{0}\kappa$
as a function of polar angle
 $\alpha$
in the
 $y{-}z$
midplane at different dimensionless times (
 $t^{*}$
) for (a) capillary number
 $\textit{Ca}=0.15$
, (b) Reynolds number
 $\textit{Re}=1$
, (c) viscosity ratio
 $\lambda =0.8$
and (d) dimensionless initial droplet length
 $l_{0}^{*}=2.5$
. The coloured dashed lines represent the mean capillary pressure
 $\sigma _{0}\kappa _{m}$
for each corresponding
 $t^{*}$
.

Subsequently, we verified whether the relationship between the capillary force and the Laplace pressure in the triggering region could still explain the spontaneous neck breakup under additional
 $\textit{Ca} , \textit{Re} , \lambda$
and
 ${l_{0}}^{*}$
conditions. Figure 26 shows the variation of the capillary pressure
 $\sigma _{0}\kappa$
with polar angle
 $\alpha$
in the
 $y{-}z$
midplane at different dimensionless times (
 $t^{*}$
) for (i) capillary number
 $\textit{Ca}=0.15$
, (ii) Reynolds number
 $\textit{Re}=1$
, (iii) viscosity ratio
 $\lambda =0.8$
and (iv) dimensionless initial droplet length
 $l_{0}^{*}=2.5$
. The coloured dashed lines represent the mean capillary pressure
 $\sigma _{0}\kappa _{m}$
for each corresponding
 $t^{*}$
. The dimensionless time interval
 $\Delta t^{*}$
and
 $\psi _{b}$
are set to 0.023 and 0, respectively. As shown in the triggering regions (shaded areas), the magnitude of
 $| \sigma _{0}\kappa |$
remains below
 $| \sigma _{0}\kappa _{m}|$
when
 $t^{*}\lt t_\textit{cr}^{*}$
, but exceeds
 $| \sigma _{0}\kappa _{m}|$
after the critical point is reached (
 $t^{*}\geq t_\textit{cr}^{*}$
). This indicates that the capillary pressure in the triggering region remains below the Laplace pressure
 $\Delta p$
when
 $t^{*}\lt t_\textit{cr}^{*}$
, but that rises above
 $\Delta p$
once
 $t^{*}\geq t_\textit{cr}^{*}$
. This indicates that the triggering region condition remains applicable under different
 $\textit{Ca} , \textit{Re} , \lambda$
and
 ${l_{0}}^{*}$
values.
Appendix B. Effect of the constriction shapes
We investigate the effect of the dimensionless constriction length
 $d^{*}$
in triangular notches on the critical neck thickness
 $\delta _\textit{cr}^{*}$
for both clean and surfactant-laden systems, as shown in figures 27(a) and 27(b), respectively. Here, the black and red solid lines represent the values of
 $\delta _\textit{cr}^{*}$
for the triangular constriction, while the dashed black and red lines show the values of
 $\delta _\textit{cr}^{*}$
for the cosine constriction, taken directly from figures 20 and 21. For both clean and surfactant-laden systems, the dimensionless critical neck thickness
 $\delta _\textit{cr}^{*}$
exhibits a similar dependence on
 $d^{*}$
under both triangular and cosine constrictions, with comparable values at identical
 $d^{*}$
.
Dimensionless critical neck thickness
 $\delta _\textit{cr}^{*}$
as a function of the dimensionless constriction depth
 $d^{*}=d/W$
for the (a) surfactant-free and (b) surfactant-laden systems. The solid black and red lines represent
 $\delta _\textit{cr}^{*}$
values for the triangular constriction, while the black dashed and red dash-dotted lines show
 $\delta _\textit{cr}^{*}$
values for the cosine constriction, taken directly from figures 20 and 21.

We then investigate the influence of the dimensionless constriction length
 $l^{*}$
in the triangular notches on the critical neck thickness
 $\delta _\textit{cr}^{*}$
for both clean and surfactant-laden systems, as shown in figures 28(a) and 28(b), respectively. Here, the black and red solid lines indicate the
 $\delta _\textit{cr}^{*}$
values for the triangular constriction, while the black and red dashed lines show the values of
 $\delta _\textit{cr}^{*}$
for the cosine constriction, taken directly from figure 24. The dimensionless critical neck thickness
 $\delta _\textit{cr}^{*}$
exhibits a consistent dependence on
 $d^{*}$
for both clean and surfactant-laden systems, regardless of the constriction geometry (triangular or cosine). Moreover, the
 $\delta _\textit{cr}^{*}$
values at the same
 $l^{*}$
are closely aligned between two constriction types.
Dimensionless critical neck thickness
 $\delta _\textit{cr}^{*}$
as a function of the dimensionless constriction depth
 $l^{*}=l/W$
for the (a) surfactant-free and (b) surfactant-laden systems. The black and red solid lines represent
 $\delta _\textit{cr}^{*}$
values for the triangular constriction, while the dashed black and red lines show
 $\delta _\textit{cr}^{*}$
values for the cosine constriction, taken directly from figure 24.