1 Introduction
The Facts. At least since the year 2000, academic researchers have concluded unanimously that the Spanish pay-as-you-go, defined-benefit public pension system, which was in force before the 2011 and 2013 Reforms, was unsustainableFootnote 1 . Moreover, most of the literature reached that conclusion before the 2008 recession. This means that the sustainability problem of Spanish pensions was structural and was not related to the business cycle. In Díaz-Giménez and Díaz-Saavedra (Reference Díaz-Giménez and Díaz-Saavedra2006) we showed that the cause of this problem was the demographic transition that will increase the expenditures of the Spanish pension system steadily until roughly 2050.
The Reforms. In spite of this overwhelming scientific evidence, until 2011, every political party represented in the Spanish parliament denied steadfastly that Spanish pensions had a structural sustainability problem. The political change of mind, however, took place in January 2010 when the Spanish Government sent its 2011–2014 Stability Plan to the European Commission. Amongst other measures, this plan proposed a parametric reform of the Spanish pension system. The reform that was finally approved in 2011 enacted three main parametric changes: a gradual increase in the number of years of contributions that are used to calculate the retirement pension, a delay of the first retirement age from 61 to 63 for workers who retire voluntarily, and a gradual delay of the normal retirement age from 65 to 67. The adoption of these changes started in 2013Footnote 2 .
In 2013, when the 2011 reforms were starting to be implemented, the Spanish government enacted three additional changes. First, the early retirement age was delayed gradually once again. This new delay increases the first retirement age from 63 to 65 years, 1 month per year starting in 2013, for workers who retire voluntarily. Second, a new Sustainability Factor was introduced to reduce the value of new pensions according to the expected duration of retirement. And, third, a new and bounded Pension Revaluation Index (PRI) was introduced to reduce the real value of all pensions in order to make the pension system essentially sustainable. Specifically, pensions are reduced in an amount that equates a moving average of past and expected future pension system outlays with a moving average of past and expected future pension system revenues. These changes effectively transform the Spanish traditional defined-benefit pay-as-you-go system into a defined-contribution pay-as-you-go system.
The Model Economy. In this paper we analyze the sustainability, and the aggregate and welfare consequences of these reforms of the Spanish public pension system. To do so, we simulate an enhanced version of the general equilibrium, multi-period, overlapping generations model economy populated by heterogeneous households described in Díaz-Giménez and Díaz-Saavedra (Reference Díaz-Giménez and Díaz-Saavedra2009). The model economy that we study here differs from the one that we used in that article in two fundamental ways. First, we have substituted the proportional tax on labor income of the previous version with a progressive household income tax. This allows us to exploit the heterogeneity in our model economy, and to avoid the ongoing discussion of whether model economies should be calibrated to replicate the marginal or the average tax rates of the progressive personal income taxes of real economies. Second, we have updated our calibration year to 2010. This allows us to account for the first 2 years of the Spanish recession that started in 2008.
Six additional differences between this version of our model economy and the previous one are the following: the new version of our model economy replicates the 2010 distribution by age and education of the Spanish population; it updates the deterministic component of the life-cycle profile of earnings to reflect the reduction in the education wage-premium; it simulates the Spanish Instituto Nacional de Estadística's (INE) 2012 Spanish demographic scenario; it replicates the World Economic Outlook's October 2014 growth scenario for Spain; it delivers a value for the Frisch labor supply elasticity, which is more in line with recent estimates of this variable; and it improves the measurement of key macroeconomic aggregates and ratios.
The Findings. Our findings are the following: First, we confirm that the Spanish Public Pension System, which was in force before the 2011 and 2013 Reforms, was completely unsustainable. Specifically, we show that, under the rules prevailing in 2010, the pension system expenditures would have doubled between 2010 and 2050, while the pension system revenues would have remained virtually unchanged. The pension deficit would have reached 12.2% of output in 2050, and the consumption tax rate that would have been necessary to finance this deficit would have increased from 21.2% in 2010 to a startling 47.9% in 2050.
Second, the 2011 and 2013 Reforms improve the future financial condition of the Spanish pension system substantially and they reduce the need for future tax increases to finance the pensions. Under the new rules, in 2050 the pension system deficit is reduced from 12.2% of output to 0.6%, and the consumption tax rate needed to finance this deficit is reduced from 47.9% to 22.6%. Unfortunately, this result is achieved at the expense of reducing the real value of the average pension substantially. The reduction in pensions is progressive and, by 2050, we find that the value of the average pension will be approximately 30% smaller in real terms than what it would have been under the pension system rules that prevailed in 2010.
Third, we find that these reforms are expansionary and that the accumulated increase in the model economy output reaches 28.4% in 2050. Two reasons account for this result. First, the reforms increase the duration of the working lives and this increases the aggregate effective labor input by 22.9% in 2050. And, second, the longer working lifetime and the lower retirement pensions increase savings, and this increases the stock of physical capital by 36.6 that same year.
Fourth, our welfare comparison shows that the trade-off between lower pensions and lower leisure against the lower consumption taxes that result from the reforms bring about substantial welfare losses for most of the households alive at the moment of these reforms, and that the households born between 1950 and 1970, young disabled workers who are alive at the time of the reform, and future cohorts bear the highest welfare costs. The substantial reduction of pensions and the high welfare costs that these reforms bring about lead us to conjecture that further reforms lurk in the future of Spanish pensions.
This paper has an on-line technical appendix with a detailed description of our model economy that is available at http://www.javierdiazgimenez.com/res/PEN3-APP.pdf. In this appendix we also discuss our calibration choices, we describe our computational procedure and we review the literature on the 2011 and the 2013 Reforms of Spanish pensions. In this literature review, we discuss in great detail the paper by Sánchez-Martín (Reference Sánchez-Martín2014), who is closest in spirit and modeling choices to our research.
2 The model economy
We study an overlapping generations model economy with heterogeneous households, a representative firm, and a government. Our model economy is an enhancement of the model economy described in detail in Díaz-Giménez and Díaz-Saavedra (Reference Díaz-Giménez and Díaz-Saavedra2009). For the sake of brevity, we offer only a brief summary of its main features here. A detailed description of this model economy can be found in the technical appendix to this paper that is available at http://www.javierdiazgimenez.com/res/PEN3-APP.pdf.
2.1 The households
Households in our model economy are heterogeneous and they differ in their age, in their education, in their employment status, in their assets, in their pension rights, and in their pensions.
Age. Households enter the economy at age 20, the duration of their lifetimes is random, and they exit the economy at age 100 at the latest.
Fertility and Immigration. In our model economy fertility rates and immigration flows are exogenous.
Education. Households can either be high school dropouts, high school graduates who have not completed college, or college graduates. A household's education level is determined forever when it enters the economy.
Employment status. Households in our economy are either workers, disabled households, or retirees. Every household enters the economy as a worker, and every worker faces a positive probability of becoming disabled. Once a household has reached the early retirement age, it decides whether to retire. Both the disability shock and the retirement decision are irreversible and there is no mandatory retirement age.
Workers. Workers receive an endowment of efficiency labor units every period. This endowment has two components: a deterministic component and a stochastic component. The deterministic component depends on the household age and education, and we use it to characterize the life-cycle profiles of earnings. The stochastic component is independently and identically distributed across the households, and we use it to generate earnings and wealth inequality within the age cohorts.
Disabled Households. Each period, workers face a probability of becoming disabled. When this happens, the worker exits the labor market and receives no further endowments of efficiency labor units, but she is entitled to receive a disability pension until she dies.
Retirees. Retirees do not receive an endowment of efficiency labor units, but they receive a retirement pension.
Insurance Markets. A key feature of our model economy is that there are no insurance markets for the stochastic component of the endowment shock. When insurance markets are allowed to operate, every household of the same age and education level is identical, and the earnings and wealth inequality disappears almost completely.
Assets. Households in our model economy differ in their asset holdings, which are constrained to being positive. Since leisure is an argument of their utility function, this borrowing constraint can be interpreted as a solvency constraint that prevents the households from going bankrupt in every state of the world. These restrictions give the households a precautionary motive to save. They do so accumulating real assets, which take the form of productive capital.
Pension Rights and Pensions. Workers differ in their pension rights and disabled households and retirees differ in their pensions. Workers accumulate pension rights when they pay payroll taxes. These rights are used to determine the value of their pensions when they retire. The rules of the pension system, which we describe below, specify the rules that govern the accumulation of pension rights, and the rules that determine the mapping from pension rights into pensions. In our model economy workers take this mapping into account when they decide how much to work and when to retire.
Preferences. Households derive utility from consumption and from non-market uses of their time, and their preferences can be described by the standard Cobb-Douglas expected utility function that we define in Expression (12).
2.2 The representative firm
In our model economy there is a representative firm. Aggregate output at period t, Y t , depends on aggregate capital, K t , and on the aggregate labor input, L t , through a constant returns to scale, Cobb-Douglas, aggregate production function of the form
 $$Y_t = K_t^\theta (A_t L_t )^{1 - \theta} $$
where A t denotes an exogenous labor-augmenting productivity factor whose law of motion is A t+1 = (1 + γ t )A t , and where A 0 > 0. Factor and product markets are perfectly competitive and the capital stock depreciates geometrically at a constant rate, δ.
2.3 The government
The government in our model economy taxes capital income, household income and consumption, and it confiscates unintentional bequests. It uses its revenues to finance an exogenous flow of public consumption, and to make transfers to households other than pensions. The government also runs a pay-as-you-go pension system, which we describe below. The consolidated government and pension system budget constraint is
 $$G_t + P_t + Z_t = T_{kt} + T_{st} + T_{yt} + T_{ct} + E_t + [(F_t (1 + r^{\ast} ) - F_{t + 1} ]$$
where G t denotes government consumption, P t denotes pensions, Z t denotes other government transfers, T kt , T st , T yt , and T ct , denote the revenues collected by the capital income tax, the payroll tax, the household income tax, and the consumption tax, E t denotes unintentional bequests, F t > 0 denotes the value of the pension reserve fund at the beginning of period t, and r* denotes the exogenous interest rate that the government obtains from the pension reserve fund assets. Consequently, [F t (1 + r*) − F t+1] denotes the revenues that the government obtains from the pension reserve fund or that deposits into it. We assume that the pension reserve fund must be non-negative and that transfers other than pensions are thrown to the sea so that they create no distortions in the household decisions.
We assume that the capital income and consumption tax rates are proportional, that unintentional bequests are confiscated and that the household income tax rate is progressive.
Household income taxes. To model the household income tax, we use the following function:
 $$\tau _y \left( {y_t^b} \right) = a_9 \left\{ {y_t^b - \left[ {a_{10} + \left( {y_t^b} \right)^{ - a_{11}}} \right]^{ - 1/a_{11}}} \right\}$$
where
 $y_t^b $
is the income tax base, which we define as follows:
 $$y_t^b = (1 - \tau _k )y_t^k + y_t^l + p_t^d (b_t ) + p_t (b_t ) - \tau _s \left( {y_t^l} \right)$$
In these expressions, τ
k
is the capital income tax rate,
 $y_t^k $
is before-tax capital income,
 $y_t^l $
is before-tax labor income,
 $p_t^d $
is the disability pension, P
t
is the retirement pension, τ
s
is the payroll tax function that we describe below, and a
9, a
10, and a
11 are parameters. Expression (3) is the function chosen by Gouveia and Strauss (Reference Gouveia and Strauss1994) to model effective personal income taxes in the USA and it is also the functional form chosen by Calonge and Conesa (Reference Calonge and Conesa2003) to model effective personal income taxes in Spain.
2.4 The pension system
To complete the specification of our model economy we need to describe its pay-as-you-go pension system. A pay-as-you-go pension system is a payroll tax, the rules that govern the accumulation of pension rights, and the rules that map pension rights into pensions. These rules include the rules that specify the legal retirement ages and the rules that describe the revaluation of pensions. In our benchmark model economy we choose the payroll tax and the pension system rules so that they replicate as closely as possible the 2010 Spanish pay-as-you-go pension system.
The 2010 Spanish pay-as-you-go pension system. The 2010 Spanish public pension system paid out retirement, disability, illness, survivor, childcare, orphanhood, and other pensions. These pensions could be either contributory or non-contributory. In this paper we focus exclusively on contributory retirement and disability pensions. In 2010 these pensions accounted for 66.3% of the total number of pensions.
The Spanish contributory system is a mandatory public system. In 2010 the Spanish contributory system paid out 5,203,364 retirement pensions and 935,514 disability pensions. These pensions were provided by the following programs: the Régimen General de la Seguridad Social, which includes most private sector employees, members of cooperative firms, employees of most public administrations and all the unemployed individuals who had complied with the minimum number of contributory years at retirementFootnote 3 ; the Régimen Especial de los Trabajadores por Cuenta Propia o Autónomos, which includes self-employed workers and professionals; the Pensiones del Seguro Obligatorio de Vejez e Invalidez, which covers old workers who had been affiliated to previous system; and three smaller programs: the Régimen Especial de los Trabajadores del Mar for seamen, the Mutuas de Accidentes de Trabajo y Enfermedades Profesionales de la Seguridad Social, and the Régimen Especial de la Minería del Carbón for coal miners.
In this paper we focus exclusively on the retirement and disability pensions payed by the Régimen General de la Seguridad Social. In 2010 these pensions accounted for 58.3% of the total number of contributory retirement and disability pensions.
Payroll Taxes. In Spain in 2010 payroll tax rates were proportional to covered earnings, which were defined as total earnings, excluding payments for overtime work, up to a ceiling. In 2010 the payroll tax rate was 28.3%, of which 23.6% was attributed to the employer and the remaining 4.7% to the employee; maximum monthly covered earnings were 3,198 euros.Footnote 4
In our model economy the payroll tax function is the following:
 $$\tau _s \left( {y_t^l} \right) = \left\{ {\matrix{ {a_{13} \bar y_t - \left[ {a_{13} \bar y_t \left( {1 + \displaystyle{{a_{14} y_t^l} \over {a_{13} \bar y_t}}} \right)^{{{ - y_t^l} / {a_{13} \bar y_t}}}} \right]} \hfill & {{\rm if}\;j \lt R_1} \hfill \cr 0 \hfill & {{\rm otherwise}} \hfill \cr}} \right.$$
where parameter a
13 is the cap of the payroll tax,
 $\bar y_t $
is per capita output at market prices,
 $y_t^l $
is labor income, j is the household's age, and R
1 denotes the normal retirement age. This function gives us a close approximation to the Spanish payroll tax function and it is differentiable.
Retirement Ages. In Spain in 2010 the retirement age that entitled workers to receive a full retirement pension was 65. Workers aged 61 or older could retire earlier paying an early retirement penalty, as long as they had contributed to the pension system for at least 30 years. Exceptionally, workers who had entered the system before 1967 could retire at age 60.
In the case of early retirement, the pension benefits of households with between 30 and 40 years of contributions were reduced by 7.5% for every year or fraction of year before 65. When a household had contributed for more than 40 years the penalty was reduced to 6% per year. For those who are allowed to retire at age 60, the pension benefit was reduced by 8% per year.
In our model economy the normal retirement age is R 1 and the early retirement age is R 0 Footnote 5 . Workers who choose to retire early pay a penalty, λ j , which is determined by the following function
 $$\lambda _j = \left\{ {\matrix{ {a_{16} - a_{17} (\,j - R_0 )} \hfill & {{\rm if}\;j \lt R_1} \hfill \cr 0 \hfill & {{\rm if}\;j \ge R_1} \hfill \cr}} \right.$$
where a 16 and a 17 are parameters, which we choose to replicate the Spanish early retirement penalties.
Retirement Pensions. In Spain in 2010, at least 15 years of contributions were required to be entitled to receive a contributive retirement pension. In general, these pensions were incompatible with labor income. The method used to calculate the pensions was earnings-based. Pension benefits depended both on the amounts contributed and on the number of years of contributions. If the number of years of contributions was equal to 15, the pension was 50% of the regulatory base. This percentage increased by 3 percentage points for each one of the next 10 years of contributions and by 2 percentage points for each one of the following 10. Each year worked after age 65, increased this percentage in 2 or 3 points depending on the length of the contributory careerFootnote 6 .
In 2010 the regulatory base was defined as the average labor earnings of the last 15 years before retirement. Labor income earned in the last two years prior to retirement entered the calculation in nominal terms. The labor earnings of the remaining years were revaluated using the rate of change of the Spanish Consumer Price Index.
In 2010 in Spain pensions were calculated using the following formula:
 $$p_t = \varphi (N)(1.03)^v (1 - \lambda _j )\displaystyle{1 \over {N_b}} \sum\limits_{t = j - N_b} ^{\,j - 1} \min \{ y_t^l, y_{max, t} \} $$
In this formula, function φ(N) denotes the pension system's replacement rate, which depends on N, the number of years of contributions, in a way that we have described above; parameter v denotes the number of years that the worker remains in the labor force after reaching the normal retirement age; parameter N b denotes the number of consecutive years immediately before retirement that are used to compute the retirement pension; and y max denotes the maximum covered earnings.
In our benchmark model economy we calculate the retirement pensions using the following formula:
 $$p_t (b_t ) = \varphi (1.03)^v (1 - \lambda _j )b_t $$
Expression (8) replicates most of the features of Spanish retirement pensions. The main difference is that in our model economy the pension replacement rate is independent of the number of years of contributions. We abstract from this feature of Spanish pensions because it requires an additional state variable and because, in our benchmark model economy, 99.6% of all workers aged 20–64 choose to work in our calibration year. This suggests that, in our model economy, the number of workers who would have been penalized for having short working histories is very smallFootnote 7 .
Minimum and maximum pensions. Spanish pensions are bound by a minimum and a maximum pension. Minimum pensions depend the pensioner's age and on the composition of her household. When an eligible person's entitlement is smaller than the minimum pension and she has no other resources, the system tops up her entitlement until it reaches the value of the minimum pension. In 2010 the minimum yearly pension was 10,152.8 euros for pensioners over age 65 with a dependent spouse, and the maximum yearly pension was 34,526.8 euros. Our model economy replicates this feature. Formally, we require that p 0t ≤ p t ≤ p mt , where p 0t denotes the minimum pension and p mt denotes the maximum pension.
Pension rights. In our model economy we choose the law of motion of pension rights so that it replicates the rules used to calculate pensions in Spain. Formally, the pension rights evolve according to the following expression:
 $$b_{t + 1} = \left\{ {\matrix{ 0 \hfill & {{\rm if}\;j \lt R_0 - N_b} \hfill \cr {\displaystyle{{(b_t + \min \{ y_t^l, y_{\max, t} \} )} \over {[\,j - (R_0 - N_b - 1)]}}} \hfill & {{\rm if}\;R_0 - N_b \le j \lt R_0, } \hfill \cr {\displaystyle{{[b_t (N_b - 1) + \min \{ y_t^l, y_{\max, t} \} ]} \over {N_b}}} \hfill & {{\rm if}\;j \ge R_0,} \hfill \cr}} \right.$$
Recall that R 0 denotes the first retirement age and that N b are the number of years of contributions that are taken into account to compute the retirement pension. Therefore until a household reaches age R 0 − N b its contributions are not taken into account to compute its pension rights. Between ages R 0 − N b and R 0, pension rights are the average of the yearly labor income earned since age R 0 − N b . Finally, when a household reach age R 0 its pension rights are its average labor income during the previous N b years.
Disability Pensions. We model disability pensions explicitly for two reasons: because they represent a large share of all Spanish pensions (in 2010, 10.7% of all contributive pensions and 16.5% of the sum of the retirement and disability pensions paid by the Régimen General), and because disability pensions are used as an alternative route to early retirement in many casesFootnote 8 .
The Spanish pension system rules define pensionable income for workers who qualify for a disability pension as the average earnings of the previous 15 years, for workers who are younger than 52, or of the previous 8 years, for workers who are 52 or older, and the standard disability pension is 75% of the pensionable income when the disability is due to an occupational accident or illness. But if the worker is covered by a collective agreement, this percentage can reach the 100% of that amount. Additionally, there are other situations in which disability pensions are only 50% of the pensionable income. In our model economy we use 75% because it is the average share.
To replicate these rules, we assume that there is a minimum disability pension, which coincides with the minimum retirement pension. And that the disability pensions are 75% of the disabled household pension rights. Formally, we compute the disability pensions as follows:
 $$p_t^d (b_t ) = \max \{ p_{0t}, 0.75b_t \}. $$
The Revaluation of Pensions. Until 2012 in Spain minimum and maximum pensions were increased discretionally and all other pensions were revaluated using the consumer price index. In the first decade of the century the Spanish minimum pension has roughly kept up with per capita GDP, and that the maximum pension and normal pensions have decreased as a share of per capita GDPFootnote 9 . In our benchmark model economy we revaluate minimum and maximum pensions with the growth rate of output per capita and we assume that the real value of all other pensions remains unchanged (see Panel C of Figure 2). In 2010 in Spain approximately 23% of the retirees of the Régimen General were paid the minimum pension and 3.3% were paid the maximum pension. That same year in our model economy those numbers were 26.5% and 8.8%Footnote 10 .
The Pension Reserve Fund. Since the year 2000, Spain has had a pension reserve fund, which is invested in fixed income assets and which is financed with part of the pension system surpluses. These assets have been used to finance the pension system deficits when needed. In 2010, the total amount of assets accumulated in the pension reserve fund was 64,375.14 million euros, which corresponded to 6.12% of that year's GDP.
In our model economy, we assume that all the pension system surpluses are deposited into a pension reserve fund, which evolves according to
 $$F_{t + 1} = (1 + r{^\ast})F_t + T_{st} - P_t $$
We require the pension reserve fund to be non-negative. We assume that the pension fund assets are used to finance the pension system deficits and that, when they ran out, the government changes the consumption tax rate as needed to finance the pensions.
2.5 The households’ decision problem
We assume that the households in our model economy solve the following decision problem:
 $$\max E\left\{ {\sum\limits_{\,j = 20}^{100} \beta ^{\,j - 20} \psi _{\,jt} (1 - \phi _{\,jh} ) [c_{\,jht}^\alpha (1 - l_{\,jht} )^{(1 - \alpha )} ]^{(1 - \sigma )} /1 - \sigma} \right\}$$
subject to
 $$c_{\,jht} + a_{\,jht + 1} + \tau _{\,jht} = y_{\,jht} + a_{\,jht} $$
where
 $$\tau _{\,jht} = \tau _k y_{\,jht}^k + \tau _y \left( {y_{\,jht}^b} \right) + \tau _{st} \left( {y_{\,jht}^l} \right) + \tau _{ct} c_{\,jht} $$
 $$y_{jht} = y_{jht}^k + y_{jht}^l + p_t^d (b_t ) + p_t (b_t )$$
 $$y_{\,jht}^k = a_{\,jht} r_t $$
 $$y_{jht}^l = w_t {\varepsilon} _{jh} s_t l_{jht} $$
 $$a_{\,jht} \in A,p_t (b_t )\quad {\rm and}\quad p_t^d (b_t ) \in P_t, s_t \in \omega \quad {\rm for}\;{\rm all}\quad t,\quad {\rm and}\quad a_{\,jh0} \;{\rm is}\;{\rm given},$$
and where function τ
y
is defined in expression (3), variable
 $y_{jht}^b $
is defined in expression (4), function τ
s
is defined in expression (5), function p is defined in expression (8), the law of motion of b
t
is defined in expression (9), and function p
d
is defined in expression (10).
In these expressions, subscripts j and h denote a household's age and its education level, β > 0 denotes the time-discount factor; ψ jt denotes the conditional probability of surviving from age j to age j + 1; ϕ jh denotes the disability shock faced by able-bodied workers; c jht > 0 denotes consumption; 1 is the normalized endowment of productive time; 1 ≥ l jht ≥ 0 is labor hours; a jht denotes assets; τ ct is the consumption tax rate; and sets A, P t , and ω are finite.
Notice that every household can earn capital income, only workers can earn labor income, only disabled households receive disability pensions, and that only retirees receive retirement pensions. Consequently, the optimal labor hours of disabled households and retirees are zero. As we have already mentioned, an important feature of the households' decision problem that we have omitted in our formal description of the households' decision problem is that they decide optimally when to retire taking into account all the benefits and costs of continuing to work, once they have reached the early retirement age, R 0.
2.6 Equilibrium
A detailed description of the equilibrium process of this model economy can be found in the technical appendix to this paper that is available at http://www.javierdiazgimenez.com/res/PEN3-APP.pdf.
2.7 Calibration
To calibrate our model economy we do the following: first, we choose a calibration target country – Spain in this paper – and a calibration target year – 2010 in this paper. Then we choose the initial conditions and the parameter values that allow our model economy to replicate as closely as possible selected macroeconomic aggregates and ratios, distributional statistics, and the institutional details of our chosen country in our target year.
More specifically, to characterize our model economy fully, we must choose the values of 5 initial conditions and 50 parameters. To choose the values of these 50 parameters, we need 50 equations or calibration targets. We determine the values of 31 of those parameters directly because that involve either one parameter only, or one parameter and our guesses for the values of aggregate capital or aggregate labor. To determine the values of the remaining 19 parameters, we solve a system of 19 non-linear equations. We describe these steps and our computational procedure in the technical appendix to this paper that can be found at http://www.javierdiazgimenez.com/res/PEN3-APP.pdf.
2.8 The benchmark model economy
In this section we show that our calibrated, benchmark model economy replicates reasonably well most of the Spanish statistics that we target in our calibration procedureFootnote 11 .
Aggregates and Ratios. In Table 1 we report the macroeconomic aggregates and ratios in Spain and in our benchmark model economy for 2010. We find that our benchmark model economy replicates most of the Spanish targets almost exactly. The largest relative difference is in the income tax collections to output ratio, which is approximately 0.3 percentage points higher in the model economy.
Macroeconomic aggregates and ratios in 2010 (%)

1 Variable Y* denotes GDP at market prices.
2 The target for K/Y* is in model units and not in percentage terms.
3 Variable l denotes the average share of their disposable time that the households allocate to the market.
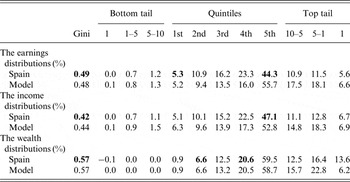
Earnings, Income, Wealth and Pension Inequality. In Table 2 we report the Gini indices and selected points of the Lorenz curves for earnings, income, and wealth in Spain and in our benchmark model economy. The statistics reported in bold face are our eight calibration targets. The source for the Spanish data on earnings, income and wealth is the 2004 Financial Survey of Spanish Families, as reported in Budría and Díaz-Giménez (Reference Budría and Díaz-Giménez2006). The model economy statistics correspond to 2010.
The distributions of earnings, income, and wealth 1

1 The source for the Spanish data of earnings, income, and wealth is the 2004 Encuesta Financiera de las Familias Españolas as reported in Budría and Díaz-Giménez (Reference Budría and Díaz-Giménez2006). The model economy statistics correspond to 2010. The statistics in bold face have been targeted in our calibration procedure.
We find that our model economy replicates the Spanish Gini indices of earnings, income and wealth reasonably well – the largest difference is only 0.02. When we compare the various quantiles of the distributions, we find that the model economy households in the first four quintiles of the earnings distribution earn less than the Spanish households and that the households in the top quintile earn sizeably more – their share of earnings is almost 12 percentage points higher than the Spanish share. In contrast, our model economy replicates the Spanish wealth distribution very closely. And, predictably, the income distribution is in between the other two – for instance, the share of income earned by the households in the top quintile of the model is almost 6 percentage points larger than the Spanish share, which is almost half way between 12 and −1.
When we look at the top tails of the distributions we find that the share of wealth owned by the top 1% of the wealth distribution is 7.4 percentage points higher in Spain. This disparity was to be expected, because it is a well-known result that overlapping generation model economies that abstract from bequests fail to account for the large shares of wealth owned by the very richest households in the dataFootnote 12 .
Moreover, our model economy also comes close to replicating the Gini index of pensions. According to Conde-Ruiz and Profeta (Reference Conde-Ruiz and Profeta2007), in 2000 this number was 0.32 in Spain and in our model economy it is 0.36 in our calibration year. Once again, this result can be interpreted as an overidentification condition, since we did not use it as a calibration target.
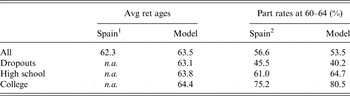
Retirement behavior. In Table 3 we report the average retirement ages and the participation rates of people aged from 60 to 64. The average retirement age in our model economy is 63.5 years, 1.2 years higher than in Spain. We also find that the average retirement ages are increasing in the number of years of education. Unfortunately, we could not find these data for Spain, but we think that this increasing relationship is very plausible, since the Spanish participation rates of the 60–64 age cohort are strongly increasing in education (see the third column of Table 3).
Retirement ages and participation rates of older workers

1 The Spanish data is for both males and females in 2010 (Source: Eurostat).
2 The Spanish data is from both the Encuesta de la Población Activa, and the Encuesta de Empleo del Tiempo 2010, excluding the unemployed and non-participants who do not collect either retirement or disability pensions.
The total participation rate of the households in the 60–64 age cohort is 53.5% in our model economy, and 56.6% in Spain. As we have already mentioned, the participation rates both in Spain and in our model economy are increasing in education. This is mainly because, even though all educational types value leisure equally, the foregone labor income – which is the opportunity cost of leisure – is lower for less educated workers and, therefore they tend to retire earlier. Our model economy replicates this behavior even though it has fewer labor market categories than Spain. In Spain people of working age can be employed, unemployed, retired, disabled, and other non-participants. In our model economy, we abstract from the unemployed and from the other non-participants.
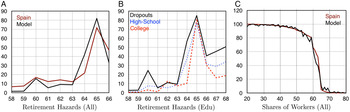
In Panel A of Figure 1 we illustrate the age-profiles of the retirement hazards. The Spanish profile, which displays a small peak at the early retirement age and a much larger one at the normal retirement age, is a common stylized fact in countries that run defined-benefit pension systems (see Gruber and Wise, Reference Gruber and Wise1999). At first sight, our model economy replicates this pattern. A closer scrutiny reveals that the hazard is 10 percentage points higher in our model economy at age 65.
(Colour online) Retirement Hazards and Shares of Workers (%)*. (A) Retirement hazards (all); (B) retirement hazards (Edu); (C) shares of workers (all). *The Spanish data for the retirement hazards is taken from García Pérez and Sánchez-Martín (Reference García Pérez and Sánchez-Martín2010). The shares of workers are the shares of workers in the sum of workers, disabled people, and retirees. We compute this share for Spain from the Encuesta de Empleo del Tiempo (2010), reported by the INE.

In Panel B of Figure 1 we show that high-school dropouts have a higher probability to exit the labor force at age 60 than more educated workers. Our results show that in our model economy 90% of those who retire at 60 are dropouts. This finding is consistent with those of Sánchez-Martín (Reference Sánchez-Martín2010), who reports that low-income workers have a higher probability of retiring at age 60 than high-income workers.
The details of the Spanish minimum retirement pension are one of the reasons behind this result. In 2010, about 27% of the Spanish retirees receive the minimum retirement pension – this share is 26% in our model economy. Workers who qualify for the minimum pension can start to collect it at 60 without paying an early retirement penalty. Moreover, for many of these workers, remaining in the labor force after age 60 does not increase their pensions. Since many of these typically low-wage earners gain very little from continued employment, many of them choose to retire as early as possible. In our model economy, 97% of the workers who retire at age 60 collect the minimum pension, while Jiménez-Martín and Sánchez-Martín (Reference Jiménez-Martín and Sánchez-Martín2006) report that in 1997 this number was 67% in Spain.
Retirement hazards are lower between ages 60 and 63, both in Spain and in our model economy. This is because workers who qualify to collect a pension that is higher than the minimum pension and who choose to work for 1 extra year after age 60 reduce the early retirement penalty by 8%. This means that these workers face an implicit subsidy if they continue to work between ages 60 and 64, and this subsidy may amount to as much as 25% of their net yearly salary, as shown by Boldrin et al. (Reference Boldrin, Jiménez and Peracchi1997)Footnote 13 .
This behavior changes at age 65. This is because the incentives provided by the Spanish pension system to delay retirement beyond this age are small relative to the reduction in pension rights that results from the downward sloping life-cycle profile of earnings. Therefore, most workers who continue to work after age 65 face an implicit tax on doing so and many choose to leave the labor force at 65 to avoid this tax. Finally, Boldrin et al. (Reference Boldrin, Jiménez and Peracchi1997), Argimón et al. (Reference Argimón, Botella, González and Vegas2009), and Sánchez-Martín (Reference Sánchez-Martín2010) find that the probability of retiring at age 65 is independent of salary level, and our model economy replicates this stylized fact. Panel B of Figure 1 shows that retirement hazards at 65 are similar for the three educational groups, and that they are larger than 77% for all of them.
In Panel C of Figure 1 we report the shares of workers in the sum of workers, disabled people, and retirees. We find that the age distribution of this ratio is almost identical in Spain and in the benchmark model economy.
Overall, we find these results very encouraging. A trustworthy answer to the questions that we ask in this paper requires a model economy that captures the key institutional and economic forces that affect the retirement decision. Our model economy replicates in great detail both the Spanish tax system and the rules of the Spanish public pension system. Moreover, our calibration procedure allows us to obtain an earnings process that allows us to replicate the earnings, income and wealth inequality observed in Spain. And we have just shown that our model economy replicates many of the features of retirement behavior found in Spanish data. This result is particularly remarkable, since we did not target explicitly any of these retirement behavior facts in our calibration procedure.
3 Pension reforms
Between 2011 and 2013 the Spanish government approved two major pension system reforms. In this section we describe these reforms, we show how we implement them in our model economy, and we describe the demographic, educational, growth, inflation rate, and fiscal policy scenarios that we use in our simulations.
3.1 Pension reforms in Spain
The 2011 Reform. The 2011 Reform of the Spanish pension system changed three of its main parameters. It extended the number of years of earnings used to compute the retirement pension from the last 15 to the last 25 years before retirement. With some exceptions, it delayed the early retirement age from 61 to 63, and it delayed the normal retirement age from 65 to 67. The extension of the number of years used to compute the pensions was phased in gradually, increasing that number in 1 year per year. It started in 2013 and it will end in 2022. The delay in the early retirement age was immediate, and the delays in the normal retirement were gradual: 1 month per year between 2013 and 2018, and 2 months per year between 2019 and 2027. Consequently, the normal retirement age in Spain will be 66 in 2021 and 67 in 2027.
The 2013 Reform. The 2013 Reform of the Spanish pension system introduced three additional changes: it delayed the early retirement age from 63 to 65 yearsFootnote 14 , it introduced a Sustainability Factor, and it introduced a Pension Revaluation Index (PRI). The purpose of the sustainability factor is to adjust the pensions with the life-expectancy at retirement so that the life-time cost of retirement is approximately the same for every cohort. The purpose of the PRI is to reduce the real value of pensions as needed to adjust the pension system outlays to its revenues smoothly over the business cycle.
The Sustainability Factor. The specific formula that was finally adopted for this factor is the following:
 $$SF _t = \varepsilon \;SF _{t - 1} $$
where ε is a time-varying measure of the relative life-expectancy at age 67. Specifically, for the period 2019–2023 the value of ε will remain constant at
 $$\varepsilon = \left[ {\displaystyle{{e_{67,2012}} \over {e_{67,2017}}}} \right]^{1/5} $$
In this expression variable e 67,t denotes the life expectancy at age 67 in year t. For the period 2024–2028 the value of ε will be updated to
 $$\varepsilon = \left[ {\displaystyle{{e_{67,2017}} \over {e_{67,2022}}}} \right]^{1/5} $$
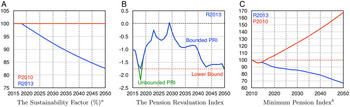
and so on. The sustainability factor will be applied for the first time in 2019, and it will apply to new pensions only. In Panel A of Figure 2 we represent the values of the sustainability factor that we have computed using the 2012 mortality tables. It turns out that, by 2050 the sustainability factor alone will have reduced the real yearly value of Spanish new pensions in 17.4 percentage points.
(Colour online) The Revaluation of Pensions in Model Economies P2010 and R2013. (A) The sustainability factor (%) a ; (B) the PRI; (C) minimum pension index b. a This panel plots the results of applying the sustainability factor to the initial pension of a retiree whose pension claims are worth 100 in real terms. b This panel plots the revaluation of minimum and maximum pensions. The real value of all other pensions does not change.

The Pension Revaluation Index (PRI). The specific formula that was finally adopted for this factor is the following:
 $$g_{t + 1} = \overline g _{c,t + 1} - \overline g _{\,p,t + 1} - \overline g _{s,t + 1} + \alpha \left( {\displaystyle{{R_{t + 1}^{^\ast} - E_{t + 1}^{^\ast}} \over {E_{t + 1}^{^\ast}}}} \right)$$
where
 $\overline {x_t} $
indicates the moving arithmetic average of variable x
t
computed between t − 5 and t + 5, x* indicates the moving geometric average of variable x
t
computed between t − 5 and t + 5, g
c,t+1 is the growth rate of the pension system revenues, g
p,t+1 is the growth rate of the number of pensions, g
s,t+1 is the growth rate of the average pension due to the substitution of old pensions by new pensions, 0.25 ≤ α ≤ 0.33 is an adjustment coefficient, R
t+1 denotes the pension system revenues, and E
t+1 denotes pension system expenditures. Finally, the PRI has two bounds. The lower bound is 0.25% and the upper bound is 0.5% plus the inflation rate. In Panel B of Figure 2 we plot the PRI that we obtain in Model Economy R2013. And in Panel C of Figure 2 we plot the minimum pensions of Model Economies 2010 and R2013. In Model Economy P2010 we revaluate minimum pensions with per capita output at market prices and in Model Economy R2013 we revaluate them using the PRI.
We find that the PRI is always negative between 2015 and 2050, with the only exception of 2029. Between 2015 and 2018, the PRI decreases to smooth out the hike in pension expenditures that results from the generous revaluation of 2014 (1.35%). Between 2019 and 2023, the PRI increases because pension expenditures fall as the 2013 reforms are being phased in. After that year the PRI becomes increasingly negative because the baby boom cohorts start to retire. In 2029, the PRI spikes up because that is the first year in which the increase in pensions expenditures that results from the anticipation of the 2024 delay in retirement ages does not enter into the 5 year moving average. After that year, the PRI becomes more negative because the baby boom cohorts are moving in full into retirement and the PRI must compensate for the fact that the reforms have been fully implemented and, consequently the pension cuts that they bring about have disappearedFootnote 15 .
3.2 Pension reforms in the model economy
We use our model to simulate two economies that differ in their pension systems only. In the first model economy, which we label P2010, we replicate the pension system parameters that prevailed in Spain in 2010. In the second model economy, which we label R2013, we replicate the 2011 and 2013 Spanish pension system reforms.
Model Economy P2010. This model economy replicates the values of parameters of the Spanish pay-as-you-go, defined benefit pension system that prevailed in Spain in 2010. Specifically, the early retirement age is R 0 = 60, the normal retirement age is R 1 = 65, and pension rights are computed taking into account the last 15 years of contributions previous to retirement. We keep these parameter values constant throughout our simulation with only one exception: we delay the early retirement age to R 0 = 61 in 2015. This change is in line with what is happening in Spain as a result of regulatory changes enacted before 2010. We also revaluate the minimum and the maximum pensions so that their share of output per person remains constant at 2010 value, and we assume that the real value of all other pensions does not change (see Panel C of Figure 2).
Model Economy R2013. In Model Economy R2013 we model the Spanish 2011 and 2013 pension system reforms that we have described above: we extend the number of years of earnings that we use to compute the pensions, we delay the retirement ages, and we apply the PRI and the sustainability factor.
We extend the number of years of earnings that we use to compute the pensions, from the 15 years previous to retirement in 2012 to 25 in 2022, at a rate of 1 year every year. In 2012 we delay the early retirement age from 60 to 61; in 2018 we delay the early retirement age from 61 to 62 and the normal retirement age from 65 to 66; and in 2024 we delay them again to 63 and to 67. Finally, we apply the PRI from 2014 onwards and the Sustainability Factor from 2019 onwards. Since in our model economy pensions are defined in real terms, we modify the Spanish PRI bounds subtracting an estimate of the inflation rate, according to the inflation rate scenario that we describe below. In Panels A and B of Figure 2 we plot the Sustainability Factor and the Pension Revaluation Indexed that obtain in our R2013 Model Economy and that we have computed following the Spanish rules.
3.3 The simulation scenarios
The benchmark and the reformed model economies share the initial conditions described in Section 2.7 and the demographic, educational, growth, inflation rate, and fiscal policy scenarios that we now describe.
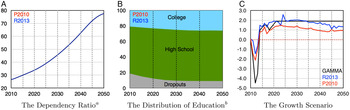
The Demographic Scenario. The demographic scenario of our two model economies replicates the demographic projections for Spain for the period 2010–2052 estimated by the Instituto Nacional de Estadística (INE) in 2012Footnote 16 . In Panel A of Figure 3 we plot the changes in the 65+ to 20–64 dependency ratio shared by Model Economies P2010 and R2013. This ratio increases from 26.5 in 2010 to 77.6 in 2050. In the on-line technical appendix we describe in detail the procedure that we use to compute the age distribution of the households in the model economy from the INE's projections.
(Colour online) The simulation scenarios in Model Economies P2010 and R2013. (A) The dependency ratio a ; (B) the distribution of education b ; (C) the growth scenario. a This is the ratio between the number of households in the 65+ age cohort and those in the 20–64 age cohort. b This is the distribution of education of the households in the 20–64 age cohort.

The Educational Scenario. The initial educational distribution of our two model economies replicates the educational distribution of the Spanish population in 2010, as reported by the INE in 2012. After 2010, we assume that the educational shares for the 20-year old entrants are 8.65%, 63.53%, and 27.82% forever. Those shares are the educational shares of the most educated cohort ever in Spain, which corresponds to the 1980 to 1984 cohortFootnote 17 . In Panel B of Figure 3 we plot the changes in the distribution of education shared by Model Economies P2010 and R2013. The shares of drop-outs, high school graduates, and college graduates change from 18.7%, 60.6%, and 20.7% in 2010 to 8.9%, 65.1%, and 26.0% in 2050. We assume that the educational shares of the immigrants of age j that enter the economies in period t replicate those of the residents of age j − 1 in period t − 1.
The Growth Scenario. Between 2010 and 2014 the growth rates of output at market prices in our model economy target the growth rates of Spanish GDP, which were 0.2%, −0.6%, −1.9%, −0.6%, and 1.4%. For 2015, we target a growth rate of 1.7%. This was the growth forecast for Spain published by the International Monetary Fund in its October 2014 World Economic Outlook.
In our model economies there are three sources of output growth: changes in the labor-augmenting productivity factor, γ t , which are exogenous, demographic and educational changes, and changes in labor hours and savings brought about by changes in prices and pensions, which are endogenous.
To replicate the growth scenario described above, we choose a sequence of γ's that gives us reasonable approximations to our targeted growth rates. From 2021 onwards, we assume that γ grows at a constant rate of 1.9%. This choice and the endogenous responses result in growth rates of output that are decreasing for the period, and that average about 1.5% (see Panel C of Figure 3).
The Inflation Rate Scenario. The exogenous yearly inflation rates in our model economy for the 2010–16 period are 1.8%, 3.2%, 2.4%, 1.4%, −1.1%, 1.4%, and 2%. Between 2010 and 2013, the inflation rate is irrelevant because the PRI only applies from 2014. After 2016 we assume that the inflation rate in our model economy is 2% because that is the inflation rate targeted by the European Central Bank. This inflation rate scenario has three implications: first, since in 2014 the Spanish government increased the nominal value of pensions by 0.25% the value of the PRI that year was 1.35% [=0.25−(−1.10)]; second, the real value of the lower bound of the PRI is −1.15% (=0.25 − 1.40) for 2015 and −1.75% (=0.25 − 2.00) thereafter; and, third, the real value of the upper bound of the PRI from 2015 onwards is 0.5%.
The Fiscal Policy Scenario. Recall that the consolidated government and pension system budget constraint in our model economy is
 $$G_t + P_t + Z_t = T_{kt} + T_{st} + T_{yt} + T_{ct} + E_t + [F_t (1 + r{^\ast}) - F_{t + 1} ]$$
In this expression G t is exogenous and the remaining variables are endogenous. In Model Economies P2010 and R2013 the capital income tax rates and the parameters that determine the payroll tax function and the household income tax function are identical and they remain unchanged at their 2010 values. The consumption tax rates differ across both economies because we change them to finance the pensions once the pension reserve fund is exhausted. Every other variable in Expression (23) varies in time and differs across both economies because they are all endogenous.
For a detailed account of our calibration of G
2010 see the on-line Technical Appendix that can be found at http://www.javierdiazgimenez.com/res/PEN3-APP.pdf. To determine the value of G
t
for t > 2010, in Model Economy P2010 we assume that
 $G_t /Y_t^{\ast} $
, for t > 2010, is constant at its t = 2010 value, and we assume that Model Economy R2013 shares the {G
t
} sequence of the Model Economy P2010. These assumptions imply that the
 $G_t /Y_t^* $
ratios differ somewhat in both economies.
Reform Announcement. Finally, we assume that the pension system reforms were announced at the beginning of 2011, and that they affect every household that had not retired by the end of that year.
3.4 Simulation results
We simulate these two model economies using the demographic, educational, and economic scenarios that we have described in Section 3.3 and we illustrate the main results of our simulations in Figure 4.
(Colour online) The Future of the 2010 Pension System and of the 2013 Reforms. (A) Pension system deficit*; (B) pension system debt*; (C) consumption tax rate (%); (D) payroll tax revenues*; (E) pension expenditures*; (F) average pension index; (G) average earnings 60–64 index; (H) pension substitution rate (%) a ; (I) output index; (J) capital index; (K) labor input index b ; (L) capital-labor ratio index. *These statistics are expressed as a percentage of output. a This statistic is the ratio between the average pension and the average wage of workers in the 60–64 age group. b This measure of the labor input does not include the exogenous, labor-augmenting productivity factor, A.

The Sustainability of the 2010 Pension System. Our simulations show that the pay-as-you-go, defined benefit pension system that prevailed in Spain in 2010 was completely unsustainable. We find that the pension system deficit would have reached 12.2% of GDP by 2050 (see Panel A of Figure 4), that the pension reserve fund would have run out in 2016, and that the accumulated pension system debt, would have reached 290% of GDP that same year (see Panel B). In 2050, the consumption tax rate that would have been necessary to finance Spanish pensions would have been 47.9% (see Panel C).
As in the rest of the Spanish pension reform literature, we also find that these sustainability problems were structural. We reach this conclusion because the pension deficits are due to the increase in pension expenditures, which are essentially unrelated to the 2008 recession. Specifically, we find that, while the pension system revenues remain virtually unchanged the pension system expenditures almost double – in Model Economy P2010 payroll tax revenues are 11.1% of GDP in 2010 and 10.1% in 2050 (see Panel D), and pension expenditures are 11.3% of GDP in 2010 and 22.2% in 2050 (see Panel E)Footnote 18 . Moreover, our simulations show that the ratio of pension expenditures to output increases little until 2017 and that it increases steeply after that year, when the baby-boomers of the end of the 1950s start to retire.
Pension expenditures increase for four reasons: because longevity increases, because cohort size increases, because households become more educated, and because labor earnings increase. According to the INE's 2012 demographic scenario, life-expectancy at age 65 was 17.4 years in 2010 and it will be 23.4 years in 2050. The share of Spanish residents aged 65 or more was 20.9% in 2010 and it will be 43.6% in 2050. The share of Spanish workers who had completed college was 20.7% in 2010 and it will be 26.0% in 2050. And the real value of hourly wages in hour model economy was 1.33% in 2010 and will be 2.33% in 2050. These changes imply that, in Model Economy P2010, the average pension is 71% higher in 2050 than in 2010 (see Panel F), while output is only 43% higher (see Panel I).
The Sustainability of the 2013 Pension System. The reform improves the sustainability of the public pension system rather dramatically. In 2050 the pension system deficit decreases from 12.2% of output in Model Economy P2010, to 0.6% in Model Economy R2013 (see Panel A of Figure 4). Resulting from this improvement, the accumulated pension system debt decreases from 290% of output to 9% (see Panel B of Figure 4), and the consumption tax rates needed to finance the pension system deficits decrease from 47.9% to 22.6% (see Panel C of Figure 4).
The Consequences for Public Pensions. This improvement in the sustainability of public pensions is brought about with large reductions in the average pension. In 2050 the average pension index reaches 172 in Model Economy P2010 and only 120 in Model Economy R2013 (see Panel F of Figure 4). Moreover, the relative real value of the average pension in Model Economy R2013 is decreasing from 2016 onwards and it reaches 70% of the real value of the average pension in Model Economy P2010 in 2050.
The pension replacement rate also decreases substantially. In 2010 the average pension amounts to 50.5% of the average earnings of the 60–64 age group in both model economies. In contrast, in 2050, this rate is 40.7% in Model Economy P2010, and 28.0% in Model Economy R2013 (see Panel H of Figure 4). Most of this difference is accounted for by the reduction in the average pension, because the average earnings of the 60–64 age group are very similar.Footnote 19 In 2050 the value of the index of earnings is 215 in Model Economy P2010 and 219 in Model Economy R2013 (see Panel G of Figure 4). The Sustainability Factor and the PRI play a very large role in this reduction of the average pension. If we exclude them, the average pension falls by about 7% in 2050.
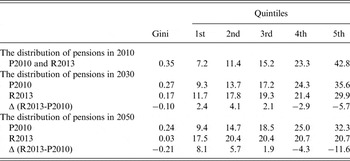
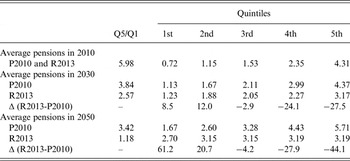
The Distribution of Pensions Cuts. As we have already discussed, the 2013 Reforms recover the sustainability of the pension system reducing the value of pensions. In this section we discuss the distributions of these pension cuts. To this purpose, we compute the distributions of pensions of the new retirees in 2010, 2030 and 2050. We also report the average values of the average pensions of the various new pension distribution quantiles.
In Table 4 we report the Gini indexes and selected points of the Lorenz curves of the distributions of the pensions of new retirees in 2010, 2030, and 2050. We find that new pension inequality decreases (a) moderately as a result of the demographic and educational transitions and (b), spectacularly as a result of the 2013 reforms. The changes in Model Economy P2010 quantify the impact of the demographic and educational transitions. These changes reduce the Gini indexes of new pensions from 0.35 in 2010, to 0.27 in 2030, and to 0.24 in 2050. On top of that, the 2013 reforms reduce the Gini index of new pensions from 0.35 to 0.17 and to a negligible 0.03. The changes in the distributions of hours and retirement rates brought about by the pension cuts, and the large reductions in maximum pensions, make the inequality in pensions almost disappear. To make up for their lower pensions, high school dropouts increase their labor hours and delay the retirement rates so much that by 2050 the differences in the shares of pensions collected by the bottom quintile of the distribution (17.5%) and the top quintile of the distribution (20.7%) are tiny.
The Lorenz curves of the distributions of new pensions

In Table 5 we report the average pensions of the quantiles of the distributions of the pensions of the new retirees in 2010, 2030, and 2050. Not surprisingly our results are consistent with the results that we have reported above. In the second column of that table we report the ratios of the average pensions of the Top and the Bottom quintiles. In 2010 this ratio is 5.98 in both model economies. In 2030 this ratio falls to 3.84 in Model Economy 2010 as a result of the transitions and to 2.57 in Model Economy R2013 as a result of both the transitions and the reforms. By 2050 the transitions are close to completion but the reforms reduce the ratio further to 1.18 in Model Economy R2013. We also find that the 2013 Reforms increase the average pensions of the bottom two quintiles and that they decrease the average pensions of the top three quintiles.
Average pensions of the Quantiles of the distributions of new pensions

The Consequences for Private Pensions. Savings and, consequently, capital accumulation increase substantially in the two model economies but at different rates (see Panel J of Figure 4). And a large share of these differences are accounted for by the increase in savings for retirement brought about by the reduction in pensions and by the longer careers. In that panel we show that the capital stock index in Model Economies Reform is 36.6 percentage points higher than in Model Economy P2010 in 2050.
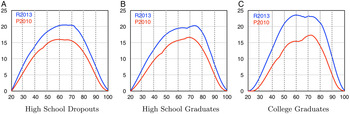
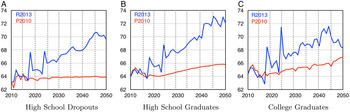
In Figure 5 we show the optimal savings profiles in Model Economies R2013 and P2010 for the education groups in 2050. The three groups increase their optimal savings at all ages. The average differences in the asset holdings of the households in the 40–80 age cohort are 28.2% for high school dropouts, 28.2% for high school graduates, and 51.3% for college graduates.
(Colour online) Average Assets per Age in 2050 in the Model Economies. (A) High school dropouts; (B) high school graduates; (C) college graduates.

Retirement Behavior. In Figure 6 we plot the changes in the average retirement ages of the education types in Model Economies P2010 and R2013. First note that in Model Economy P2010 the average retirement ages increase for the three education types. This is because wages increase both because the capital-labor ratio increases and because labor productivity grows. And these two changes reduce the number of early retirees.
(Colour online) Average Retirement Ages (years). (A) High school dropouts; (B) high school graduates; (C) college graduates.

The 2013 reforms delay retirement further. Part of this delay is forced since the legal retirement ages are delayed, and part of it is voluntary because workers choose to increase the duration of their working lifetimes to increase their savings to make up for their reduced retirement pensions. Consequently, the average retirement age increases for the three educational types. The spikes in Figure 6 correspond to the delays in the legal retirement ages that take place in 2018 and in 2024. Figure 6 also shows that high school dropouts and high school graduates delay their retirement substantially, because these two educational groups are affected the most by the large cuts in minimum pensions.
Macroeconomic Consequences. The longer working careers increase the average labor input. In 2050 it is 22.8% higher after the reform (see Panel K of Figure 4). The capital input increases because the working lifetime increases and because pensions are lower. In relative terms the increase in capital dominates and the capital to effective labor ratio (K/AL) is 11.2% larger in the reformed economy in that same year (see Panel L of Figure 4). Therefore, as Panel I of Figure 4 shows, the 2013 pension reforms are expansionary. In 2050 the output index of Model Economy R2013 is 28.4 percentage points higher than in Model Economy 2010. And the average yearly geometric growth rates of the two model economies are 1.48% and 0.87%.
4 Welfare
To quantify the welfare effects of the 2013 Reforms, we use a consumption equivalent variation measure (CEV). Specifically, we compute the percentage change in a household's lifetime consumption that equates its expected lifetime utility in Model Economies P2010 and R2013. We start our computations in 2011, which is the year when the reforms are announced, and we compute the CEV measure for all the households who are alive that year, and for those who enter the economy between 2012 and 2070. Since we assume that new-entrants are 20 years-old, these households would have been born between 1992 and 2050.
Formally, we do the following: Let
 $z \in {\frak R} = J \times H \times {\rm {\cal E}} \times {\rm {\cal A}} \times B_t \times P_t $
. Then, we define v
B
[z, Δ(z)] as the equilibrium value function of a household of type z in Model Economy P2010, whose equilibrium consumption allocation is changed by a fraction Δ every period and whose leisure remains unchanged. Then, for the households alive in 2011:
 $$v^B [z,\,\Delta (z)] = \max E\left\{ {\sum\limits_{t = 0}^{100 - j} \beta ^t \psi _{\,j + t,2011 + t} (1 - \phi _{\,j + t,h} ) u\left[ {c_{2011 + t}^B (z)[1 + \Delta (z)],\left( {1 - l_{2011 + t}^B (z)} \right)} \right]} \right\}$$
where c B (z) and l B (z) are the solutions to the household decision problem.
For a household born in year t, who enters to the economy in year t + 20:
 $$v^B [z,\,\Delta (z)] = \max E\left\{ {\sum\limits_{\,j = 20}^{100} \beta ^{\,j - 20} \psi _{\,j,t + j} (1 - \phi _{\,jh} ) u\left[ {c_{t + j}^B (z)[1 + \Delta (z)],\;\left( {1 - l_{t + j}^B (z)} \right)} \right]} \right\}$$
Then Δ(z) is the number that solves
 $$v^B [z,\,\Delta (z)] = v^R (z)$$
where v R (z) is the value of the optimal consumption and leisure allocations in the reformed model economyFootnote 20 .
Results. In Figure 7 we report the results of our welfare comparisons for the households who are born between 1910 and 2050 and we give additional details for the cohorts who were alive in 2011 when the reforms were announcedFootnote 21 . A useful way to think about our welfare comparisons is to interpret them as an exercise in optimal taxation that trades off pensions and leisure against the consumption taxes needed to finance them. In Model Economy 2010 pensions, leisure and consumption taxes are higher and in Model Economy 2013, they are lower. It turns out that the model economy households prefer the higher pensions. Consequently this trade-off is negative for most of the households and the 2013 reforms bring about welfare losses for almost everyone.
(Colour online) The Welfare Costs of the Reform (CEV, %). (A) All households (year of birth); (B) households alive in 2011 (year of birth).

In Panel A of Figure 7 we plot the welfare gains and losses for all the households born between 1910 and 2050. The households born before 1921 are better off with the reforms because the PRI applies from 2015 onwards, when their life expectancy is small, and because they benefit from the short run increase in the interest rate. Welfare losses are increasing in age for the households born between 1921 and 1955. This is because for the retirees in this group, the costs imposed by the reductions in pensions that result from the PRI and by the lower interest rates more than compensate from the welfare gains that arise from the lower consumption tax rate. And for the workers in this group, their working-lives are longer, their leisure time is shorter, and their future pensions are smaller and because the general equilibrium effects of the reform are not enough to compensate for all these costs.
Next, welfare losses decrease for the households born after 1955 because, even though the reforms will be fully implemented when they retire, they have had almost their entire working-life to reoptimize their life-cycle decisions and to smooth out their effects. Finally, the welfare losses increase again for the households who are born after 2000. This is because of the very low minimum pensions brought about by the reforms in the long run. Therefore these households, besides working longer hours, retiring later, and collecting reduced pensions, lose almost entirely the insurance provided by the disability pensions – which coincide with the minimum pensions – if they happen to become disabled.
In Panel B of Figure 7 we plot the welfare losses of the households who were alive in 2011 partitioned by their labor status and identified by their year of birth. Within this age group, the households born between 1958 and 1960 bear the highest average welfare losses, equivalent to 15.9% of consumption. This is because the increases both in the legal retirement ages and in the number of years of contributions used to compute the pension will be fully implemented when they exit from the labor market. The costs born by older cohorts are smaller because the reforms are implemented gradually. The costs born by younger cohorts are also smaller because, even though they retire after the reforms are fully implemented, they have more time to reoptimize their labor and savings decisions.
We find that the disabled households born between 1960 and 1990 are the ones who suffer the highest losses. These losses are increasing and they range from −20.1% of consumption for the disabled households born in 1960 to −48.1% for the households born in 1990. This is because the young disabled households have to make do with a reduced disability pension for longer and because they have had less time to save in order to complement their pensions. Moreover, older disabled households suffer a smaller reduction in their pensions because the PRI does not reach its lower bound until 2050. In contrast, the welfare losses for workers replicate the U-shape profile that we have discussed above. Workers born between 1910 and 1945 face similar welfare results as the retirees, because, most of these workers are 65 years old or older at the time of the reform, they expect to retire soon, and they have the same life expectancy as the retirees of the same age cohorts.
5 Sensitivity analysis
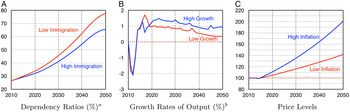
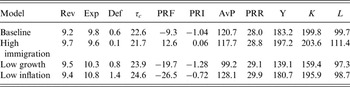
In this section we analyze the sensitivity of our findings to our assumptions regarding the population dynamics, the growth rate scenario, and the inflation rate scenario. In Figure 8 we represent the baseline and the alternative scenarios, in Table 6 we report the values of some of the main macroeconomic ratios that we obtain in the R2013 model economy in 2050 under these scenarios, and in Figure 9 we compare the PRIs and the welfare costs of the reforms in the three alternative scenarios relative to our baseline scenario.
(Colour online) The Demographic, Growth Rate, and Inflation Rate Scenarios. (A) Dependency ratios (%) a ; (B) growth rates of output (%) b ; (C) price levels. a This is the ratio between the number of households in the 65+ age cohort and those in the 20–64 age cohort. b In this panel we plot the growth rate of output at factor cost.

(Colour online) The PRIs and Welfare Costs in Alternative Scenarios. (A) PRIs; (B) welfare costs (CEV, %).

The R2013 Model Economy in 2050 under alternative scenarios

Rev, revenues (%GDP); Exp, expenditures (%GDP); Def, pension system deficit (%GDP); τ c , consumption tax rate needed to finance the pension system (%); PRF, pension reserve fund or pension system debt (%GDP); PRI, average value of the PRI between 2014 and 2050 (%); AvP, average pension (2010 = 100); PRR, pension replacement rate (AvP/W(60–64), %); Y, output index (2010 = 100); K, capital index (2010 = 100); L, labor input index (2010 = 100).
Demographic Scenarios. The demographic scenario that we have used in the main body of the paper is the Spanish Instituto Nacional de Estadística's (INE) 2012 population projection. In this scenario, the old-age dependency ratio (65+/20–64) increases from 26.5% in 2010 to 77.5% in 2050. To test the robustness of our findings we compare our results with those that we obtain under the INE's 2009 population projection, which was more optimistic. According to this projection, in 2050, the old-age dependency ratio will be 65.2%, 12.3 percentage points smaller than in the INE 2012 projection (see Panel A of Figure 8). The bulk of the difference between these two projections arises from the net migration flows. While the INE 2009 projection assumed a long run net flow of around 300,000 immigrants per year, the INE 2012 projection reduced that flow to about 66,000 immigrants per year. We call the INE 2009 projection the high-immigration scenario.
As expected, we find that the high-immigration scenario further improves the financial sustainability of the 2013 Pension Reforms. In 2050 the pension system deficit is reduced from 0.6% to −0.1% of output, the consumption tax rate needed to finance this deficit from 22.6% to 21.2%, and the debt that would have been accumulated by the pension system from 9.3% of output to −12.6%. Moreover, in the high immigration scenario the average value of the PRI increases from −1.04% to 0.06%. We conclude that increasing immigration improves the efficiency of the 2013 Pension Reforms because it makes the pension system more sustainable. In Figure 9 we show that, relative to the baseline scenario, the high immigration scenario brings about welfare gains for every cohort except for those born between 1915 and 1920, that the average gains are 8.88% of consumption, and that the highest gains correspond to the households born between 2040 and 2050.
Growth Rate Scenarios. The growth rate scenario of our baseline simulation results in an average annual growth rate of 1.5% between 2017 and 2050. To achieve this target, labor productivity grows at a rate of 1.9% per year from 2021 onwards. This number may be somewhat high. According to Balmaseda et al. (Reference Balmaseda, Melguizo and Taguas2006), for instance, the average annual productivity growth rate in Spain was 0.6% between 1988 and 2004. And, according to Boldrin et al. (Reference Boldrin, Conde-Ruiz and Díaz-Giménez2010), the growth rate of labor productivity in Spain was negative between 1999 and 2006. To check the robustness of our findings, we simulate the 2013 Pension Reforms in a low-growth scenario that assumes that the annual growth rate of labor productivity is only 1% from 2017 onwards (see Panel B of Figure 8). This number is similar to the Spanish average annual labor productivity growth rate between 1995 and 2012, which was 0.9%, according to the Organization for Economic Co-operation and Development.
Our main findings in the low-growth scenario are the following: the low-growth scenario makes the 2013 Reforms less sustainable, but not by much. Specifically, in the low-growth scenario in 2050 the pension system deficit increases from 0.6% to 0.8% of output, the consumption tax rate needed to finance this deficit from 22.6 to 23.9, and the debt that would have been accumulated by the pension system from 9.3% of output to 19.7%. Consequently, the average PRI decreases from −1.04 to −1.28. The consequences of low growth for the generosity of the system are mixed. The average pension decreases substantially from 120 to 99, but the pension replacement rate increases from 28.0 to 29.1 (see Table 6). Finally, Figure 9 shows that the low growth scenario results in large welfare losses for most cohorts. These welfare losses are increasing with the year of birth of the households until 1996, their average value is −15.4% of consumption, and they become welfare gains for the households born between 1911 and 1925.
Inflation Rate Scenarios. Our baseline scenario assumes an annual inflation rate of 2% from 2016 onwards in accordance with the European Central Bank inflation rate target. But, according to the INE, in 2014 the Spanish annual inflation rate was −1.1%. As a final robustness check, we simulate the 2013 Pension System Reform using a low-inflation scenario that assumes that the annual inflation rate is 1% from 2016 onwards (see Panel C of Figure 8). It is important to notice that the inflation scenario changes the lower bound of the PRI in real terms, because the law establishes a minimum increase in nominal pensions of 0.25%. Therefore, in our baseline scenario, the lower bound of the PRI in real terms is −1.75% (=0.25 − 2), while in the low inflation scenario it is −0.75% (=0.25 − 1).
Our main findings are the following: the low-inflation scenario makes the 2013 Reforms less sustainable but, once again, the differences are small. In this scenario in 2050 the pension deficit increases from 0.6% of output to 1.4, the consumption tax rate needed to finance this deficit from 22.6% to 24.6%, and the debt that would have been accumulated by the pension system from 9.3% of output to 26.5%. In spite of this reduced sustainability of the pension system, the low inflation regime brings about more generous pensions. This is because in real terms the PRI is higher because it reaches its inflation-dependent lower bound almost every year (see Panel A of Figure 9). Consequently, its average value increases from −1.04 to −0.72. This implies that in 2050 the value of the average pension index increases from 120 to 128, and the pension replacement rate from 28.0% to 29.9%. We conclude that low inflation is mixed news for the 2013 Pension Reforms: it trades off a less sustainable pension system against more generous pensions. Finally, Panel B of Figure 9 shows that, in welfare terms, these higher pensions financed with higher consumption taxes result in small welfare losses for the households born between 1911 and 1914 and in small welfare gains for the households born thereafter. On average, the welfare gains are about 0.9% of consumption, and they are somewhat increasing with age for the households born after 1996.
Conclusions. We conclude that, relative to our baseline simulation, the best case scenario for the 2013 Reforms is a more favorable demographic scenario. An annual net flow of immigrants of about 300,000 people would solve the sustainability problems of the current Spanish pension system and it would bring about welfare gains for most households. In contrast, both low growth and low inflation would make matters worse for the sustainability of Spanish public pensions. But low growth is worse than low inflation because it results in a less generous average pension, and it brings about high welfare losses. If we were to take these results literally, we would recommend the Spanish government to pursue more immigration friendly policies, to deepen the growth-enhancing reforms of the labor market and the public sector and to lobby the European Central Bank for a reduced inflation rate target.
6 Conclusions
We study the 2011 and 2013 Reforms of the Spanish pension system. These reforms delay the legal retirement ages, increase the contributivity of the system, and effectively transform the Spanish traditional defined-benefit pay-as-you-go pension system into a defined-contribution pay-as-you-go pension system. We find that these reforms make Spanish pensions substantially more sustainable and that they limit the tax increases that would have been necessary to finance the pension system deficits. But this result is achieved at the expense of large reductions in the real value of the average pension. This reduction is continuous and, by 2050, the average pension is approximately 30 percent smaller in real terms than what it would have been under the pension system rules that prevailed in 2010. We also find that the households born between 1950 and 1970 and young disabled workers who are alive in 2011, bear the highest welfare costs. Moreover, the welfare losses of future cohorts are increasing, because they lose the insurance provided by the minimum pension in the case of disability risk.
We conclude that it is most likely we will see more reforms of the Spanish pension system in the future. We base our conclusion in two main reasons. First, the pension system fund will most probably run out in the next few years, a constitutional amendment mandates that every Spanish administration budget, including the Social Security administration, must be structurally balanced, and this will reopen the debate on the sustainability of Spanish pensions. And, second, the reduction in the real value of pensions and, especially, of minimum pensions is so steep, that it is hard to believe that it will be politically sustainable.
After having researched on this topic for more than 10 years, we are convinced that the current Spanish pension system should be overhauled and replaced by a system that combines fully contributive pay-as-you-go pensions with mandatory individual retirement accounts, similar in design to the Swedish public pensions. In Argandoña et al. (Reference Argandoña, Díaz-Giménez, Díaz-Saavedra and Álvarez2013) we offer a preliminary simulation of this reform. This topic certainly warrants future research, but we contend that the multiple sources of retirement income from this mixed retirement system would be ideal to meet the demographic, economic, and political risks that Spanish pensions will have to face in the near future.