Introduction
Phase change materials (PCMs) have been extensively studied, particularly in the perspective of data storage applications.[Reference Wuttig and Yamada1, Reference Wełnic and Wuttig2] Their fundamental property relies in the reversible transition between two different microstructural states, i.e., the amorphous-to-crystalline phases, which show two distinct sets of physical properties that can be macroscopically measured. Indeed, variations of the optical reflectivity upon amorphous to crystalline phase transition may attain up to 30%,[Reference Wełnic and Wuttig2] while the electrical resistivity can change by more than three orders of magnitude,[Reference Friedrich, Weidenhof, Njoroge, Franz and Wuttig3] producing a metal–insulator transition.[Reference Siegrist, Jost, Volker, Woda, Merkelbach, Schlockermann and Wuttig4] Beyond the pronounced contrast of the physical properties between the two phases, the fast switching between these states renders these materials suitable for data storage applications.[Reference Wuttig and Yamada1]
Currently, PCMs are exploited as optical data storage media in rewritable compact discs (CDs), digital versatile discs (DVDs), and Blu-ray discs. The information bit is encoded in the contrast of the refractive index relative to the two phases.[Reference Wełnic and Wuttig2] Later on, PCMs have also been recognized as effective building blocks for future electronic memory devices [phase change-random access memories (PC-RAMs)], where the bit of information is encoded in two distinct resistive states corresponding to the (high-resistive) amorphous state and the (low-resistive) crystalline state. PC-RAMs have demonstrated sub-10 ns switching speed,[Reference Loke, Lee, Wang, Shi, Zhao, Yeo, Chong and Elliott5, Reference Zhu, Xia, Rao, Li, Wu, Ji, Lv, Song, Feng, Sun and Zhang6] extremely good cyclability,[Reference Kim, Cho, Im, Cho, Kim, Oh, Ahn, Park, Nam, Moon and Chung7] data retention ability[Reference Cheng, Chien, BrightSky, Ho, Zhu, Ray, Bruce, Kim, Yeh, Lung and Lam8] as well as possible integration in large-arrays[Reference Mantegazza, Ielminia, Pirovano, Lacaita, Varesi, Pellizzer and Bez9] and, more importantly, scalability to sub-10 nm dimensions,[Reference Kim, Cho, Im, Cho, Kim, Oh, Ahn, Park, Nam, Moon and Chung7, Reference Giusca, Stolojan, Sloan, Börrnert, Shiozawa, Sader, Rümmeli, Büchner, Ravi and Silva10] thus representing potential candidates in the search of future alternatives to flash memory technology.[Reference Burr, Breitwisch, Franceschini, Garetto, Gopalakrishnan, Jackson, Kurdi, Lam, Lastras, Padilla, Rajendran, Raoux and Shenoy11] The fast crystallization process (t ~ 10–100 ns) occurring in pseudo-binary chalcogenide-based alloys, in particular Ge2Sb2Te5 (GST), has motivated so far their interest for device applications.[Reference Wuttig and Yamada1] As a result, the structural properties correlated with the metal–insulator transition have been studied in detail, thanks also to advances in GST fabrication methods.[Reference Bragaglia, Arciprete, Zhang, Mio, Zallo, Perumal, Giussani, Cecchi, Boschker, Riechert, Privitera, Rimini, Mazzarello and Calarco12] However, the technology based on GST PC-RAMs is not mature to be competitive and penetrate the market. Among several open points, the low crystallization temperature (~150 °C) of GST[Reference Zheng, Cheng, Huang, Qi, Rao, Ding, Yin, Song, Liu, Song and Feng13] poses important reliability issues for certain categories of applications which require high working temperatures, thus being exposed to undesired alterations of the information, as for example automotive applications.[Reference Aoukar14] For some other applications, the information is recorded before soldering, the latter process being carried out at temperatures up to 260 °C, altering the code integrity.[Reference Aoukar14] For these reasons, there is an increasing demand for PCMs exhibiting high-temperature phase transitions. In this context, it has been found that the crystallization temperature of GST can be increased by doping with nitrogen,[Reference Kim, Chung, Kyoung, Park and Choi15, Reference Navarro, Sousa, Noe, Castellani, Coue, Kluge, Kiouseloglou, Sabbione, Persico, Roule, Cueto, Blonkowski, Fillot, Bernier, Annunziata, Borghi, Palumbo, Zuliani and Perniola16] carbon,[Reference Zhou, Xia, Rao, Wu, Li, Song, Feng and Sun17] oxygen,[Reference Jeong, Seo, Lee, Choi, Kim and Kim18] bismuth[Reference Lazarenko, Nguyena, Kozyukhina and Sherchenkov19] as well as by Ge[Reference Navarro, Sousa, Noe, Castellani, Coue, Kluge, Kiouseloglou, Sabbione, Persico, Roule, Cueto, Blonkowski, Fillot, Bernier, Annunziata, Borghi, Palumbo, Zuliani and Perniola16] or Sb.[Reference Choi, Yoon, Lee, Lee, Park, Yu and Ryu20] In this regard, Ge-enriched GST has demonstrated high data retention over an extended temperature range.[Reference Sousa, Navarro, Castellani, Coué, Cueto, Sabbione, Noé, Perniola, Blonkowski, Zuliani and Annunziata21] In addition, N doping contributes to further increase the crystallization temperature and leads to better endurance performances and to the reduction of the drift phenomenon in the low resistance state.[Reference Kiouseloglou, Navarro, Sousa, Persico, Roule, Cabrini, Torelli, Maitrejean, Reimbold, De Salvo, Clermidy and Perniola22] Although all these properties are extremely promising in the perspective of memory applications, a detailed and comprehensive study of the microstructural changes which occur during the amorphous-to-crystalline phase transition in these Ge-rich and N-doped materials is still lacking. Recent works have addressed the issue of cycling endurance affected by void generation[Reference Yoon, Choi, Lee, Lee, Park and Yu23, Reference Padilla, Burra, Rettner, Topuria, Rice, Jackson, Virwani, Kellock, Dupouy, Debunne, Shelby, Gopalakrishnan, Shenoy and Kurdi24] or chemical phase segregation[Reference Padilla, Burra, Rettner, Topuria, Rice, Jackson, Virwani, Kellock, Dupouy, Debunne, Shelby, Gopalakrishnan, Shenoy and Kurdi24–Reference Crespi, Lacaita, Boniardi, Varesi, Ghetti, Redaelli and D'Arrigo26] after repeated operations of amorphization/recrystallization transitions, which may alter the original composition and influence the device performance upon cycling.[Reference Privitera, Sousa, Bongiorno, Navarro, Sabbione, Carria and Rimini27] It is then important to understand the compositional changes which accompany the phase transition in non-stoichiometric chalcogenide-based alloys.[Reference Carria, Mio, Gibilisco, Miritello, Bongiorno, Grimaldi and Rimini28, Reference Zuliani, Varesi, Palumbo, Borghi, Tortorelli, Erbetta, Dalla Libera, Pessina, Gandolfo, Prelini, Ravazzi and Annunziata29]
In this context, we present here a study of the amorphous-to-crystalline phase transition occurring during the annealing of highly Ge-rich and N-doped GST-based PCMs, which will be referred hereafter as E-GST. In this work, after having identified the temperature at which the onset of the structural change occurs, the crystallization process has been investigated. The approach presented here is mostly based on transmission electron microscopy (TEM) techniques, in order to understand the phase transition at the nanoscale level from a structural and chemical viewpoint. To this aim, in-situ TEM was pursued, supported by ex-situ structural analyses, such as ex-situ TEM and x-ray diffraction (XRD). In-situ TEM allows following the phase change process in real time since the thermal heating is implemented during observation, while the sample prepared via in-situ heating can be also examined a posteriori to carry out more precise chemical and crystallographic analyses by means of ex-situ TEM. This study has allowed us to identify the crystallization temperature of E-GST as well as the microstructural and chemical characteristics resulting from the crystallization process.
Methods
An amorphous Ge-rich (Ge excess with respect to the stoichiometric GST reference >30 at.%) and N-doped 100 nm-thick E-GST film was first deposited on a Si (100) wafer by physical vapor deposition. A 20 nm-thick layer of TiN was then deposited on the E-GST film for encapsulation. In order to favor the adhesion between the TiN layer and the E-GST film, an ultra-thin layer of Ti-enriched TiN (nominally 14 Å-thick) was deposited between the E-GST surface and the TiN encapsulant.
Ex-situ analyses were performed on samples annealed in a horizontal Carbolite furnace, under atmospheric pressure and N2 flux, in the temperature range from 380 up to 450 °C and for durations of 10 and 30 min. The XRD measurements were obtained on a Bruker D8 Discover diffractometer, which exploits a μS-Co (λ = 1.789 Å) and a 2D Vantec 500 detector, in grazing angle configuration at 0.75°. Samples for TEM were prepared in cross-section by first thinning via mechanical polishing and dimpling, taking care to reach extremely low thicknesses mechanically in order to limit heating and ballistic effects of the ion irradiation in the E-GST film during the final ion polishing (PIPS) step. In-situ TEM analyses were realized by means of a JEOL 2010 TEM, working at 200 keV, and a spherical aberration corrected FEI TECNAIF20, with a FEG source set at 100 keV to limit beam effects on the crystallization process. The in-situ heating is performed using a Gatan 652 double tilt heating holder, which is connected to a temperature controller and acts as a furnace type holder that allows the direct observation of microstructural phase changes during annealing. The chemical analyses were obtained by energy dispersive x-ray spectroscopy (EDX) using a Philips CM20-FEG TEM, working at 200 keV and equipped with a Microanalyser QUANTAX XFlash detector with a 30 mm2 active area and an energy resolution of 127 eV.
Results
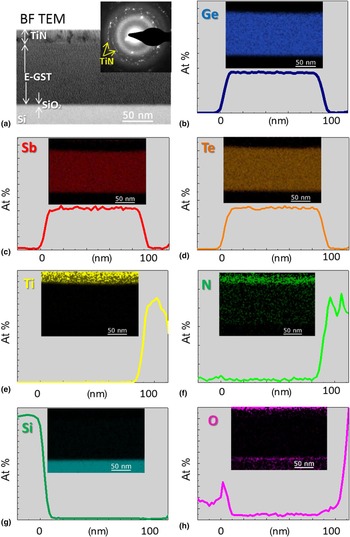
Preliminary to the study of the phase transition process, we first need to specify the structural and chemical characteristics of the as-deposited E-GST film. Figure 1(a) shows a bright field (BF) TEM image of this film. The TiN encapsulating layer is also distinguishable on top of the GST layer. The amorphous state of the as-deposited material is assessed by the homogeneous contrast of the film in the BF image and the diffuse rings visible in the associated electron diffraction pattern shown in the inset of Fig. 1(a). The TiN layer is polycrystalline as seen in the image and in the associated diffraction pattern. Scanning transmission electron microscopy (STEM)-EDX line scans performed across the E-GST allow quantifying the elemental distributions across the film [Figs. 1(b)–1(h)]. The corresponding STEM-EDX maps are also shown in the insets of each figure. In this way, it is possible to quantify the concentration of each atomic component of the film, namely Ge [Fig. 1(b)], Sb [Fig. 1(c)], and Te [Fig. 1(d)]. The analyses corresponding to Ti and N are shown in Figs. 1(e) and 1(f), evidencing the presence of N in both the encapsulating layer and as a dopant in the E-GST film. The STEM-EDX analyses evidence that the as-grown film is spatially homogeneous in composition, while N is found in large concentrations within the TiN layer. A thin Si oxide layer is also detected between the Si wafer and the GST layer, as shown in Figs. 1(a), 1(g), and 1(h).
(a) BF TEM image of the as-deposited amorphous E-GST, covered by a polycrystalline TiN encapsulation layer, and the associated diffraction pattern in the inset. The STEM-EDX line scans are displayed for each element: (b) Ge, (c) Sb, (d) Te, (e) Ti, (f) N, (g) Si, and (h) O, while the corresponding STEM-EDX maps are shown in the insets.

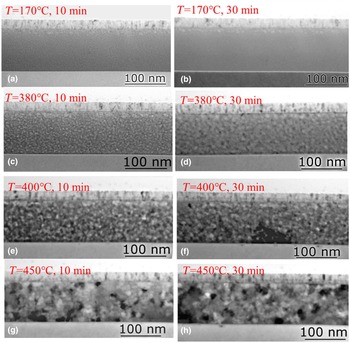
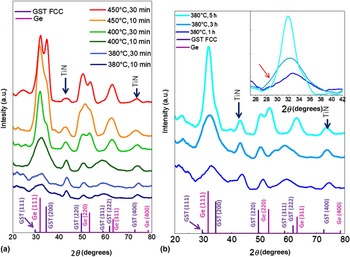
In order to identify the temperature at which the onset of the phase transition occurs, a preliminary in-situ TEM analysis was realized by cumulative annealing of a sample of E-GST at increasing temperatures from 170 to 450 °C. At each temperature, the sample was let to evolve for fixed durations of 10 and 30 min while the electron beam was shifted out to minimize possible irradiation effects. The sample was exposed to the beam only during the limited time needed for image acquisition. TEM images were taken from different zones of the samples to avoid the possible influence of previous beam irradiation on the crystallization process. Selected BF images registered during this in-situ TEM annealing are presented in Figs. 2(a)–2(h). No structural change is detected after annealing at 170 °C [Figs. 2(a) and 2(b)]. Only after annealing at 380 °C, we can note some change in the contrast arising from the E-GST layer [Figs. 2(c) and 2(d)], whereas it is possible to see in Fig. 2(e) the appearance of small grains which continue to grow over time [Fig. 2(f)]. Crystal growth is more evident at higher temperature [Figs. 2(g) and 2(h)], while some grain coalescence takes place at 400°C. This in-situ analysis shows that the onset of the phase change occurs at around 380 °C. This finding is in agreement with the ex-situ XRD measurements shown in Fig. 3(a). Indeed, after annealing at 380 °C for 10 and 30 min, the XRD spectra exhibit broad and weak peaks, as expected for mostly amorphous E-GST. Small but sharper peaks related to the polycrystalline phase of the TiN encapsulating layer are also visible. These spectra are indistinguishable from the one obtained on as-deposited E-GST (see Fig. S1 in the Supplementary material).
Sketches of the phase transition induced by cumulative in-situ annealing. (a and b) No change inside the film is revealed up to 170 °C. (c and d) At 380 °C, the onset of the phase transition occurs, gradually evolving at higher temperatures (e–h).

XRD measurements of E-GST films annealed ex-situ (a) at different temperatures and times and (b) at fixed temperature of 380 °C and for increasing times.

The XRD peaks become far more intense after annealing at 400 and 450 °C. These peaks can be assigned to those expected for pure Ge and GST-FCC. It is noteworthy that, after annealing at 400 °C for 10 min, a narrow and intense peak centered on the distance characteristic of the (111) planes of Ge has emerged from the former broad and weak bump visible in the same region on all the samples annealed at lower temperatures. After annealing at 400 °C for 30 min, the spectrum is dominated by the peak characteristics of crystalline Ge [(111), (220), and (311) planes], while crystalline GST is also detected through weak peaks at 34° and 50°, corresponding to its (200) and (220) planes, respectively. After annealing at 450 °C for 10 min, the peak intensity characteristics of the GST further increases. Finally, the peak characteristics of pure Ge and “pure” GST are clearly separated only after annealing at 450 °C for 30 min. These observations demonstrate that during annealing crystalline Ge grains are formed before and faster than GST grains.
To consolidate this finding, ex-situ isothermal annealing at 380 °C was performed for increasing times and the samples were analyzed by XRD. The XRD results are plotted in Fig. 3(b). After 1 h annealing, the spectrum is still characteristic of an amorphous material. When the annealing time further increases from 1 to 3 h, the peaks get less diffuse [see inset in Fig. 3(b)] and start to peak at the angular positions, characteristic of pure crystalline Ge. Only after annealing for 5 h, we can observe the appearance of a small shoulder at the right edge of the strong Ge peak at about 34° and due to the (200) planes of GST-FCC phase. Moreover, two distinct peaks are also found above 50°, characteristic of the co-existence of crystalline Ge and GST grains. These observations confirm that the phase transition proceeds first through the crystallization of excess-Ge followed by the crystallization of some GST material.
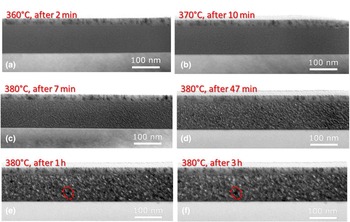
To better unveil the nanostructural changes accompanying the crystallization process, in-situ isothermal TEM observations were carried out at 380 °C and for a total time of 3 h. The overall analysis was performed at 100 keV to minimize electron beam effects. To limit specimen drift due to temperature gradients, the sample-holder temperature was progressively raised between 300 and 370 °C until sample stabilization. During this step no microstructural change was detected in the E-GST film [Figs. 4(a) and 4(b)]. Selected TEM images illustrating the phase change process occurring at 380 °C are shown in Figs. 4(c)–4(f). After few minutes at 380 °C, we note that the image contrast abruptly changes across the E-GST layer. The contrast becomes heterogeneous with nanometric regions of individual white or black contrasts appearing. These regions further grow during annealing, as evidenced by the red circles in Figs. 4(e) and 4(f). Keeping in mind that XRD shows that the layer is still amorphous for annealing durations of less than 3 h, these contrasts may be ascribed to local density variations. This indicates that prior to the crystallization process which takes place for long times at 380 °C, phase separation quickly occurs at 380 °C within the whole volume of the film. A movie recorded for the isothermal in-situ annealing is given in Supplementary Video S1.
Sketches of the isothermal in-situ annealing TEM analysis: (a and b) preliminary steps of stabilization at temperatures slightly lower than the fixed temperature of 380 °C; (c–f) onset of the phase change and further nucleation and grain growth.

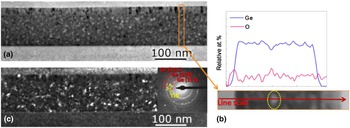
To understand the nature of these regions and to shed light on the chemical characteristics of the E-GST layer just before and at the onset of the structural transition, the sample annealed in-situ at 380 °C for 3 h was studied a posteriori via conventional BF, conical dark field (DF) imaging, and diffraction as well as STEM-EDX analyses. A typical STEM-BF image of this E-GST sample is shown in Fig. 5(a), where we recognize the white/dark regions of nanometric dimensions already observed in situ [Fig. 4(f)]. Being very small regions (~4 nm in diameter), small compositional variations are difficult to detect by EDX mapping but are better evidenced using line scanning. A representative STEM-EDX line scanning performed across the sample is shown in Fig. 5(b). The attentive analysis of the correlations between the STEM-EDX profiles and the STEM-BF images reveals that the bright regions observed in the images, like the one circled in yellow in Fig. 5(b), are Ge-depleted zones. Interestingly, these regions also seem to have trapped oxygen atoms. Most importantly, the analysis of the diffraction patterns indicates the presence of small crystalline Ge grains, of which the characteristic interplanar distances are well-distinguishable from those of the GST crystalline phase. By means of conical DF technique, these Ge nanocrystals can be imaged independently of their crystallographic orientation. They appear randomly located across the film [Fig. 5(c)]. A movie recorded for the observation of the Ge nanocrystals while performing the conical DF is given in Supplementary Video S2.
(a) BF TEM image of the E-GST sample prepared via in-situ annealing at 380 °C for 3 h. (b) Representative STEM-EDX line scanning analysis. (c) DF image using the Ge (111) diffraction ring, as visible in the diffraction pattern in the inset.

Discussion
From the analysis of the results we have obtained along this experimental study, we first confirm that the as-deposited amorphous Ge-rich GST material is chemically and structurally unaffected by annealing at temperatures below 380 °C. This is in clear contrast with stoichiometric GST which is known to crystallize at ~150 °C.[Reference Zheng, Cheng, Huang, Qi, Rao, Ding, Yin, Song, Liu, Song and Feng13] Contrast changes in the TEM images of the E-GST film appear abruptly only after annealing at 380 °C. Since we have no evidence of crystallinity from electron and x-ray diffraction after such short annealing times, we believe that the observed contrast mostly results from chemical inhomogeneities at the nanoscale, which result from chemical phase separation in the amorphous phase. However, electron diffraction performed on the sample annealed at 380 °C for 3 h indicates the presence of Ge nanocrystals, but not of any crystalline GST phase. This finding is in agreement with XRD results. Annealing for much longer time (5 h) at 380 °C or shorter times at 400 and 450 °C finally allows the crystallization of the GST-FCC phase, as clearly evidenced by XRD. Hence, we can conclude that the phase transition in E-GST is activated through first, the formation of pure Ge regions then, the crystallization of these regions, and last, the crystallization of more stoichiometric GST grains. The observation of such small grains suggests that the phase change process is nucleation-dominated although in-situ TEM has also shown that the grains grow in size probably through coalescence for increasing annealing durations. It is noteworthy that nucleation of Ge grains takes place randomly across the E-GST film, without any preferential location, being characteristic of homogeneous nucleation.
However, it is clear that chemical phase separation occurs concurrently to the structural phase change at the nanometer scale. This is not unexpected as the amount of Ge atoms available in the as-deposited amorphous layer well exceeds the capacity of any GST type material to accommodate this amount in its crystalline lattice.[Reference Aoukar14] Hence, following the formation of pure Ge through diffusion, nucleation of Ge grains occurs. Later on, the “still-in-excess” Ge atoms migrate toward the solid Ge grains and activate the growth of the first Ge nucleus. This scenario is consistent with the observation of some Ge depleted regions at the onset of the phase transition. These sites and most probably the interfaces between the Ge grains and the still amorphous or poorly crystallized GST may act as good trapping sites for oxygen atoms which may diffuse from the thin SiO2 layer (native oxide) we have evidenced in the as-deposited sample. In the meantime, due to the high-Ge content in the layer, the remaining amorphous GST phase is probably still Ge-rich and, for this reason, crystallizes at much higher temperatures, i.e., at 400 °C and above. The exact composition of the GST phases which crystallize may dramatically vary along the pseudo-binary GeTe–Sb2Te3tie line,[Reference Noé, Vallée, Hippert, Fillot and Raty30] but still remains difficult to assess since these alloys possess analogous crystal lattices and produce the same diffraction pattern independently on their composition.
Finally, we want to stress that all the amorphous-to-crystalline phase transitions we have studied were induced by the sole effect of thermal heating, without the contribution of any electric-field induced electromigration, as possibly found in real devices. The temperature is hence homogeneous through the film, in contrast to the situation encountered when using laser-induced crystallization where a high thermal gradient is present.[Reference Privitera, Sousa, Bongiorno, Navarro, Sabbione, Carria and Rimini27] Thus, the observation of Ge segregation and crystallization is a pure thermodynamical effect and results from Ge atomic diffusion, which occurs through thermal activation and even in the absence of electric field.[Reference Privitera, Sousa, Bongiorno, Navarro, Sabbione, Carria and Rimini27]
Conclusions
In this work we have studied the amorphous-to-crystalline phase transition which occurs in an innovative PCM material, a GST alloy with high Ge content, and N-doped, during simple thermal annealing. While the amorphous as-deposited films are homogeneous in composition, thermal annealing allows thermodynamics to express itself. As the Ge concentration in the amorphous film well exceeds the concentration of Ge atoms that can be accommodated in the GST lattice whatever its composition along the congruent line of the GST phase diagram,[Reference Wuttig and Yamada1, Reference Park, Park, Baik, Lee, Jeong and Kim25] chemical phase separation occurs prior to any crystallization. This occurs at 380 °C for the films we have studied. Following phase separation, Ge crystallizes in the form of small grains which tend to grow and locally reduce the Ge concentration until it can be accommodated in a GST lattice. Once this is done, GST can crystallize and this occurs at and above 400 °C. Still, this large increase of crystallization temperature from 150 °C for stoichiometric GST is not totally understood. It is still an open question whether it is 400 °C the regular temperature for the amorphous-to-crystalline transition of a Ge-rich GST materials (such as Ge4Sb2Te9 and Ge6Sb2Te9[Reference Wuttig and Yamada1]) or there is the need to sufficiently activate Ge diffusion and segregation after a reasonable time, prior to be able to crystallize the classical GST. Anyhow, this characteristic ensures a higher thermal stability of the amorphous phase, with probably better data retention ability in case of devices requiring high-working conditions. However, understanding and simulating the electrical characteristics of devices based on such materials will require keeping in mind that the material in its conductive (crystalline) state is not homogeneous and consists of a mixture of grains from two distinct phases, one chalcogenide and one semiconductor, the later probably being heavily doped.
Supplementary material
The supplementary material for this article can be found at https://doi.org/10.1557/mrc.2018.168
Acknowledgments
The authors would like to thank the people in charge of TEM facility at CEMES, in particular S. Joulie and C. Marcelot for their precious technical support. This work has been partially funded by Minefi through the Nano2017 initiative. This study has been (partially) supported through the grant NEXT no. ANR-10-LABX-0037 in the framework of the “Programme des Investissements d'Avenir”.