



1. Introduction
There are many strategies to transport fluids at scales of the order of the capillary length. Passive transport, driven by surface tension, has proven to be an effective means to promote directional liquid transport provided that the surface is adequately structured (e.g. Courbin et al. Reference Courbin, Denieul, Dressaire, Roper, Ajdari and Stone2007; Chen et al. Reference Chen, Zhang, Zhang, Liu, Jiang, Zhang, Han and Jiang2016; Feng et al. Reference Feng, Zhu, Zheng, Zhan, Chen, Li, Wang, Yao, Liu and Wang2021), with practical applications in microfluidics (e.g. Stone, Stroock & Ajdari Reference Stone, Stroock and Ajdari2004; Seemann et al. Reference Seemann, Brinkmann, Pfohl and Herminghaus2012) or water harvesting (e.g. Zheng et al. Reference Zheng, Bai, Huang, Tian, Nie, Zhao, Zhai and Jiang2010; Park et al. Reference Park, Kim, Grinthal, He, Fox, Weaver and Aizenberg2016). Capillary rise within the interstices of an assembly of structures, when the system is rigid (Princen Reference Princen1969; Charpentier, Brändle de Motta & Ménard Reference Charpentier, Brändle de Motta and Ménard2020) or deformable by capillary forces (e.g. Bico et al. Reference Bico, Roman, Moulin and Boudaoud2004; Kim & Mahadevan Reference Kim and Mahadevan2006; Py et al. Reference Py, Bastien, Bico, Roman and Boudaoud2007; Duprat, Aristoff & Stone Reference Duprat, Aristoff and Stone2011), is another method to control the transport of liquid. According to the geometry of the system and the viscosity of the liquid, the capillary rise can be relatively small or slow. Active transport is then a way to capture a larger amount of fluid more quickly and can involve a range of mechanisms, from applied pressure difference to ‘suck’ a liquid (Wei et al. Reference Wei, Rico-Guevara, Nicolson, Brau, Damman, Gorb, Wu and Wu2023) to viscous entrainment. An archetypal example of the latter is dip-coating where an immersed object is pulled out of a liquid bath. The importance of this process in many industrial applications is illustrated by the vast literature which, since the seminal work of Landau, Levich and Derjaguin (Landau & Levich Reference Landau and Levich1942; Derjaguin Reference Derjaguin1943), explored many instances of dip-coating (e.g. Quéré Reference Quéré1999; Weinstein & Ruschak Reference Weinstein and Ruschak2004; Tang & Yan Reference Tang and Yan2017; Bertin et al. Reference Bertin, Snoeijer, Raphaël and Salez2022). In particular, textured flat surfaces and rods were shown to enhance the collection of liquid by viscous entrainment in one-dimensional settings where the flow is mainly unidirectional (Seiwert, Clanet & Quéré Reference Seiwert, Clanet and Quéré2011; Nasto, Brun & Hosoi Reference Nasto, Brun and Hosoi2018; Lechantre, Michez & Damman Reference Lechantre, Michez and Damman2019; Cheng et al. Reference Cheng, Li, Gao, Zhang, Jiang and Dong2023). In the case of flexible hair bundles, the retraction speed increases the capillary attraction force between neighbouring hairs (Bense, Siéfert & Brau Reference Bense, Siéfert and Brau2023) and affects the morphology of the bundle itself due to the interplay between capillary and viscous forces (Ha et al. Reference Ha, Kim, Jiang, Siu and Tawfick2020; Moon & Ha Reference Moon and Ha2024) but the impact of flexibility on the liquid transport remains to be elucidated.
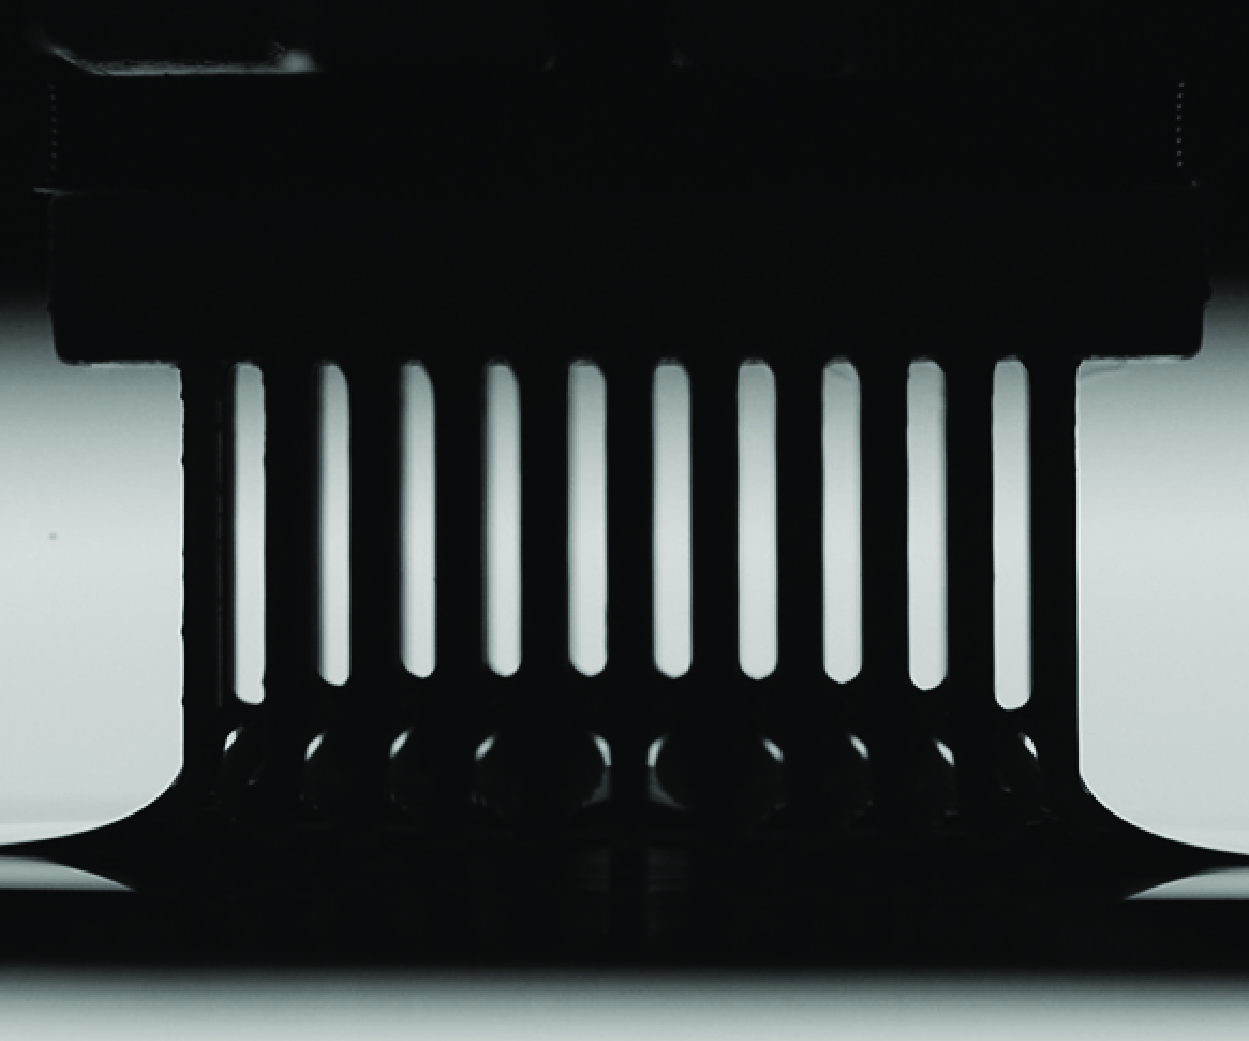
Dipping brush-like structures is also a strategy adopted by some nectarivores to feed on nectar (e.g. Kim, Gilet & Bush Reference Kim, Gilet and Bush2011; Inouye Reference Inouye and Levin2013). Indeed, collecting a viscous fluid at small scales prevents the use of methods employed by other animals (Kim & Bush Reference Kim and Bush2012), like using gravity (humans) or fluid inertia to overcome gravity (lapping for cats (Reis et al. Reference Reis, Jung, Aristoff and Stocker2010), ladling for dogs (Crompton & Musinsky Reference Crompton and Musinsky2011; Gart et al. Reference Gart, Socha, Vlachos and Jung2015)). To deal with capillary and viscous forces dominating at small scales, many nectarivores have developed highly specialised mouthparts adapted to their feeding method (Krenn, Plant & Szucsich Reference Krenn, Plant and Szucsich2005; Krenn Reference Krenn2019): hollow tubular proboscis/tongue for suction (butterfly (Krenn Reference Krenn2010), sunbird (Paton & Collins Reference Paton and Collins1989; Cuban et al. Reference Cuban, Wang-Claypool, Dalimunthe, Downs, Bowie, Brau, Johnson and Rico-Guevara2024)) or tongue decorated by numerous outgrowths resembling a brush for dipping (bees (Lechantre et al. Reference Lechantre, Draux, Hua, Michez, Damman and Brau2021; Wei et al. Reference Wei, Rico-Guevara, Nicolson, Brau, Damman, Gorb, Wu and Wu2023), honeyeaters (Mitchell & Paton Reference Mitchell and Paton1990; Hewes et al. Reference Hewes, Baldwin, Buttemer and Rico-Guevara2023), bats (Harper, Swartz & Brainerd Reference Harper, Swartz and Brainerd2013)). In the latter case, the tongue is dipped cyclically into the nectar which is collected by viscous entrainment when the tongue is withdrawn from the liquid (figure 1 a).
(a) Snapshots of a honeyeater (Acanthagenys rufogularis) feeding on sugar solution (scale bar: 5 mm;
 $\Delta t = 10$
ms). Credit: A.E. Hewes and A. Rico-Guevara. (b) Schematic of a brush composed of an equilateral triangular array of pillars showing its lateral size
 $D$
, the distance
 $d$
between the centres of neighbouring pillars and their radius
 $R$
. (c) Snapshots of an experiment where a brush (
 $R=300$
μm,
 $d=1.5$
mm) initially immersed at a depth
 $L_0 = 16$
mm is withdrawn from a bath of silicone oil (
 $\mu = 0.97$
Pa s) at a retraction speed
 $V = 30$
mm min−1 (
 $\Delta t = 6.4$
s). The height
 $h$
of the interface is initially equal to the Jurin height
 $h_J$
and varies during the retraction. This evolution is monitored by measuring the temporal evolution of interface height at the centre of the brush,
 $h_0(t) = h(0,t)$
. (d) Evolution of
 $h_0-h_J$
as a function of time, rescaled by the time needed to displace the brush by a distance
 $L_0=11$
mm, for two brushes (
 $R=500$
μm,
 $d=2.0$
mm (
 $\phi _1 = 0.773$
) and
 $R=500$
μm,
 $d=2.5$
mm (
 $\phi _2 = 0.855$
)) withdrawn at various speeds
 $V$
as indicated in mm min−1. The maximum height
 $h_0^m$
reached by the interface during the retraction process is indicated with cross symbols. The dashed curve indicates a motion at the speed of the brush. (e) Same as (d) for various immersion depths
 $L_0$
as indicated in mm and
 $V=32$
mm min−1 except for the data represented by a star symbol where
 $V = 100$
mm min−1 and
 $R=400$
μm,
 $d=2.0$
mm (
 $\phi _2 = 0.855$
). (f) Evolution of
 $h_0^m-h_J$
as a function of retraction speed for 13 different brushes where
 $4 \leqslant V \leqslant 2000$
mm min−1,
 $2\leqslant L_0 \leqslant 16$
mm,
 $15 \leqslant D \leqslant 21.2$
mm and
 $\mu =0.97$
Pa s. The number of pillars varies between 60 and 163 and
 $R$
and
 $d$
are given in μm and mm, respectively. The symbols with a black edge indicate the data for which
 $h_0^m$
is reached at the end of the retraction when
 $Vt/L_0 = 1$
.

Dipping a brush appears thus as a simple and commonly used method for capturing liquids in many contexts, yet the details of the flows occurring in the system, which determine the amount of liquid that can be captured by such a device, remain unclear. Indeed, so far, the rationalisation of viscous entrainment in brush-like structures is limited to scaling laws or unidirectional flows. A comprehensive modelling of the flow in these systems is therefore a necessary step to fully exploit them and to better understand, for example, the physics of dipping among nectarivores.
Here, we use rigid brush structures to study the capture of liquid by viscous entrainment and analyse the non-trivial motion of the air-liquid interface within the brush during its retraction from a liquid bath (figure 1 b,c). Drawing an analogy between brushes and porous media, we derive an analytical model to characterise the three-dimensional flow within a brush during its withdrawal. This model accurately describes the evolution of the interface during an experiment and hence the amount of liquid entrained at any time. Finally, building on our model, we find an optimal brush geometry maximising the volume of liquid collected at the end of retraction, which is experimentally validated. Our model sheds light on the hydrodynamics of brush-like structures and provides a new tool to design optimal structures for fluid transport.
2. Experiments and qualitative discussions
We study the collection of liquid by viscous entrainment at small Reynolds number using three-dimensional-printed brushes with a mean diameter
 $D$
and composed of an equilateral triangular array of pillars of radius
 $R$
separated by a distance
 $d$
(figure 1
b). The brushes are fixed to a traction device and immersed at a depth
 $L_0$
in silicone oil of viscosity
 $\mu$
, surface tension
 $\gamma$
and density
 $\rho$
(see Appendix A for more details). Upon immersion, the liquid first rises by capillarity up to the Jurin height given by (Princen Reference Princen1969; Charpentier et al. Reference Charpentier, Brändle de Motta and Ménard2020)
 \begin{equation} h_J = 2\ell _c^2 R^{-1}(1-\phi )\phi ^{-1}\, \cos \theta _Y, \end{equation}
where
 $\phi = 1-2\pi R^2/(\sqrt {3}d^2)$
is the porosity,
 $\ell _c = [\gamma /\rho g]^{1/2}$
the capillary length and
 $\theta _Y$
the Young contact angle (see Appendix B). After reaching equilibrium state, the brush is removed at a constant speed
 $V$
from the bath and the spatio-temporal evolution of the height of the air–liquid interface inside the brush,
 $z=h(r,t)$
, is recorded from the side with a camera (figure 1
c). We simultaneously measured the force required to remove the brush from the bath, so that at the end of the retraction this force corresponds to the weight of the dry brush plus that of the captured liquid
 $m_{{liq}}$
.
Figure 1(d) shows some typical temporal evolution of the interface height measured at the centre of the brush,
 $h_0(t)=h(0,t)$
, when the retraction speed
 $V$
is varied while keeping the immersion depth
 $L_0$
constant (see supplementary movies S1 and S2 available at https://doi.org/10.1017/jfm.2025.10300). The interface first moves up at the same speed as the pillars (dashed curve in figure 1
d), before slowing down to reach a maximum value
 $h_0^m$
where it stops and starts moving down. The higher the retraction speed
 $V$
, the more liquid is entrained and the more
 $h_0^m$
drifts towards the end of the experiments (i.e.
 $Vt/L_0=1$
). Consequently, for a given brush,
 $h_0^m$
is reached at the end of the retraction when
 $V$
is large enough and the temporal evolution of
 $h_0$
is then monotonic as seen in figure 1(e) for the data represented by green star symbols. Similarly, increasing
 $L_0$
while keeping
 $V$
constant yields larger values of
 $h_0^m$
(figure 1
e) until it saturates at large enough
 $L_0$
(see supplementary movie S3 and Appendix D.3).
Figure 1(f) gathers results of all our experiments and shows the evolution of the maximal height
 $h_0^m$
as a function of the retraction speed for various brushes and immersion depth values. Apart from the global increase of
 $h_0^m$
with the retraction speed, there is no clear trend as shown by the variation of
 $h_0^m$
with
 $L_0$
at a given retraction speed. Figure 1(f) shows also the data for which
 $h_0^m$
is reached at the end of the retraction when
 $t=t_{{exp}}=L_0/V$
(see symbols with a black edge). Clearly, a transition speed beyond which
 $h_0^m$
is reached at
 $t_{{exp}}$
cannot be easily determined from these raw data. For example, at
 $V=10$
mm min−1,
 $h_0^m$
is reached before the end of the retraction or at the end of the retraction according to the brush used. Therefore, the transition speed depends on the brush porosity. Similarly, at
 $V=30$
mm min−1 and a given brush with
 $R=300$
μm and
 $d=1.5$
mm,
 $h_0^m$
is reached at
 $t_{{exp}}$
when
 $L_0 = 2$
mm whereas
 $h_0^m$
is reached at
 $t\lt t_{{exp}}$
when
 $L_0 = 16$
mm. Consequently, the interplay between the retraction speed, the immersion depth and the porosity of the brush yields intricate results that require a theoretical model to be rationalised. Before deriving the model, we first discuss the dimensionless groups of parameters that should govern the dynamics.
The fluid capture dynamics by a porous brush results from a competition occurring during the retraction between gravity, draining the fluid out of the brush, and viscous forces opposing to this drainage. The typical draining time is given by Darcy’s law (Guyon et al. Reference Guyon, Hulin, Petit and Mitescu2015) and is written as
 $t_{{D}}=L_0/ V_{\parallel }$
, where
 $V_{\parallel } = k_{\parallel }\rho g/\mu$
is the speed at which a liquid of viscosity
 $\mu$
flows vertically inside a porous medium of permeability
 $k_{\parallel }$
due to the gravitational acceleration
 $g$
. This time has to be compared with the duration of the retraction
 $t_{{exp}}=L_0/V$
, yielding a first dimensionless parameter
 $\overline {V}=t_{{D}}/t_{{exp}} = V/V_{\parallel }$
. When
 $\overline {V} \rightarrow 0$
the fluid has time to flow out of the brush and there is no liquid capture. Conversely, when
 $\overline {V} \rightarrow \infty$
the fluid located inside the brush at
 $t=0$
does not have time to flow out and moves up with the pillars at speed
 $V$
.
A second dimensionless parameter is identified by noting that, during the retraction, part of the fluid initially inside the brush escapes by flowing longitudinally through the bottom of the brush and transversely through the sides. According to Darcy’s law, the flow rate in each direction is given by
 $Q_i \sim k_i A_i \Delta p_i /(\mu \ell _i)$
where
 $k_i$
is the permeability of the brush in the considered direction,
 $A_i$
the cross-sectional area of the flow (
 $A_{\parallel } \sim D^2$
,
 $A_{\perp } \sim D L_0$
) and
 $\Delta p_i$
the pressure difference that drives the flow over the length
 $\ell _i$
(
 $\ell _{\parallel } \sim L_0$
,
 $\ell _{\perp } \sim D$
). Therefore,
 $Q_{\perp }/Q_{\parallel } \sim \bar {\delta }^2 \Delta p_{\perp }/\Delta p_{\parallel }$
, where
 $\bar {\delta }= (k_{\perp }/k_{\parallel })^{1/2} (2L_0/D)$
is the dimensionless parameter that compares the radial to vertical flow rate for a given pressure difference. If
 $\bar {\delta } \rightarrow 0$
, the flow occurs in the longitudinal direction and if
 $\bar {\delta } \rightarrow \infty$
, the fluid escapes only through the sides.
However, this argument does not hold above the bath level where the fluid cannot escape the brush transversely because of the presence of the air–liquid interface. The flow is thus essentially longitudinal in this region. The amount of fluid initially above and below the bath level scales as
 $\phi D^2 h_J$
and
 $\phi D^2 L_0$
, respectively. The ratio between these two quantities,
 $\bar {h}_J= h_J/L_0$
, is another measure of the importance of the transverse flow in the system. When
 $\bar {h}_J \gg 1$
, the liquid initially inside the brush is mostly above the bath level, hence the flow is primarily longitudinal (even for large
 $\bar {\delta }$
).
In the following, we perform a formal analysis of the flow occurring inside a brush withdrawn at constant speed from a bath and obtain a nonlinear partial differential equation (PDE) for the spatio-temporal evolution of
 $h(r,t)$
involving the three dimensionless parameters
 $\overline {V}$
,
 $\bar {\delta }$
and
 $\bar {h}_J$
identified above. The predictions of this model show quantitative agreement with experimental results obtained with three-dimensional-printed brushes as those reported in figure 1(d,e). Finally, we exploit the understanding obtained from this theoretical analysis to identify optimal brushes that maximise the fluid intake.
The formalism developed here is easily adapted to any porous media in which the drainage flow occurs both vertically and horizontally provided the appropriate permeability
 $k_{\parallel }$
and
 $k_{\perp }$
are known. This broad applicability is demonstrated by the quantitative agreement between our model and the data obtained with two parallel plates separated by a small gap and withdrawn from a bath (see § 6).
3. Theoretical model
3.1. Pressure, velocity and equation for the interface
The velocity field in a brush is given by Darcy’s law in cylindrical coordinates whose origin is placed in the middle of the brush at the bath level (figure 1 c):
 \begin{equation} v_{r}(r,z) = -\frac {k_{\perp }(z)}{\mu } \frac {\partial p}{\partial r}, \quad v_z(r,z) = V - \frac {k_{\parallel }}{\mu } \left (\frac {\partial p}{\partial z} + \rho g\right ), \end{equation}
where
 $V$
is the retraction speed,
 $k_{\parallel }$
the longitudinal permeability along the
 $z$
axis and
 $k_{\perp }(z) = k_{\perp } \theta (-z)$
an effective transverse permeability along the
 $r$
axis, where
 $\theta (z)$
is the Heaviside function, allowing a horizontal flow in the immersed part of the brush only. Indeed, the fluid transported by the brush located above the level of the bath is surrounded by an air–liquid interface. As seen in figures 1(c) and 4 and in supplementary movies S1–S4, this interface does not noticeably expand radially during the retraction of the brush. The radial velocity must thus be small compared with the longitudinal one in this region. The expressions of
 $k_{\parallel }$
and
 $k_{\perp }$
are given in figure 2(a) (see Appendix C for more details). Mass conservation,
 $\nabla \cdot \textbf{v}=0$
, gives an equation for the pressure:
 \begin{equation} \frac {\partial ^2 p}{\partial z^2} +\frac {k_{\perp }(z)}{k_{\parallel }}\nabla _r^2 p =0, \end{equation}
where
 $\nabla _r^2 p = r^{-1}\partial _r(r \partial _r p)$
is the radial part of the Laplacian in cylindrical coordinates. Once the pressure field is known, (3.1) yields the velocity field which, evaluated at air–liquid interface
 $z=h(r,t)$
, gives the spatio-temporal evolution of the interface from the condition
 \begin{equation} \frac {\partial h(r,t)}{\partial t} = v_z(r,h)-v_r(r,h) \frac {\partial h(r,t)}{\partial r} = v_z(r,h), \end{equation}
where we used
 $v_r(r,h)=0$
since we assume that there is no radial flow above the bath, i.e.
 $k_{\perp }(h\gt 0)=0$
.
(a) Evolution of the longitudinal and transverse permeabilities rescaled by
 $d^2$
as a function of the porosity
 $\phi$
for an equilateral triangular array of pillars where
 $4F_{\parallel } = [1-0.91 \sqrt {x}]^{4.6}[1-0.069(\ln x + K - 35 x)]$
and
 $12.4F_{\perp } = [1-1.05\sqrt {x}]^{2.5}[1-0.21(\ln x+K)]$
with
 $x = 1-\phi$
and
 $K=1.498$
. These expressions are fits of numerical data (see Appendix C) and extend analytical asymptotic expressions (Drummond & Tahir Reference Drummond and Tahir1984; Jackson & James Reference Jackson and James1986). (b) Spatio-temporal evolution of
 $H(\bar {r},\bar {t})$
, computed with (3.16a
), for two retraction speeds
 $\overline {V}$
and fixed values of
 $\bar {\delta }$
and
 $\bar {h}_J$
. (c) Evolution of the transition speed
 $\overline {V}_{T}$
as a function of
 $\bar {h}_{J}$
for two values of
 $\bar {\delta }$
. The dotted curve corresponds to the fit (3.18). Pressure field
 $\bar {p}=p/\rho g L_0$
(d) and velocity field normalised by
 $V$
at
 $\bar {t}=0.33$
(e) and at
 $\bar {t}=0.66$
(f) for
 $\overline {V}=0.25$
,
 $\bar {\delta } = 0.5$
and
 $\bar {h}_J=0.25$
corresponding to the top panel of (b). The colour map in (e,f) corresponds to the norm of the velocity
 $\bar {v}=|\boldsymbol{v}|/V$
.

Introducing the following rescaled quantities:
 \begin{equation} \bar {r} = 2r/D, \quad (\bar {z},\bar {h},\bar {L},\bar {h}_{J},\bar {t},\bar {p}) = (z,h,L,h_J,V t,p/\rho g)/L_0, \end{equation}
equation (3.2) becomes
 \begin{equation} \frac {\partial ^2 \bar {p}}{\partial \bar {z}^2}+ \delta ^2 \frac {k_{\perp }(\bar {z})}{k_{\parallel }} \nabla _{\bar {r}}^2 \bar {p} =0, \quad \delta = \frac {2L_0}{D}. \end{equation}
Equation (3.5) is solved perturbatively by assuming that the system aspect ratio
 $\delta$
is small. In this case, the pressure can be expanded as a power series in
 $\delta$
:
 \begin{equation} \bar {p}(\bar {r},\bar {z}) = \bar {p}_0(\bar {r},\bar {z}) + \delta ^2 \bar {p}_1(\bar {r},\bar {z})+ \cdots . \end{equation}
Substituting (3.6) into (3.5), we obtain at order
 $\delta ^0$
and
 $\delta ^2$
 \begin{equation} \frac {\partial ^2 \bar {p}_0}{\partial \bar {z}^2}=0, \quad \frac {\partial ^2 \bar {p}_1}{\partial \bar {z}^2}=- \frac {k_{\perp }(\bar {z})}{k_{\parallel }} \nabla _{\bar {r}}^2 \bar {p}_0. \end{equation}
To solve (3.7), we assume that the pressure is hydrostatic below the immersed part of the brush,
 $p(r,-L) = \rho g L$
, and equal to the capillary pressure at the air–liquid interface,
 $p(r,h) = -\rho g h_J$
. Here,
 $L = L_0-Vt$
is the immersed length that decreases linearly in time as the brush is removed vertically from the bath at a constant speed
 $V$
. Using the rescaled variables (3.4) and the expansion (3.6), the boundary conditions for (3.7) read as
 \begin{equation} \bar {p}_0(\bar {r},-\bar {L}) = \bar {L}, \quad \bar {p}_0(\bar {r},\bar {h}) = -\bar {h}_{J}, \quad \bar {p}_1(\bar {r},-\bar {L}) = \bar {p}_1(\bar {r},\bar {h}) = 0. \end{equation}
Equations (3.7) together with (3.8) are easily solved. The solutions are
 \begin{align} \bar {p}_0(\bar {r},\bar {z}) &= (\mathcal{P}(\bar {r})-1)\, \bar {z} + \bar {L} \mathcal{P}(\bar {r}), \quad \mathcal{P} = \frac {\bar {h}(\bar {r})-\bar {h}_{J}}{\bar {h}(\bar {r})+\bar {L}}, \end{align}
 \begin{align} \bar {p}_1(\bar {r},\bar {z}) &= \frac {k_{\perp }}{6k_{\parallel }}\left [-\bar {z}^2 \left (\bar {z} + 3 \bar {L} \right ) \theta (-z)+ \frac {2\bar {L}^3 (\bar {h}(\bar {r})-\bar {z})}{\bar {L}+\bar {h}(\bar {r})}\right ]\nabla _{\bar {r}}^2 \mathcal{P}(\bar {r}). \end{align}
Note that the solutions are obtained at a given arbitrary time and the time dependence of the various functions is not indicated. Using the changes of variables (3.4), equation (3.1) for the velocities and (3.3) for the spatio-temporal evolution of the interface become
 \begin{align} v_{r}(\bar {r},\bar {z}) &= -\delta \, \frac {k_{\perp }(\bar {z})}{k_{\parallel }} V_{\parallel } \frac {\partial \bar {p}}{\partial \bar {r}}, \quad v_z(\bar {r},\bar {z}) = V - V_{\parallel } \left (\frac {\partial \bar {p}}{\partial \bar {z}} + 1\right ), \quad V_{\parallel }=\frac {k_{\parallel } \rho g}{\mu }, \end{align}
 \begin{align} \frac {\partial \bar {h}(\bar {r},\bar {t})}{\partial \bar {t}} &= \frac {v_z(\bar {r},\bar {h})}{V}. \end{align}
Substituting (3.10a ) into (3.10b ), we get
 \begin{equation} \frac {\partial \bar {h}}{\partial \bar {t}} = 1 - \frac {1}{\overline {V}} \left (\frac {\partial \bar {p}}{\partial \bar {z}} + 1\right )_{\bar {z} = \bar {h}}= 1 - \frac {1}{\overline {V}} \left (\frac {\partial \bar {p_0}}{\partial \bar {z}} + \delta ^2 \frac {\partial \bar {p_1}}{\partial \bar {z}} + 1\right )_{\bar {z} = \bar {h}}, \quad \overline {V} = \frac {V}{V_{\parallel }}, \end{equation}
where we used (3.6). From (3.9), we have
 \begin{equation} \left . \frac {\partial \bar {p}_0}{\partial \bar {z}}\right |_{\bar {z} = \bar {h}} = \mathcal{P}(\bar {r})-1, \quad \left . \frac {\partial \bar {p}_1}{\partial \bar {z}}\right |_{\bar {z} = \bar {h}} = -\frac {k_{\perp }}{3k_{\parallel }}\frac {\bar {L}^3 }{\bar {L}+\bar {h}(\bar {r})}\nabla _{\bar {r}}^2 \mathcal{P}(\bar {r}), \end{equation}
so that (3.11) becomes
 \begin{equation} \frac {\partial \bar {h}}{\partial \bar {t}} = 1 - \frac {\mathcal{P}(\bar {r})}{\overline {V}}+ \frac {\delta ^2}{3\overline {V}}\frac {k_{\perp }}{k_{\parallel }} \frac {\bar {L}^3 }{\bar {L}+\bar {h}(\bar {r})}\nabla _{\bar {r}}^2 \mathcal{P}(\bar {r}). \end{equation}
It is convenient to measure the position of the air–liquid interface with respect to its static initial position. Therefore, we have
 \begin{align} H(\bar {r},\bar {t}) &= \bar {h}(\bar {r},\bar {t}) - \bar {h}_J, \quad \mathcal{P} = \frac {H}{H + \bar {h}_J +\bar {L}}, \end{align}
 \begin{align} \nabla _{\bar {r}}^2 \mathcal{P} &= \frac {\partial ^2 \mathcal{P}}{\partial \bar {r}^2} + \frac {1}{\bar {r}} \frac {\partial \mathcal{P}}{\partial \bar {r}} =\frac {(\bar {h}_J+\bar {L})}{(H+\bar {h}_J +\bar {L})^2} \nabla _{\bar {r}}^2 H - \frac {2(\bar {h}_J+\bar {L})}{(H+\bar {h}_J +\bar {L})^3} \left [\frac {\partial H}{\partial \bar {r}}\right ]^2. \end{align}
Substituting (3.14) in (3.13), we finally get
 \begin{equation} \frac {\partial H}{\partial \bar {t}} = 1 - \frac {1}{\overline {V}} \left [\frac {H}{H + \bar {h}_J +\bar {L}} \right ]+ \frac {\delta ^2}{3\overline {V}}\frac {k_{\perp }}{k_{\parallel }} \frac {\bar {L}^3(\bar {h}_J + \bar {L})}{(H+\bar {h}_J +\bar {L})^3}\left [ \nabla _{\bar {r}}^2 H - \frac {2(\partial _{\bar {r}} H)^2}{(H+\bar {h}_J + \bar {L})}\right ]. \end{equation}
An alternative method to derive this equation is given in Appendix D.1. It appears that the last term of (3.15) is very small. Indeed, the relative error on the maximum value of
 $H(0,t)$
introduced by neglecting this term is at most 3.5 % when
 $0 \leqslant \bar {\delta } \leqslant 2$
,
 $0 \leqslant \overline {V} \leqslant 5$
and
 $0.1 \leqslant \bar {h}_J \leqslant 0.5$
(see Appendix D.2). Neglecting this term leads to the equation for the interface we use in the following:
 \begin{align} &\frac {\partial H}{\partial \bar {t}} = 1 - \frac {H}{\overline {V}(H + \bar {h}_J + \bar {L})}+ \frac {\bar {\delta }^2}{3\overline {V}} \frac {\bar {L}^3(\bar {L}+\bar {h}_J)}{(H+\bar {h}_J + \bar {L})^3}\nabla _{\bar {r}}^2 H, \end{align}
 \begin{align} &H=\frac {h-h_J}{L_0}, \quad \overline {V} = \frac {V}{V_{\parallel }}, \quad \bar {\delta }^2 = \frac {\delta ^2 k_{\perp }}{k_{\parallel }}, \quad V_{\parallel }=\frac {k_{\parallel } \rho g}{\mu }, \quad \bar {L}= 1-\bar {t}, \end{align}
where
 $H$
is the dimensionless height of the interface with respect to its initial (static) position,
 $\bar {L}=L/L_0$
is the relative variation of the immersion depth during the retraction and
 $H + \bar {h}_J + \bar {L} = (h + L)/L_0$
is the dimensionless wet length of the brush.
As expected, (3.16a
) involves the three dimensionless parameters
 $\overline {V}$
,
 $\overline {\delta }$
and
 $\overline {h}_j$
identified in § 2. For
 $\overline {V}\rightarrow \infty$
only the first term in (3.16a
) remains and
 $H(\overline {t})=\overline {t}$
(i.e. the fluid moves upwards with the brush). For finite
 $\overline {V}$
, there is a competition between this upwards motion and the fluid flowing out of the brush according to the last two terms in (3.16a
). The first of these two terms describes the vertical flow and involves the ratio between the height of the fluid on which gravity forces act and the wet length of the brush along which there is viscous friction. The last term results from the flow in the radial direction and is proportional to
 $\overline {\delta }$
, the vertical to horizontal flow rate ratio identified earlier.
Equation (3.16a
) requires an initial condition and two boundary conditions to be solved in the domain
 $0 \leqslant (\bar {r},\bar {t}) \leqslant 1$
:
 \begin{equation} H(\bar {r},0)=0, \quad \partial _{\bar {r}} H(\bar {r},\bar {t})|_{\bar {r} = 0} = H(1,\bar {t}) =0. \end{equation}
The initial condition comes from the definition of
 $H$
, the first boundary conditions stems from symmetry and the second one from the assumption that the pressure in the bath is hydrostatic for
 $r\geqslant D/2$
. In the limit of an infinitely wide brush,
 $L_0/D \to 0$
, the aspect ratio
 $\delta$
vanishes and the flow is everywhere unidirectional along the
 $z$
axis so that (3.16a
) becomes an ordinary differential equation (ODE) describing the motion of a flat horizontal interface (see Appendix D.5.1). Due to the perturbative scheme used to derive (3.16a
), it is expected to hold only when
 $\delta \ll 1$
. We show below that a good agreement with experiments is actually obtained up to
 $\delta$
of order 1.
3.2. Solutions of the equation for the interface
Except for some approximate analytical solutions at small and large retraction speed derived in Appendix D.5, (3.16a
) must be solved numerically. We used the NDSolve command of Mathematica 14.1 for this purpose. Figure 2(b) shows the spatio-temporal evolution of the air–liquid interface,
 $H(\bar {r},\bar {t})$
, obtained from (3.16a
) for some typical values of
 $\bar {\delta }$
and
 $\bar {h}_J$
, when a brush is removed from a liquid bath at two different retraction speeds. At low retraction speed, the height of the interface measured along the central axis of the brush,
 $H_0(\bar {t}) \equiv H(0,\bar {t})$
, reaches a maximum value,
 $H_0^m$
, before the end of retraction (
 $\bar {t} \lt 1$
). In this case, we thus have
 $H_0^m \gt H_0(1)$
. In contrast, at large retraction speed,
 $H_0(\bar {t})$
grows monotonically during the retraction and thus reaches its maximum value at the end of the retraction (
 $\bar {t} = 1$
). In this case, we have
 $H_0^m = H_0(1)$
. The transition between these two types of behaviours occurs at a speed
 $\overline {V}_{T}$
such that
 $\dot {H}_0(1)=0$
, where the overdot denotes a time derivative. Evaluating (3.16a
) at
 $\bar {t}=1$
where
 $\bar {L}=0$
and imposing
 $\dot {H}_0(1)=0$
shows that this transition occurs when
 $H_0(1) = \overline {V}_{T} \bar {h}_J /(1-\overline {V}_{T})$
. Since
 $H_0(1) \leqslant 1$
(i.e. the interface cannot move faster than the brush), we obtain the upper limit
 $\overline {V}_{T} \leqslant 1/(1+\bar {h}_J)$
. The actual value of
 $\overline {V}_{T}$
can be computed numerically from (3.16a
). Figure 2(c) shows the evolution of
 $\overline {V}_{T}$
as a function of
 $\bar {h}_{J}$
for some values of
 $\bar {\delta }$
. It is seen that
 $\overline {V}_{T}$
is insensitive to the value of
 $\bar {\delta }$
when it is smaller than about 2. In this case,
 $\overline {V}_{T}$
can be fitted by
 \begin{equation} \overline {V}_{T} \approx \frac {1}{1+2.6\, \bar {h}_{J}^{6/5}}, \quad \text{for} \quad 10^{-2} \leqslant \bar {h}_{J} \leqslant 10^2 \quad \text{and} \quad \bar {\delta } \lesssim 2. \end{equation}
Once
 $H$
is obtained numerically, the pressure and velocity fields can be computed from their analytical expressions (3.6), (3.9) and (3.10a
). Figure 2(d) shows the pressure fields at
 $\bar {t}=0.33$
for the evolution of
 $H$
shown in the top panel of figure 2(b). Figures 2(e) and 2(f) show the corresponding velocity field at
 $\bar {t}=0.33$
and
 $\bar {t}=0.66$
, respectively. The pressure gradient is essentially constant along
 $z$
and vanishing along
 $r$
almost everywhere within the brush except near the rim (
 $\bar {r}=1$
) where it is steeper in both directions leading to a larger magnitude of the velocity. The velocity field is thus mainly unidirectional near the central axis and bidirectional near the rim where the liquid escapes radially from the brush. At
 $\bar {t}=0.33$
, the interface is moving upward since
 $H_0^m$
is reached at
 $\bar {t}=0.56$
in this example. The velocity is hence oriented upward except near the rim where the liquid is moving also radially near the bath level. In contrast, at
 $\bar {t}=0.66$
, the interface is moving downward and the velocity is hence oriented towards the bath except near the rim where the liquid is moving upward and also radially near the bath level, which results in a region where the sign of
 $v_z$
changes (near
 $\bar {r} \simeq 0.7$
).
An important test of the model is the rationalisation of the complex evolution of
 $H_0^m$
shown in figure 1(f), where the largest values of
 $H_0^m$
are not necessarily reached for the largest retraction speeds or immersion depths according to the porosity of the brushes. This complexity is related to the existence of three dimensionless groups of parameters governing the dynamics:
 $\overline {V}$
,
 $\bar {h}_J$
and
 $\bar {\delta }$
. To get an insight into the variation of
 $H_0^m$
, we show in figure 3(a) its variation as a function of the retraction speed for several values of
 $\bar {\delta }$
and
 $\bar {h}_J$
computed from (3.16a
). When
 $\overline {V} \lesssim \overline {V}_{T}$
, i.e. when
 $H_0^m$
is reached at
 $\bar {t} \lt 1$
,
 $H_0^m$
evolves linearly with
 $\overline {V}$
and is written as
 $H_0^m = C(\bar {h}_J,\bar {\delta }) \overline {V}$
. The evolution of
 $C(\bar {h}_J,\bar {\delta })$
with
 $\bar {h}_J$
is given in figure 3(b) for several values of
 $\bar {\delta }$
. As explained, the overall variation of
 $H_0^m$
involves the three dimensionless control parameters and reads as
 \begin{equation} H_0^m \simeq [\bar {h}_J+\alpha (\bar {\delta })]\, \overline {V}, \quad \alpha ^2(x)\approx \tanh [1/(2 x)^2], \quad \overline {V} \lesssim \overline {V}_{T}, \end{equation}
where
 $\alpha$
, computed numerically, and its approximate expression given above are shown in figure 3(c).
(a) Theoretical evolution of the largest value of
 $H_0$
in the time interval
 $0 \leqslant \bar {t} \leqslant 1$
,
 $H_0^m$
, as a function of
 $\overline {V}$
for several values of
 $\bar {\delta }$
and
 $\bar {h}_J$
. The dots on the curves indicate the value
 $\overline {V}_{T}$
of the retraction speed beyond which
 $H_0^m$
is reached at
 $\bar {t}=1$
. At low
 $\overline {V}$
,
 $H_0^m$
varies linearly with
 $\overline {V}$
,
 $H_0^m = C(\bar {h}_J,\bar {\delta }) \overline {V}$
. (b) Evolution of
 $C(\bar {h}_J,\bar {\delta })$
as a function of
 $\bar {h}_J$
for several values of
 $\bar {\delta }$
. The numerical data are fitted by
 $C = \bar {h}_J + \alpha (\bar {\delta })$
. (c) Evolution of
 $\alpha$
as a function of
 $\bar {\delta }$
together with the fit
 $\alpha ^2(x)\approx \tanh [1/(2 x)^2]$
. (d) Evolution of the height of the interface at the end of the retraction,
 $H_0(1)$
, as a function of
 $\overline {V}$
for several values of
 $\bar {h}_J$
and
 $\bar {\delta }$
. The circular dots on the curves indicate the value
 $\overline {V}_{T}$
. At low
 $\overline {V}$
,
 $H_0(1)$
varies linearly with
 $\overline {V}$
,
 $H_0(1) = S(\bar {h}_J) \overline {V}$
. (e) Evolution of
 $S(\bar {h}_J)$
as a function of
 $\bar {h}_J$
for several values of
 $\bar {\delta }$
. The numerical data are fitted by
 $S = \bar {h}_J$
. (f) Temporal evolution of
 $H_0(\bar {t})$
for
 $\overline {V}=10^{-2}$
and two values of
 $\bar {h}_J$
and
 $\bar {\delta }$
as indicated.

A similar result can be obtained for the height of the interface at the end of the retraction,
 $H_0(1)$
. Figure 3(d) shows the evolution of
 $H_0(1)$
as a function of the retraction speed for several values of
 $\bar {\delta }$
and
 $\bar {h}_J$
. When
 $\overline {V} \lesssim \overline {V}_{T}$
,
 $H_0(1)$
evolves linearly with
 $\overline {V}$
and is written as
 $H_0^m = S(\bar {h}_J) \overline {V}$
. The evolution of
 $S(\bar {h}_J)$
with
 $\bar {h}_J$
is given in figure 3(e) for several values of
 $\bar {\delta }$
. The overall variation of
 $H_0(1)$
reads as
 \begin{equation} H_0(1) \simeq \bar {h}_J\, \overline {V}, \quad \overline {V} \lesssim \overline {V}_{T}. \end{equation}
In contrast to
 $H_0^m$
,
 $H_0(1)$
is essentially insensitive to the value of
 $\bar {\delta }$
. This is due to the presence of
 $\bar {L}^3 = (1-\bar {t})^3$
in the term proportional to
 $\bar {\delta }$
in (3.16a
) which vanishes quickly as
 $\bar {t}\to 1$
. Figure 3(f) shows the effect of a variation of
 $\bar {\delta }$
by one order of magnitude on the temporal evolution of
 $H_0(\bar {t})$
. It is seen that
 $H_0^m$
changes significantly, but
 $H_0(1)$
remains essentially unchanged.
4. Comparison with experiments
Figure 4 shows snapshots of three different experiments involving three different brushes at four different instants, on which the corresponding theoretical profiles
 $h(r,t)$
of the air–liquid interface computed with (3.16a
) are superimposed. The agreement between the experimental and theoretical profiles of the air–liquid interface is quite good except, obviously, near the pillars because their wetting by the liquid is not considered in the model (see also the last paragraph of § 5). As expected, the agreement slightly deteriorates near the edges of the brush, where capillary effects become important due to the connection between the interface and the bath through a meniscus at the rim of the brush. Hence, our approach satisfyingly captures the global shape of the interface during the motion.
Snapshots of three experiments showing the spatio-temporal evolution of the air–liquid interface within brushes together with the theoretical profiles
 $h(r,t)$
(solid yellow curves). Scale bars: 10 mm. Snapshots correspond to experiments (a)
 $\phi _1$
(
 $L_0 = 6$
mm) in figure 5(a) and (b)
 $\phi _2$
and (c)
 $\phi _3$
in figure 5(b).

Figure 5(a,b) shows a comparison between some typical temporal evolution of
 $H_0$
measured experimentally with various brushes and the corresponding theoretical evolution obtained by numerically solving (3.16a
). A good agreement between theory and experiments is observed for various retraction speeds, immersion depths and porosities even when
 $\delta$
is of order 1 and without any fitting parameter.
(a,b) Comparison between temporal variations of
 $H_0(\bar {t})$
measured experimentally (symbols) and computed from (3.16a
) (solid curves) for six brushes and four porosities. The data reported in (a) are those shown in figure 1(e) where the parameter values are given. The data reported in (b) correspond to:
 $(R,d)=$
 $(500, 2.0)$
[
 $\phi _1 = 0.77$
],
 $(300, 1.5)$
[
 $\phi _2 = 0.85$
],
 $(400, 1.75)$
[
 $\phi _3 = 0.81$
],
 $(650, 1.8)$
[
 $\phi _4 = 0.53$
], where
 $R$
and
 $d$
are given in μm and mm, respectively. Values of
 $V$
and
 $L_0$
are given, respectively, in mm min−1 and in mm and
 $\mu = 0.97$
Pa s. The corresponding dimensionless parameters vary in the range:
 $0.06 \leqslant \overline {V} \leqslant 0.91$
,
 $0.15 \leqslant \bar {\delta } \leqslant 1.30$
(
 $0.22 \leqslant \delta \leqslant 1.84$
) and
 $0.095 \leqslant \bar {h}_J \leqslant 1.27$
. (c) Evolution of
 $H_0^m$
measured experimentally (symbols) as a function of a rescaled retraction speed identified in (3.19) for the data shown in figure 1(f) (
 $0.022 \leqslant \overline {V} \leqslant 8.53$
). The grey area shows the region spanned by the theory when
 $\bar {\delta }$
and
 $\bar {h}_J$
are varied within the experimental range (
 $0.15 \leqslant \bar {\delta } \leqslant 1.30$
,
 $0.05 \leqslant \bar {h}_J \leqslant 1.27$
). The black curve is computed using their average value:
 $\bar {\delta }=0.73$
and
 $\bar {h}_J=0.35$
. (d) Evolution of
 $\overline {V}$
as a function of
 $\bar {h}_{J}$
for the data shown in figure 1(f). The symbols with a black edge indicate the data for which
 $H_0^m$
is reached at the end of the retraction when
 $\bar {t} = 1$
. For those data,
 $\overline {V} \gt \overline {V}_T$
as predicted by the theory, where
 $\overline {V}_T$
is given by (3.18) and shown as a black curve. Insets: evolution of
 $H_0$
as a function of
 $\bar {t}$
for some data.

Figure 5(c) shows a collapse of the experimental data onto the theoretical prediction when the raw data for
 $h_0^m-h_J$
reported in figure 1(f) are rescaled by
 $L_0$
and plotted as a function of the new dimensionless group identified in (3.19). The grey area in figure 5(c), where essentially all the data are located, highlights the region spanned by the theoretical variation of
 $H_0^m$
when the parameters
 $\bar {h}_J$
and
 $\bar {\delta }$
vary within their experimental range. The solid black curve shows the theoretical evolution of
 $H_0^m$
when the experimental average value of
 $\bar {h}_J$
and
 $\bar {\delta }$
is used.
Figure 1(f) shows the raw data in the parameter space
 $(V, h_0^m-h_J)$
where, as discussed in § 2, it is not possible to separate them into two groups where one group contains the data for which
 $h_0^m$
is reached before the end of the retraction and a second group where
 $h_0^m$
is reached at the end of the retraction. The model developed in § 3 predicts that, when
 $\overline {V} \gt \overline {V}_T(\bar {h}_{J})$
, where
 $\overline {V}_T$
is given by (3.18), the evolution of
 $H_0(\bar {t})$
is monotonic and thus
 $H_0^m$
is reached at
 $\bar {t}=1$
. Consequently, the curve
 $\overline {V}_T(\bar {h}_{J})$
in the parameter space
 $(\bar {h}_{J}, \overline {V})$
separates the data into two such groups. Figure 5(d) shows the evolution of
 $\overline {V}$
as a function of
 $\bar {h}_{J}$
for the data shown in figure 1(f). The data below the curve
 $\overline {V} = \overline {V}_T(\bar {h}_{J})$
correspond to a non-monotonic evolution of
 $H_0(\bar {t})$
, with a maximum
 $H_0^m$
reached at
 $\bar {t} \lt 1$
, whereas the data above that curve (with a black edge) correspond to a monotonic evolution of
 $H_0(\bar {t})$
, with a maximum
 $H_0^m$
reached at
 $\bar {t} = 1$
. The insets of figure 5(d) show three typical profiles
 $H_0(\bar {t})$
for data above, below and on the curve
 $\overline {V} = \overline {V}_T(\bar {h}_{J})$
.
5. Optimal brush design
Having validated the model through comparison with experimental data, we now focus our attention on the volume
 $\mathcal{V}$
of liquid captured at the end of retraction (
 $\bar {t} = 1$
), which reads as
 \begin{equation} \overline {\mathcal{V}} = \frac {\mathcal{V}}{\mathcal{V}_I} = 2 \phi \left [\int _0^1 H(\bar {r},1)\, \bar {r}\, {\textrm d}\bar {r} + \frac {\bar {h}_J}{2}\right ], \end{equation}
where
 $\mathcal{V} = 2\pi \phi \int _0^{D/2} h(r,L_0/V)\, r\, {\textrm d}r$
and
 $\mathcal{V}_I = \pi D^2 L_0/4$
. The quantity
 $\phi \mathcal{V}_I$
is thus the volume of liquid initially inside the brush below the bath level before retraction begins. Since
 $H(\bar {r},1)$
cannot be larger than 1, (5.1) implies that
 $\overline {\mathcal{V}} \leqslant \overline {\mathcal{V}}_{{up}} = \phi (1 + \bar {h}_J)$
. In experiments with a given brush and a given liquid, only the retraction speed
 $V$
and the immersion depth
 $L_0$
can be varied. Figures 1(d) and 1(e) show that the height reached by the interface at the end of retraction (
 $\bar {t} = 1$
), and thus the volume
 $\mathcal{V}$
, grows monotonically with
 $V$
and
 $L_0$
, respectively, for a given
 $\phi$
. Thus, there is no optimal retraction speed or immersion depth for a given brush capturing a given liquid. However, for a given liquid and given
 $V$
and
 $L_0$
, there exists an optimal brush maximising
 $\mathcal{V}$
. Indeed, increasing the porosity
 $\phi$
increases the volume available for the liquid inside the brush but also increases the permeabilities (figure 2
a) which reduces the height reached by the interface. The interplay between these two antagonistic contributions leads to a non-monotonic variation of
 $\mathcal{V}$
with
 $\phi$
.
To determine the optimal porosity, we rewrite the parameters in (3.16a
) as follows to make explicit the dependence on
 $\phi$
:
 \begin{equation} \overline {V} = \frac {\widetilde {V}}{F_{\parallel }(\phi )}, \quad \frac {\bar {\delta }^2}{\overline {V}} = \frac {\delta ^2}{\widetilde {V}} F_{\perp }(\phi ), \quad \bar {h}_J = \tilde {h}_J \frac {\sqrt {1-\phi }}{\phi }, \end{equation}
where
 $\widetilde {V} = \mu V/(\rho g d^2)$
,
 $\tilde {h}_J = 2 \sqrt {2\pi }\ell _c^2 \cos \theta _Y /(3^{1/4} {\textrm d} L_0)$
and the expressions of
 $F_{\parallel }$
and
 $F_{\perp }$
given in figure 2(a). Here
 $\tilde {h}_J$
is obtained from (2.1) with
 $R$
expressed as a function of
 $d$
and
 $\phi$
. Consequently,
 $H$
and thus
 $\overline {\mathcal{V}}$
depend only on
 $\phi$
when
 $\widetilde {V}$
,
 $\delta$
and
 $\tilde {h}_J$
are fixed. We consider here that a variation of
 $\phi$
is due to a change of
 $R$
with
 $d$
fixed. By expressing
 $d$
as a function of
 $R$
and
 $\phi$
, we could alternatively consider that the variation of
 $\phi$
results from a change of
 $d$
with
 $R$
fixed with similar conclusions with respect to the existence of an optimal porosity.
Figure 6(a) shows the non-monotonic evolution of the rescaled volume
 $\overline {\mathcal{V}}$
with
 $\phi$
for various values of
 $\widetilde {V}$
with
 $\delta =1$
and
 $\tilde {h}_J = 1/2$
. This behaviour can be explained as follows. For a given value of
 $\widetilde {V}$
, the first of equations (5.2) together with the expression of
 $F_{\parallel }$
(figure 2
a) show that the rescaled retraction speed
 $\overline {V}$
is large when
 $\phi$
is small. In this limit, (3.16a
) shows that
 $H(\bar {r},1) \simeq 1$
so that, according to (5.1),
 $\overline {\mathcal{V}} \simeq \overline {\mathcal{V}}_{{up}}=\phi + \tilde {h}_J \sqrt {1-\phi }$
. The amount of liquid captured thus grows linearly with
 $\phi$
when the latter is small enough (see figure 6
a). In contrast, when
 $\phi \to 1$
, there is no capillary rise or viscous entrainment and
 $\overline {\mathcal{V}}$
vanishes. Therefore,
 $\overline {\mathcal{V}}$
necessarily features a maximum value at some intermediate value of
 $\phi$
.
(a) Evolution of the rescaled volume captured by a brush,
 $\overline {\mathcal{V}}$
, defined in (5.1), as a function of the porosity,
 $\phi$
, for
 $\delta =1$
,
 $\tilde {h}_J=0.5$
and various values of
 $\widetilde {V}$
(see (3.5) and (5.2) for the definition of these parameters). The dashed curve shows the limiting value
 $\overline {\mathcal{V}}_{{up}} = \phi + \tilde {h}_{J} (1-\phi )^{1/2}$
reached at large retraction speed when the column of liquid initially inside the brush is entirely pulled out of the bath. (b) Evolution of the optimal porosity,
 $\phi _{{opt}}$
, corresponding to the maximum of
 $\overline {\mathcal{V}}$
shown in (a), as a function of
 $\widetilde {V}$
for several values of
 $\delta$
and
 $\tilde {h}_J$
together with the fits (5.3). The horizontal dashed lines are analytical estimations,
 $\phi _{{opt}} = 1- \tilde {h}_{J}^2/4$
, obtained by using
 $\overline {\mathcal{V}}_{{up}}$
for the volume of liquid captured. (c) Measured mass of liquid,
 $m_{{liq}}$
, captured at the end of the retraction process by brushes with various pillar radii
 $R$
(expressed in μm) for two retraction speeds (expressed in mm min−1) and
 $d=1.8$
mm,
 $L_0 = 10$
mm,
 $\mu = 0.97$
Pa s. The solid curves correspond to the mass computed with the theory:
 $m_{{liq}} = \rho \, \mathcal{V}$
, where
 $\mathcal{V}$
is given in (5.1). Diameters
 $D=15.8$
mm and
 $D=16.8$
mm were used in the theory for
 $V = 10$
and
 $V = 100$
mm min−1, respectively (see also Appendix D.4). The dashed curves correspond to the theory where the mass of the liquid deposited along each pillar during the retraction is considered by adding
 $m_{{LLD}} = \rho \mathcal{V}_{{LLD}}$
to
 $m_{{liq}}$
where
 $\mathcal{V}_{{LLD}}$
is given by (5.4).

Figure 6(b) shows the variations of the optimal porosity,
 $\phi _{{opt}}$
, as a function of
 $\widetilde {V}$
for several values of
 $\delta$
and
 $\tilde {h}_J$
. At large retraction speed,
 $\phi _{{opt}}$
saturates to a constant value that can be estimated using the simple expression of the upper limit
 $\overline {\mathcal{V}}_{{up}}$
which features a maximum for
 $\phi = 1-\tilde {h}_J^2/4$
. This estimation is shown as horizontal dashed lines in figure 6(b) and its difference from the numerical results is due to the flatness of
 $\overline {\mathcal{V}}$
around its maximum as seen in figure 6(a). For example, for
 $\tilde {h}_{J} = (12/5)^{1/2}$
, the relative error on the limiting value of
 $\phi _{{opt}}$
at large
 $\widetilde {V}$
is about 9 % but the relative error on the volume captured
 $\overline {\mathcal{V}}$
is only about 0.025 %. Neglecting the small influence of
 $\delta$
, the evolution of
 $\phi _{{opt}}$
is rather well described by the following expression:
 \begin{equation} \phi _{{opt}} \approx A(\tilde {h}_J) \tanh \big(B(\tilde {h}_J)\,\widetilde {V}^{1/4} \big),\quad A = 1-0.263\, \tilde {h}_{J}^2, \quad B = 1.7 + 0.041 \, {\textrm e}^{2.5 \, \tilde {h}_{J}}. \end{equation}
The optimal porosity therefore varies significantly when
 $\widetilde {V} \lesssim 1$
and saturates to a constant value when
 $\widetilde {V} \gtrsim 1$
.
The existence of an optimal porosity has been verified experimentally. For this purpose, various brushes with a fixed number of pillars (
 $N_p = 73$
), a fixed distance between their centres (
 $d=1.8$
mm) and various pillar radii (
 $400 \leqslant R \leqslant 750$
μm) were immersed at a given depth (
 $L_0 = 10$
mm) and removed at two retraction speeds (
 $V = 10$
and
 $V= 100$
mm min−1) (supplementary movie S4). The mass of liquid
 $m_{{liq}}$
transported by these brushes when they are displaced by a distance
 $L_0$
has been measured by a traction device and is reported in figure 6(c). This mass is maximum for
 $R \simeq 700{-}750$
μm when
 $V = 10$
mm min−1 and
 $R \simeq 550{-}600$
μm when
 $V = 100$
mm min−1. These measurements are well described by the theory that predicts an optimal value
 $R=729$
and
 $R=571$
μm for
 $V = 10$
and
 $V = 100$
mm min−1, respectively.
Note that the model developed here does not take into account the small amount of liquid deposited on the pillars during the retraction due to the Landau–Levich–Derjaguin mechanism (Landau & Levich Reference Landau and Levich1942; Derjaguin Reference Derjaguin1943; Quéré Reference Quéré1999). The thickness,
 $h_{{LLD}}$
, of the film of liquid deposited on a pillar of radius
 $R$
and removed at a constant speed
 $V$
from a liquid bath is given by
 $h_{{LLD}} = 1.34 R\, {Ca}^{2/3}$
, where
 $Ca=\mu V/\gamma \ll 1$
is the capillary number. Therefore, the volume of liquid deposited on the brush can be estimated as
 $\mathcal{V}_{{LLD}} = N_p\, \pi [(R+h_{{LLD}})^2 - R^2] L_{{wet}}$
, where
 $N_p$
is the number of pillar and
 $L_{{wet}}$
is the wet length of the pillar above the air–liquid interface within the brush. Such a wet length exists because the pillars move at the imposed speed
 $V$
whereas the interface moves at a smaller speed. Due to this speed difference,
 $L_{{wet}}$
is maximum at
 $\bar {t} = 1$
. When a brush is immersed at a depth
 $L_0$
, the total length along each pillar in contact with the liquid is
 $h_J + L_0$
due to the initial capillary rise. Therefore, at the end of the retraction, the wet length on the pillars above the interface is
 $L_{{wet}} = h_J + L_0 - h_0(1)$
. Consequently, the volume to be added to the volume computed in (5.1) is given by
 \begin{equation} \mathcal{V}_{{LLD}} = N_p \pi R^2 L_0 \big[(1+1.34 \,{Ca}^{2/3})^2 - 1\big] [1-H_0(1)]. \end{equation}
Figure 6(c) shows that, in our experiments, the mass of liquid deposited along the pillars at the end of retraction is small compared with the mass transported by the brush and has essentially no impact on the optimal porosity. Finally, note that in the experiments reported in figure 6(c),
 ${Ca} \simeq 0.08$
when
 $V= 100$
mm min−1. For such a value of the capillary number, the White–Tallmadge (WT) extension, i.e.
 $h_{{WT}}= h_{{LLD}} / (1- 1.34 \,{Ca}^{2/3})$
, gives a better estimation of the thickness of the film deposited up to
 ${Ca}\simeq 0.5$
(White & Tallmadge Reference White and Tallmadge1966; Bense et al. Reference Bense, Siéfert and Brau2023). However, using
 $h_{{WT}}$
instead of
 $h_{{LLD}}$
in (5.4) produces small corrections varying between 0.12 % and 1.18 % when
 $R$
varies between 400 and 750 μm for
 $V= 100$
mm min−1 and smaller than 0.4 % for
 $V= 10$
mm min−1. Those corrections are thus not shown here.
6. Parallel plates removed from a liquid bath
The formalism developed in § 3.1 can be adapted to other geometries. For example, an equation similar to (3.16a
) can be obtained in Cartesian coordinates for two parallel plates separated by a distance
 $2d$
along the
 $x$
axis (see Appendix B for a schematic):
 \begin{align} \frac {\partial H}{\partial \bar {t}} &= 1 - \frac {H}{\overline {V}(H+ \bar {h}_J +\bar {L})} + \frac {\delta ^2}{3\overline {V}}\frac {\bar {L}^3 (\bar {h}_J+\bar {L})}{(H + \bar {h}_J +\bar {L})^3} \frac {\partial ^2 H}{\partial \bar {y}^2}, \end{align}
 \begin{align} \delta &= \frac {2L_0}{W}, \quad \bar {h}_J = \frac {h_J}{L_0} = \frac {\ell _c^2}{d L_0} \cos \theta _Y, \end{align}
where
 $H$
,
 $\overline {V}$
and
 $\bar {L}$
are defined as for a brush; see (3.16b
). The derivation of (6.1a
) is similar to that performed in § 3.1 and is given in Appendix E for completeness. Equation (6.1a
) is solved with the initial condition
 $H(\bar {y},0)=0$
and the boundary conditions
 $\partial _{\bar {y}} H(\bar {y},\bar {t})|_{\bar {y} = 0} = H(1,\bar {t}) =0$
.
6.1. Experiments and comparison with theory
Figure 7(a) shows a typical spatio-temporal evolution of the air–liquid interface between two parallel plates removed at a constant speed from a liquid bath (see supplementary movie S5). The corresponding theoretical profiles
 $h(r,t)$
computed with (6.1a
) are superimposed.
(a) Snapshots of an experiment showing the spatio-temporal evolution of the air–liquid interface between two parallel plates (
 $d=1.58$
mm,
 $W=75$
mm,
 $L_0=42.8$
mm,
 $V=1000$
mm min−1) together with the theoretical profiles
 $h(r,t)$
(solid yellow curves). The red dashed line indicates the position of the interface at
 $t=0$
(i.e.
 $h=h_J$
). (b,c) Comparison between some temporal variations of
 $H_0(\bar {t})$
measured experimentally (symbols) and computed from (6.1a
) (solid curves) for two parallel plates:
 $L_0 = 40$
mm (disk),
 $L_0 = 10$
mm (diamond),
 $L_0 = 42$
mm (square),
 $L_0=42.8$
mm (cross),
 $0.8 \leqslant \delta \leqslant 1.14$
and
 $\mu = 0.097$
Pa s. Values of
 $d$
and
 $W$
are given in mm and
 $V$
in mm min−1. (d) Evolution of
 $h_0^m-h_J$
as a function of retraction speed for various
 $d$
and
 $W$
, where
 $20 \leqslant V \leqslant 2000$
mm min−1,
 $5\leqslant L_0 \leqslant 65$
mm and
 $\mu =0.097$
Pa s except for the symbols with a red edge where
 $\mu =0.97$
Pa s.

Figure 7(b,c) shows a comparison between some typical temporal evolution of
 $H_0$
obtained experimentally and the corresponding theoretical evolution obtained by solving numerically (6.1a
). A good agreement between theory and experiments is observed for various retraction speeds and immersion depths even when
 $\delta$
is of order 1. The impact of the retraction speed
 $V$
and immersion depth
 $L_0$
on
 $H_0$
is qualitatively similar to what is observed for a brush. For a given system,
 $H_0$
reaches a maximum value,
 $H_0^m$
, before the end of the retraction when
 $V$
is small enough whereas
 $H_0^m$
is reached at the end of the retraction at large speed. The transition speed
 $\overline {V}_{T}$
can be computed from (6.1a
) and is essentially identical to that obtained for brushes (see (3.18)) provided the aspect ratio is not too large, i.e.
 $\delta \lesssim 1.5$
.
As for the case of brushes, the dynamics is governed by three dimensionless groups of parameters,
 $\overline {V}$
,
 $\bar {h}_J$
and
 $\delta$
, and is thus fairly complex, as shown by the intricate experimental data gathered in figure 7(d). To rationalise those data, we follow the same procedure as above and analyse the behaviour of
 $H_0^m$
using (6.1a
). Figure 8(a) shows the evolution of
 $H_0^m$
as a function of the retraction speed for several values of
 $\delta$
and
 $\bar {h}_J$
. When
 $\overline {V} \lesssim \overline {V}_{T}$
, i.e. when this maximal value is reached at
 $\bar {t} \lt 1$
,
 $H_0^m$
evolves linearly with
 $\overline {V}$
. The evolution of the slope with
 $\bar {h}_J$
is given in figure 8(b) for several values of
 $\delta$
. Hence, we find that
 $H_0^m$
is described by an equation similar to that obtained for brushes:
 \begin{equation} H_0^m \simeq [\bar {h}_J+\beta (\delta )]\, \overline {V}, \quad \overline {V} \lesssim \overline {V}_{T}, \end{equation}
where
 $\beta \approx \alpha (3 x/4)$
is shown in figure 8(c) and
 $\alpha$
given in (3.19).
(a) Evolution of the largest value of
 $H_0$
in the time interval
 $0 \leqslant \bar {t} \leqslant 1$
,
 $H_0^m$
, as a function of
 $\overline {V}$
for several values of
 $\delta$
and
 $\bar {h}_J$
and computed from (6.1a
). The circular dots on the curves indicate the value
 $\overline {V}_{T}$
. At low
 $\overline {V}$
,
 $H_0^m$
varies linearly with
 $\overline {V}$
,
 $H_0^m = C(\bar {h}_J,\delta ) \overline {V}$
. (b) Evolution of
 $C(\bar {h}_J,\delta )$
as a function of
 $\bar {h}_J$
for several values of
 $\delta$
. The numerical data are fitted by
 $C = \bar {h}_J + \beta (\delta )$
. (c) Evolution of
 $\beta$
as a function of
 $\delta$
together with the fit
 $\beta (x) \approx \alpha (3 x/4)$
, where
 $\alpha$
is given in (3.19). (d) Evolution of
 $H_0^m$
measured experimentally (symbols) as a function of a rescaled retraction speed for the data shown in figure 7(d). The dimensionless control parameters vary in the range:
 $0.024 \leqslant \overline {V} \leqslant 0.96$
,
 $0.13 \leqslant \delta \leqslant 2.0$
,
 $0.023 \leqslant \bar {h}_J \leqslant 0.92$
. The black curve is computed using the average value of
 $\delta$
and
 $\bar {h}_J$
:
 $\delta =1.0$
and
 $\bar {h}_J=0.15$
. (e) Evolution of the rescaled volume captured by two parallel plates,
 $\overline {\mathcal{V}}$
, defined in (6.4), as a function of their rescaled distance
 $\bar {d}$
for
 $\delta =1$
and several values of
 $h^{\star }_J$
. Both
 $\bar {d}$
and
 $h^{\star }_J$
are defined in (6.3). (f) Evolution of the optimal distance,
 $\bar {d}_{{opt}}$
, between two plates corresponding to the maximum of
 $\overline {\mathcal{V}}$
shown in (e) as a function
 $h^{\star }_J$
for several values of
 $\delta$
. Inset: evolution of
 $\bar {d}_{{opt}}^{\,0} = \bar {d}_{{opt}}(h^{\star }_J \to 0)$
as a function of
 $\delta$
together with the fit (6.5a
).

In this case too, our approach satisfyingly captures the experimental observations. Figure 8(d) shows a collapse of the experimental data reported in figure 7(d) onto the theoretical prediction when
 $h_0^m-h_J$
are rescaled by
 $L_0$
and plotted as a function of the new dimensionless group identified in (6.2). The grey area in figure 8(d) highlights the region spanned by the theoretical variation of
 $H_0^m$
when the parameters
 $\bar {h}_J$
and
 $\delta$
are varied within their experimental range. The solid black curve shows the theoretical evolution of
 $H_0^m$
when the experimental average value of
 $\bar {h}_J$
and
 $\delta$
is used.
6.2. Optimal plate distance for fluid capture by viscous entrainment
From the analysis performed for brushes in § 5, one could think that there is no optimal geometry when two parallel plates are removed from a bath because the porosity is equal to 1. However, increasing the distance
 $2d$
between the plates increases the volume available for the liquid but also increases the permeabilities,
 $k_{\parallel }=k_{\perp }=d^2/3$
, which reduces the height reached by the interface. Here again, the interplay between these two antagonistic contributions leads to a non-monotonic variation of the volume of liquid captured by viscous entrainment when
 $d$
is varied. To gain quantitative insight into this mechanism, we rewrite the two
 $d$
-dependent parameters of (6.1a
) as follows:
 \begin{equation} \overline {V} = (\tilde {d}/d)^2 = 1/\bar {d}^{\, 2}, \quad \bar {h}_J = h^{\star }_J/\bar {d}, \end{equation}
with
 $\tilde {d}^{\, 2} = 3\mu V/(\rho g)$
,
 $h_J = \ell _c^2 \cos \theta _Y /d$
,
 $\bar {h}_J = h_J /L_0$
and
 $h^{\star }_J=\ell _c^2 \cos \theta _Y/(\tilde {d} L_0)$
. The volume of liquid,
 $\mathcal{V}$
, captured at the end of retraction,
 $\bar {t}=1$
, is written as
 \begin{equation} \overline {\mathcal{V}} = \frac {\mathcal{V}}{\mathcal{V}_I} = 1+ \frac {\bar {d}}{h^{\star }_J} \int _0^1 H(\bar {y},1) {\textrm d}\bar {y}, \end{equation}
where
 $\mathcal{V} = 2d \int _{-W/2}^{W/2} h(y,L_0/V) \, {\textrm d}y$
,
 $\bar {y}=2y/W$
and
 $\mathcal{V}_I = 2{\textrm d}W h_J = 2W \ell _c^2 \cos \theta _Y$
is the volume initially between the two plates above the liquid bath level. Consequently,
 $H$
and thus
 $\overline {\mathcal{V}}$
depend only on
 $\bar {d}$
when
 $\delta$
and
 $h^{\star }_J$
are fixed.
Figure 8(e) shows the non-monotonic variation of
 $\overline {\mathcal{V}}$
as a function of
 $\bar {d}$
for given values of
 $\delta$
and
 $h^{\star }_J$
. Figure 8(f) shows the variation of
 $\bar {d}_{{opt}}$
, corresponding to the maximum of
 $\overline {\mathcal{V}}$
in figure 8(e), as a function of
 $h^{\star }_J$
for several value of
 $\delta$
. The rescaled optimal distance
 $\bar {d}_{{opt}}$
does not depend on
 $h^{\star }_J$
when it is small and varies weakly with
 $\delta$
(see the inset of figure 8
f). For large
 $h^{\star }_J$
,
 $\bar {d}_{{opt}}$
does not depend on
 $\delta$
and varies as
 $(h^{\star }_J)^{1/3}$
, or in dimensional units (
 $\theta _Y=0$
)
 \begin{align} 2d_{{opt}} &\underset {h^{\star }_J \ll 1}{=} \frac {\sqrt {3}\, \tilde {d}}{ (1+0.075\, \delta ^{3/2})^{2/3}} = \frac {3\, (\mu V/\rho g)^{1/2}}{ (1+0.075\, \delta ^{3/2})^{2/3}}, \end{align}
 \begin{align} 2d_{{opt}} &\underset {h^{\star }_J \gg 1}{=} 1.88\, \tilde {d}\, (h^{\star }_J)^{1/3} = 2.71\, \left (\frac {\mu V \ell _c^2}{\rho g L_0}\right )^{1/3}. \end{align}
7. Conclusion
In summary, we have studied experimentally and theoretically the liquid captured when a rigid brush-like structure is withdrawn from a liquid bath. We experimentally observe how the amount of liquid transported by viscous entrainment depends on the brush porosity, the retraction speed and the immersion depth. This intricate dependence stems from the two-dimensional nature of the drainage flow and on its intricate time evolution with the brush withdrawal. We developed a theoretical analysis in which this three-dimensional flow is solved as a perturbation of the main gravity-driven vertical flow. This analysis yields a PDE that describes the spatio-temporal evolution of the air–liquid interface within the brush, and hence the evolution of the volume of liquid entrained by the brush at any time. The obtained equation depends on three dimensionless parameters that reveal the physical ingredients governing the capture of a fluid by viscous entrainment.
Our model shows excellent agreement with our experimental data. In particular, the (quasi) master curve obtained for the maximum height reached by the liquid within the brush during the retraction provides a universal law to predict the maximum amount of liquid that can be captured by viscous entrainment. The theoretical profiles of the air–liquid interface within the brush are also in good agreement with experimental ones except near the pillars and the edges of the brush where wetting and capillary effects, not considered in the model, become important. Using the insight provided by our model, we also determined under which conditions the amount of liquid captured at the end of the retraction is maximum. We showed that, for a given velocity and immersion depth, an optimal brush porosity exists. We computed it as a function of the system parameters and verified it experimentally.
The approach we developed here can be extended, in a straightforward manner, to other fibre arrangements using the appropriate longitudinal and transverse permeability coefficients. A natural extension of this work would be the study of soft brushes and the impact of the deformability of the structures on the liquid capture. The role of capillarity in the pinch-off (Eggers Reference Eggers1993) of the liquid bridge between the brush and the bath as the structure is fully removed and in the amount of liquid remaining in the brush when the drainage is completed is also yet to be rationalised. As a whole, this work provides experimental and theoretical advances to the physics of anisotropic porous media. In particular, the identification of optimal brushes for fluid capture has the potential to influence engineering applications in liquid manipulation and transfer.
Supplementary movies
Supplementary movies are available at https://doi.org/10.1017/jfm.2025.10300.
Acknowledgements
The authors thank the Micro-milli service platform (ULB) for access to its experimental facilities and A. Chafaï for his help in manufacturing the brushes.
Funding
We acknowledge support by the Fund for Scientific Research (FRS-FNRS) under research grants no. T.0025.19 (PDR ‘ElastoCap’) and no. J.0017.21 (CDR ‘FASTER’) and by the Federation Wallonia-Brussels (FWB) (Concerted Research Actions ‘Capture’). This project has received funding from the European Union’s Horizon 2020 research and innovation programme under Marie Sklodowska-Curie grant agreements no. 101027862 and no. 101102728.
Declaration of interests
The authors report no conflict of interest.
Author contributions
F.B. designed research; B.R., H.B., E.S., L.D., H.-A.B.H., F.B. performed research; B.R., H.B., E.S., L.D. analysed data; B.R., H.B., E.S., L.D., F.B. wrote the paper.
Appendix A. Brush preparation and experimental apparatus
The brushes were printed with a PolyJet 3D printer Eden260 from Stratasys, using VeroWhite or VeroClear resins. Holders for the brushes were three-dimensional printed using a FDM printer Ultimaker S5 and then glued to the brush with superglue. A vessel was filled with silicone oil (V100 or V1000,
 $\gamma =0.021$
N m−1,
 $\rho =970$
kg m
 $^{-3}$
) from Sigma-Aldrich. The brushes with their holder where attached to a gripper on a traction device (ZwickiLine Z0.5 from ZwickRoell) and dipped into the fluid at a given depth
 $L_0$
. When the capillary rise had reached its final height
 $h_J$
and no further flow was present within the structure, the brush was removed at a constant speed
 $V$
from the bath. The removal was recorded from the side with LED backlighting, using a Basler CMOS camera with a frame rate adjusted to the withdrawal speed. The height
 $h_0$
of the interface along the brush central axis was measured as a function of time using standard image analysis techniques using Python routines and ImageJ. The force acting on the brush during retraction was also recorded using a 10 N force sensor from ZwickRoell. Figure 9 shows that the programmed retraction speed can be maintained by the traction device over distances much larger than the immersion depth
 $L_0$
considered in this work and that this speed is reached within 20–30 ms after the beginning of the retraction.
Displacement of the crosshead of the traction machine (ZwickiLine Z0.5 from ZwickRoell) as a function of time for two programmed retraction speeds:
 $V=200$
mm min−1 (a,b) and
 $V=1000$
mm min−1 (c,d). (a,c) A constant retraction speed
 $V$
can be maintained over distances much larger than the immersion depth
 $L_0$
considered in this work. The maximum relative error on the programmed speed is 0.05 %. (b,d) The programmed retraction speed is reached within 20–30 ms after the beginning of the retraction.

The protocol we use to study viscous entrainment imposes two types of limits on the brushes that can be used. Firstly, the length of the pillars,
 $L_p$
, must be larger than
 $h_J$
otherwise the brush is completely filled by the capillary rise and there is no possible viscous entrainment. Secondly, the pillars should not be deflected by capillary forces so that the brush is indeed rigid. This implies that
 $L_p \lt \ell _{BC}$
, where
 $\ell _{BC}=(E R^3/8\gamma )^{1/2}$
is the bendocapillary length corresponding to the typical length above which capillary forces may bend a slender structure (Bico, Reyssat & Roman Reference Bico, Reyssat and Roman2018). These two conditions are fulfilled only if
 $h_J \lt \ell _{BC}$
that gives a constraint for the radius of the pillar:
 \begin{equation} R \gt 2\, \ell _c^{4/5} \left (\frac {\gamma }{E}\right )^{1/5} \left (\frac {1-\phi }{\phi }\right )^{2/5}. \end{equation}
This constraint is more stringent as
 $\phi$
is small. In our experiments,
 $\phi = 0.53$
is the smallest porosity we considered and (A1) gives then
 $R\gt 66$
μm (
 $E = 2$
GPa) which is much smaller than the smallest radius we used, i.e.
 $R=300$
μm.
Appendix B. Jurin’s height
When a solid with small interstices compared with the capillary length is put into contact with a liquid bath, the liquid rises inside the pores up to the so-called Jurin height minimising the surface energy,
 $U_S$
, and the work of the weight of the liquid rising in the pores,
 $U_G$
:
 \begin{equation} U = U_S + U_G = \gamma A_p + \gamma _{LS} A_{LS} + \gamma _{SV} A_{SV} + \rho g \int _{\mathcal{V}} z\, {\textrm d}\mathcal{V}, \end{equation}
where
 $\gamma$
,
 $\gamma _{LS}$
and
 $\gamma _{SV}$
are, respectively, the air–liquid, liquid–solid and solid–air surface energies,
 $A_p$
,
 $A_{LS}$
and
 $A_{SV}$
are, respectively, the area of the air–liquid, liquid–solid and solid–air interfaces,
 $\rho$
is the liquid density and
 $\mathcal{V}$
the volume of the liquid rising in the pores. Since the solid is in contact either with the liquid or with air, we have
 $A_{LS} + A_{SV} = A_T$
, where
 $A_T$
is the total area of the solid. In addition, considering a solid whose geometry is invariant along the vertical
 $z$
direction, we have
 $A_{LS} = z\, \ell _{LS}$
, where
 $\ell _{LS}$
is the length of the liquid–solid contact line in a given horizontal plane, and
 $\mathcal{V} = z\, A_p$
where
 $0\leqslant z\leqslant h_J$
. Finally, the Young–Laplace–Dupret law gives a relationship between the surface energies:
 $\gamma _{SV} - \gamma _{LS} = \gamma \cos \theta _Y$
, where
 $\theta _Y$
is the Young contact angle. Using these relations, (B1) evaluated at
 $z=h_J$
becomes
 \begin{equation} U(h_J) = \gamma A_p - \gamma \cos \theta _Y \ell _{LS} h_J + \gamma _{SV} A_{T} + \frac {\rho g}{2} A_p h_J^2. \end{equation}
The minimum of the energy is obtained from
 ${\textrm d}U/{\textrm d}h_J=0$
and yields the Jurin height:
 \begin{equation} h_J = \frac {\gamma }{\rho g} \frac {\ell _{LS}}{A_p} \cos \theta _Y = \ell _c^2 \frac {\ell _{LS}}{A_p} \cos \theta _Y, \end{equation}
where we have introduced the capillary length
 $\ell _c$
. For a capillary tube of circular cross-section of radius
 $R$
, we have
 $\ell _{LS}=2\pi R$
and
 $A_p = \pi R^2$
, so that
 $h_J = 2\ell _c^2 R^{-1} \cos \theta _Y$
as it should (de Gennes, Brochard-Wyart & Quéré Reference de Gennes, Brochard-Wyart and Quéré2004).
For two parallel plates of width
 $W$
and separated by a distance
 $2d$
(see figure 10
a,c), we have
 $\ell _{LS} = 2W$
and
 $A_p = 2d W$
so that
 \begin{equation} h_J = \frac {\ell _c^2}{d} \cos \theta _Y. \end{equation}
For an equilateral triangular array of cylinders of radius
 $R$
and separated by a distance
 $d$
(see figure 10
b,c), we have
 $\ell _{LS}=N\pi R$
and
 $A_p = N[\sqrt {3}d^2-2\pi R^2]/4$
, where
 $N$
is the number of unit cells in the solid. Equation (B3) becomes
 \begin{equation} h_J = \frac {2\ell _c^2}{R}\left [\frac {1-\phi }{\phi }\right ]\cos \theta _Y, \quad \phi = 1-\frac {2\pi }{\sqrt {3}}\frac {R^2}{d^2}, \end{equation}
where
 $1-\pi /(2\sqrt {3})\leqslant \phi \leqslant 1$
is the porosity of the solid (Princen Reference Princen1969). This theoretical expression compares well with experimental data reported in figure 10(d). For a square array of cylinders of radius
 $R$
and separated by a distance
 $d$
, we have
 $\ell _{LS} = 2N\pi R$
and
 $A_p = N[d^2-\pi R^2]$
, so that (B3) becomes
 \begin{equation} h_J = \frac {2\ell _c^2}{R}\left [\frac {1-\phi }{\phi }\right ]\cos \theta _Y, \quad \phi = 1-\frac {\pi R^2}{d^2}, \end{equation}
where
 $1-\pi /4\leqslant \phi \leqslant 1$
is the porosity of the solid (Princen Reference Princen1969).
Schematics of the systems. (a) Two parallel plates of width
 $W$
and separated by a distance
 $2d$
partially immersed in a liquid bath. The liquid rises up to
 $z=h_J$
between the plates. (b) Unit cell of an equilateral triangular array of cylinders of radius
 $R$
and separated by a distance
 $d$
. The liquid rises up to
 $z=h_J$
between the cylinders. (c) Horizontal cross-sections of the systems shown in (a,b) highlighting the pore area
 $A_p$
(blue area) and the length of the solid–liquid interface
 $\ell _{LS}$
(red curves). (d) Experimental measurements of the Jurin height in an equilateral triangular array of cylinders with various porosities together with the theoretical prediction (B5).

Appendix C. Permeability of an equilateral triangular array of pillars
When the porosity is sufficiently close to 1, the asymptotic expressions for the permeabilities of an equilateral triangular array of pillars are given by
 \begin{equation} \frac {k_{\parallel }}{R^2} = \frac {1}{4(1-\phi )}\left [-\ln (1-\phi ) - K + 2(1-\phi )-\frac {(1-\phi )^2}{2}\right ], \quad \frac {k_{\perp }}{k_{\parallel }} \simeq 1/2, \end{equation}
where
 $K= 1.498$
(Drummond & Tahir Reference Drummond and Tahir1984; Jackson & James Reference Jackson and James1986). Note that this is the same expression as for a square array of cylinders with
 $K = 1.476$
(Drummond & Tahir Reference Drummond and Tahir1984; Jackson & James Reference Jackson and James1986). Expansions at low porosity exist also for
 $k_{\parallel }$
but not for
 $k_{\perp }$
(Drummond & Tahir Reference Drummond and Tahir1984). For this reason, we used numerical simulations performed with the COMSOL Multiphysics®software to compute
 $k_{\parallel }$
and
 $k_{\perp }$
for all ranges of
 $\phi$
and fitted the numerical data as explained below.
To compute the longitudinal permeability
 $k_{\parallel }$
, an equilateral triangular domain is used in an
 $(x,y)$
plane where the length of each side is equal to
 $d$
and where cylinders of radius
 $R$
are centred at each vertex (see figure 11
a). This domain extends along the
 $z$
axis over a length
 $L_z$
. Non-slip and symmetric boundary conditions are imposed on the cylinder walls and at the interstices, respectively. A difference of pressure
 $\Delta p$
is applied at the two extremities of the system along the
 $z$
axis and the resulting flow rate
 $Q$
is computed. The longitudinal permeability is then given by
 \begin{equation} k_{\parallel } = \frac {\mu L_z Q}{S_{xy} \Delta p}, \quad S_{xy} = \frac {\sqrt {3}\, d^2}{4}. \end{equation}
Figure 11(b) shows that the asymptotic expression (C1) agrees well with the numerical data up to
 $\phi \simeq 0.4$
. This figure shows also that a good description of the numerical data over the entire range of
 $\phi$
is obtained with the following fit:
 \begin{equation} \frac {k_{\parallel }}{d^2} \approx \frac {1}{4}\left [1-\frac {\sqrt {3}\, R}{d}\right ]^{4.6}\left [1-\frac {\sqrt {3}}{8\pi }\left (\ln (1-\phi )+K-35(1-\phi )\right )\right ], \end{equation}
where the first factor has been added to obtain
 $k_{\parallel } = 0$
when
 $R/d = 1/\sqrt {3} \simeq 0.577$
since, in this case, there is no interstice between the cylinders and there is no flow. Note that this configuration is only possible with overlapping cylinders. With non-overlapping cylinders, the maximal value of
 $R/d$
is
 $1/2$
so that the minimal value of
 $\phi$
is
 $1-\pi /(2\sqrt {3}) \simeq 0.093$
. Note also that
 $d^2$
is chosen as the length scale for
 $k_{\parallel }$
in (C3) instead of
 $R$
as in (C1).
Permeabilities of an equilateral triangular of cylinders. (a) Magnitude of the velocity field of a longitudinal flow along the
 $z$
axis for three value of
 $R$
at a given
 $d$
. (b) Evolution of
 $k_{\parallel }/d^2$
as a function of the porosity
 $\phi$
obtained numerically together with the asymptotic relation (C1) and the fit (C3). (c) Magnitudes of the velocity and pressure fields for a transverse flow along the
 $x$
axis for three value of
 $R$
at a given
 $d$
. (d) Same as (c) for a transverse flow along the
 $y$
axis. Both cases lead to the same value of the permeability. (e) Evolution of
 $k_{\perp }/d^2$
as a function of the porosity
 $\phi$
together with the asymptotic relation (C1) and the fit (C5). (f) Evolution of the ratio
 $k_{\perp }/k_{\parallel }$
as a function of
 $\phi$
together with the ratio of the fits (C5) and (C3) and a simpler fit (C6).

To compute the transverse permeability
 $k_{\perp }$
, a two-dimensional domain of size
 $L_x =4d$
and
 $L_y=\sqrt {3}d$
with periodic boundary conditions along
 $x$
and
 $y$
is used and non-slip boundary conditions on the cylinder walls. A difference of pressure
 $\Delta p$
is applied at two extremities along the
 $x$
or the
 $y$
axis (see figure 11
c,d) and the resulting flow rate
 $Q$
per unit length is computed. The permeability is then given by
 \begin{equation} k_x = \frac {\mu L_x Q}{L_{y} \Delta p}, \quad k_y = \frac {\mu L_y Q}{L_{x} \Delta p}. \end{equation}
The numerical simulations give
 $k_x = k_y \equiv k_{\perp }$
as it should. Figure 11(e) shows that the asymptotic expression (C1) agrees well with the numerical data up to
 $\phi \simeq 0.4$
as for
 $k_{\parallel }$
. This figure shows also that a good description of the numerical data over the entire range of
 $\phi$
is obtained with the following fit:
 \begin{equation} \frac {k_{\perp }}{d^2} \approx \frac {1}{12.4}\left [1-\frac {2R}{d}\right ]^{2.5} \left [1-0.21(\ln (1-\phi )+K)\right ], \end{equation}
where the first factor has been added to obtain
 $k_{\perp } = 0$
when
 $R/d = 1/2$
because, in this case, there is no interstice between the cylinders for a transverse flow as the pillars are in self-contact. Again,
 $d^2$
is chosen as the length scale for
 $k_{\perp }$
in (C5) instead of
 $R$
as in (C1).
Figure 11(f) shows the evolution of
 $k_{\perp }/k_{\parallel }$
as a function of
 $\phi$
together with the ratio of the fits (C5) and (C3). The good agreement between the data and this ratio highlights the good quality of the fits. Nevertheless, the ratio of these fits yields a rather cumbersome expression. A good fit of the data can be obtained with a much simpler expression:
 \begin{equation} \frac {k_{\perp }}{k_{\parallel }} \approx \frac {1}{2} \left (1-a\exp [b (1-\phi )]\right )^2, \quad a = 3.4\times 10^{-4}, \quad b = 8.86. \end{equation}
Appendix D. Additional information about the model
D.1. Derivation of our model and link with previous studies
In this section we discuss the similarities between our model and the interface equations obtained in previous studies about gravity-driven flows in the viscous thin-film regime (e.g. Huppert Reference Huppert1982; Huppert & Woods Reference Huppert and Woods1995; Pritchard, Woods & Hogg Reference Pritchard, Woods and Hogg2001; Zheng et al. Reference Zheng, Soh, Huppert and Stone2013; Yu, Zheng & Stone Reference Yu, Zheng and Stone2017). In particular, we show that (3.15) could be obtained following the method employed in these previous studies, provided that the asymptotic analysis in
 $\delta \ll 1$
is performed in a consistent manner.
As introduced in Huppert (Reference Huppert1982), we start with the local continuity equation
 $\boldsymbol{\nabla } \cdot \textbf{v}=0$
integrated from
 $z=-L$
to
 $z=h$
along the vertical direction which, combined with the kinematic condition (3.3), provides an equation that relates the spatio-temporal evolution of the interface to the speed of the flow:
 \begin{equation} \frac {\partial \bar {h}(\bar {r},\bar {t})}{\partial \bar {t}} = \bar {v}_z(\bar {r},-\bar {L}) - \delta \, \bar {r}^{-1}\partial _{\bar {r}} \left [\bar {r}\, \int _{-\bar {L}}^{\bar {h}} \bar {v}_r(\bar {r},\bar {z}) {\textrm d}\bar {z} \right ], \end{equation}
where the rescaled speeds read
 $\bar {v}_i = v_i/V$
. Using the expressions (3.10a
) of the velocity field
 $v_i$
, we obtain a dimensionless equation that relates
 $h$
to the pressure field:
 \begin{equation} \frac {\partial \bar {h}(\bar {r},\bar {t})}{\partial \bar {t}} = 1 - \frac {1}{\overline {V}} \left (\left .\frac {\partial \bar {p}}{\partial \bar {z}}\right |_{\bar {z}=-\bar {L}} + 1\right ) + \delta ^2 \frac {k_{\perp }}{k_{\parallel } \overline {V}}\, \bar {r}^{-1}\partial _{\bar {r}} \left [\bar {r}\, \int _{-\bar {L}}^{0} \frac {\partial \bar {p}}{\partial \bar {r}} {\textrm d}\bar {z} \right ]. \end{equation}
In order to relate the pressure to the shape of the interface and obtain a closed equation for
 $h$
, one needs to derive the expression of the pressure field. When
 $\bar {v}_z(\bar {r},-\bar {L})=0$
, as in Huppert (Reference Huppert1982) and some other studies mentioned above, the equation for
 $h$
is obtained, at the dominant order, by taking
 $\bar {p}(\bar {r}, \bar {z})$
as the hydrostatic pressure. In our case, where
 $\bar {v}_z(\bar {r},-\bar {L}) \not = 0$
, this corresponds to using
 $p_0$
, given in dimensionless form by (3.9a
). This implies that terms of order
 $\delta ^2$
are neglected in the pressure fields, namely
 $p_1$
given by (3.9b
). Therefore, if
 $p_0$
is used as the pressure field, the last term proportional to
 $\delta ^2$
in (D2) must be omitted and this equation reduces to the ODE (D6). Consequently, to obtain, in a consistent way, a PDE describing the spatio-temporal evolution of the interface
 $h$
, we need to keep all the terms of order
 $\delta ^2$
, i.e. those in (D2) and those in the pressure field. Using the expansion (3.6) for the pressure, (D2) thus becomes
 \begin{equation} \frac {\partial \bar {h}(\bar {r},\bar {t})}{\partial \bar {t}} = 1 - \frac {1}{\overline {V}} \left (\left .\frac {\partial \bar {p}_0}{\partial \bar {z}}\right |_{\bar {z}=-\bar {L}} + 1\right ) + \frac {\delta ^2}{\overline {V}} \left \{\frac {k_{\perp }}{k_{\parallel }}\, \bar {r}^{-1}\partial _{\bar {r}} \left [\bar {r}\, \int _{-\bar {L}}^{0} \frac {\partial \bar {p}_0}{\partial \bar {r}} {\textrm d}\bar {z} \right ]- \left .\frac {\partial \bar {p}_1}{\partial \bar {z}}\right |_{\bar {z}=-\bar {L}} \right \}. \end{equation}
Substituting the expressions (3.9) of
 $\bar {p}_0$
and
 $\bar {p}_1$
in (D3) yields (3.15).
D.2. Influence of the advective term in the equation for the interface
We study here the influence on the interface profile of the last term of (3.15) which has been neglected to obtain (3.16a
). Figure 12(a,b) shows the relative error introduced by using (3.16a
) instead of (3.15) to compute
 $H_0^m$
for
 $0.05 \leqslant \overline {V} \leqslant 2$
and
 $0.05 \leqslant \bar {\delta } \leqslant 2$
and two values of
 $\bar {h}_J$
. Clearly, the influence of the neglected advective term on the values of
 $H_0^m$
is very small. Figure 12(c) shows the small deviations between
 $H(\bar {r},\bar {t})$
computed with both (3.15) and (3.16a
) for some representative values of the parameters shown by two crosses in figure 12(a).
D.3. Influence of the immersion depth
The influence of the retraction speed on
 $H_0^m$
and
 $H_0(1)$
has been well characterised. At small retraction speed, their expressions are given by (3.19) and (3.20). At large speed, they both tend to 1. We discuss briefly here the influence of the immersion depth on these two quantities.
Relative error on
 $H_0^m$
when
 $H(\bar {r},\bar {t})$
is computed with (3.16a
) instead of (3.15) as a function of
 $\overline {V}$
and
 $\bar {\delta }$
for
 $\bar {h}_J = 0.25$
(a) and
 $\bar {h}_J = 0.5$
(b). The two crosses correspond to illustrative cases shown in (c). (c) Spatio-temporal evolution of
 $H(\bar {r},\bar {t})$
computed with (3.16a
) (solid curves) and with (3.15) (dashed curves) for
 $\bar {\delta }=1.0$
(top panel) and
 $\bar {\delta }=1.8$
(bottom panel) with
 $\bar {V}=0.4$
,
 $\bar {h}_J=0.25$
for both panels. (d) Evolution of
 $(h_0^m-h_J)/h_J$
and
 $(h_0(1)-h_J)/h_J$
as a function of
 $L_0/h_J$
for
 $\tilde {\delta } \equiv \bar {\delta } \bar {h}_J = 0.1$
. The dashed curve indicates the short-time behaviour whereas the horizontal dashed-dotted and dotted curves are estimations of the saturation values obtained from (3.19) and (3.20), respectively. (e) Same as (d) for
 $\tilde {\delta } = 1$
. (f) Measured mass of liquid,
 $m_{{liq}}$
, captured at the end of the retraction process by brushes with various pillar radii
 $R$
for two retraction speeds (expressed in mm min−1) and
 $d=1.8$
mm,
 $L_0 = 10$
mm,
 $\mu = 0.97$
Pa s. The solid curves correspond to the mass computed with the theory. Diameters
 $D=15.8$
mm and
 $D=16.8$
mm were used in the theory for
 $V = 10$
and
 $V = 100$
mm min−1, respectively. The dashed curve corresponds to the theoretical curve at
 $V = 100$
mm min−1 when
 $D=15.8$
mm is used. See text for discussion.

Figure 12(d,e) shows the evolution of
 $(h_0^m-h_J)/h_J$
and
 $(h_0(1)-h_J)/h_J$
as a function of
 $L_0/h_J$
for two values of
 $\tilde {\delta } \equiv \bar {\delta } \bar {h}_J$
. We use here
 $h_J$
to rescaled
 $h_0-h_J$
instead of
 $L_0$
because
 $H_0^m$
and
 $H_0(1)$
would vary with
 $L_0$
for fixed values of
 $h_0^m$
and
 $h_0(1)$
. We also use
 $\tilde {\delta }$
instead of
 $\bar {\delta }$
because the former does not depend on
 $L_0$
. In other words, we use
 $h_J$
as a vertical length scale instead of
 $L_0$
in the change of variables (3.4).
These two figures show that, at small
 $L_0/h_J\equiv \bar {h}_J^{-1}$
, we have
 $h_0^m=h_0(1)$
. Indeed, as shown above,
 $h_0^m=h_0(1)$
only when
 $\overline {V} \gt \overline {V}_{T}$
. For a given value of
 $\overline {V} \lt 1$
, this happens only for
 $\bar {h}_J$
large enough (see figure 2
c and (3.18)) or, equivalently, for
 $L_0/h_J$
sufficiently small. It is also seen that
 $h_0^m=h_0(1)\simeq h_J + L_0$
when
 $L_0/h_J \ll 1$
. Indeed, as just discussed,
 $L_0/h_J \ll 1$
is equivalent to
 $\overline {V} \gg \overline {V}_{T}$
and in this case, the liquid moves at the same speed as the pillars, i.e.
 $h_0 = h_J + Vt$
, and at the end of retraction (
 $t = L_0/V$
), we have
 $h_0 = h_J + L_0$
. In other words, for small immersion depth, the time needed to completely remove a brush from a bath is small and the liquid has no time to flow out of the brush and just follow the pillars.
Figure 12(d,e) also shows, as expected, that the height of the interface saturates to a maximum value when
 $L_0$
is sufficiently large (
 $L_0 \gtrsim h_J$
). The saturation value for
 $h_0(1)$
can be estimated from (3.20) which can be written as
 $(h_0(1)-h_J)/h_J= \overline {V}$
. Each dotted line in figure 12(d,e) corresponds thus to
 $\overline {V}$
. Similarly, the saturation value for
 $h_0^m$
can be estimated from (3.19) which can be written as
 $(h_0^m-h_J)/h_J= [1+\alpha (\tilde {\delta }/\bar {h}_J)/\bar {h}_J] \overline {V}$
. In the limit
 $L_0/h_J \gg 1$
, i.e.
 $\bar {h}_J \ll 1$
, at fixed
 $\tilde {\delta }$
, the function
 $\alpha$
can be expanded using its approximate expression:
 \begin{equation} \alpha (x)\approx \left [\tanh [1/(2 x)^2]\right ]^{1/2} \simeq \frac {1}{2x} \quad \text{for}\quad x \gg 1. \end{equation}
Using this result, we have
 \begin{equation} \frac {h_0^m-h_J}{h_J}= \left [1+\frac {\alpha (\tilde {\delta }/\bar {h}_J)}{\bar {h}_J}\right ] \overline {V} \simeq \left [1+\frac {1}{2\tilde {\delta }}\right ] \overline {V}. \end{equation}
This last expression is shown as horizontal dashed-dotted lines in figure 12(d,e).
D.4. Discussion about the value of
 $D$
used to compute the mass of liquid captured

The value of the brush diameter
 $D$
affects significantly the (dimensional) mass of liquid computed from (5.1) since
 $\mathcal{V}$
is proportional to
 $D^2$
whereas the impact of
 $D$
on
 $H$
computed from (3.16a
) is much less pronounced, especially at the end of retraction. Indeed,
 $D$
appears only in the expression of
 $\bar {\delta }$
in (3.16a
) which has a negligible influence on profile of
 $H$
at the end of the retraction as seen in figure 3(d,f) where
 $\bar {\delta }$
varies by one order of magnitude. Therefore,
 $D^2$
acts as a scaling factor in the expression of
 $m_{{liq}} = \rho \mathcal{V}$
. However,
 $D$
is not well defined for our brushes (see figure 1
b), but it is expected to grow with the retraction speed as more liquid is then captured at the rim of the brush. The brush diameter could be defined as the diameter of the circle passing through the centres of the pillars at the rim of the brush (as shown in figure 1
b and
 $D= 15.8$
mm for the brushes used in figure 6
c) or passing through the borders of the pillars at the rim of the brush (
 $D' = D + 2R$
,
 $16.6 \leqslant D' \leqslant 17.4$
mm for these brushes). We found a good agreement with the data in figure 6(c) using
 $D=15.8$
and
 $D = 16.8$
mm for
 $V = 10$
and
 $V = 100$
mm min−1, respectively. The dashed curve in figure 12(f) shows how the theoretical curve is affected when
 $D=15.8$
mm is used for
 $V = 100$
mm min−1. The value of the optimal radius predicted by the theory is, of course, unaffected by a change of a multiplicative constant, i.e.
 $D^2$
, in the expression of
 $m_{{liq}}$
.
D.5. Approximate solutions of the PDE (3.16a )
D.5.1.
Values of
$\bar {\delta }$
below which the solutions with
$\bar {\delta }=0$
lead to good approximations


The PDE (3.16a
) reduces to an ODE when
 $\bar {\delta }=0$
which is simpler to deal with:
 \begin{equation} \frac {{\textrm d} H_0^{1D}}{{\textrm d} \bar {t}} = 1 - \frac {1}{\overline {V}} \left [\frac {H_0^{1D}}{1 + H_0^{1D} + \bar {h}_J -\bar {t}} \right ], \quad H_0^{1D}(0) = 0. \end{equation}
Here, we analyse under which conditions the temporal evolution of
 $H_0(\bar {t}) = H(0,\bar {t})$
is well approximated by
 $H_0^{1D}(\bar {t})$
. For this purpose, we define
 \begin{equation} \varepsilon (\overline {V}, \bar {h}_J, \bar {\delta }) = \frac {H_0^{1D,m}-H_0^m}{H_0^m}, \end{equation}
where
 $H_0^{1D,m}$
and
 $H_0^m$
are the largest values of
 $H_0^{1D}$
and
 $H_0$
in the interval
 $0 \leqslant \bar {t} \leqslant 1$
, respectively. Thus,
 $\varepsilon$
is the relative error on the largest value of
 $H_0$
and is always positive because
 $H_0^{1D,m}\geqslant H_0^m$
. Now, we define
 $\bar {\delta }_0$
such as
 \begin{equation} \varepsilon (\overline {V}, \bar {h}_J, \bar {\delta }_0) = 0.01, \quad \Rightarrow \quad \bar {\delta }_0 = \bar {\delta }_0(\overline {V}, \bar {h}_J). \end{equation}
Therefore, for a given system where
 $\overline {V}$
,
 $\bar {h}_J$
and
 $\bar {\delta }$
are known, if
 $\bar {\delta } \leqslant \bar {\delta }_0(\overline {V}, \bar {h}_J)$
, then the relative error on
 $H_0^m$
obtained by using (D6) instead of (3.16a
) is smaller than or equal to 1 %.
Figure 13(a) shows the evolution of
 $\bar {\delta }_0$
as a function of
 $\overline {V}$
and
 $\bar {h}_J$
. The three crosses indicate three illustrative cases shown in figure 13(b). For example, when
 $\overline {V}=0.1$
and
 $\bar {h}_J=0.2$
,
 $\bar {\delta }_0 \simeq 0.45$
. Therefore, if
 $\bar {\delta } \leqslant 0.45$
, the evolution of
 $H_0$
is well captured by
 $H_0^{1D}$
obtained from the ODE (D6) as seen in figure 13(b).
(a) Evolution of
 $\bar {\delta }_0$
, defined in (D7) and (D8), as a function of
 $\overline {V}$
and
 $\bar {h}_J$
. The crosses correspond to illustrative cases shown in (b). (b) Temporal evolution of
 $H_0$
computed with (3.16a
) for various values of
 $\overline {V}$
and
 $\bar {h}_J$
and
 $\bar {\delta } \simeq \bar {\delta }_0$
. The dashed lines show the temporal evolution of
 $H_0^{1D}$
computed with (D6). (c) Evolution of
 $\varDelta$
, defined in (D11), as a function of
 $\overline {V}$
and
 $\bar {h}_J$
for
 $\bar {\delta }=1$
. (d) Comparison between the temporal evolution of
 $H_0$
computed with (3.16a
) and the approximate expression
 $H_0^+$
, defined in (D10), for various values of
 $\overline {V}$
and
 $\bar {h}_J$
and
 $\bar {\delta }=1$
. In these examples,
 $\varDelta \lt 0.27$
for
 $\overline {V} = 1$
,
 $\varDelta \lt 0.73$
for
 $\overline {V} = 0.5$
and
 $\varDelta = 0.53$
for
 $\overline {V} = 0.2$
. (e) Evolution of
 $\varDelta$
, defined in (D11) with
 $H_0^{+}$
replaced by
 $H_0^{-}$
, as a function of
 $\overline {V}$
and
 $\bar {h}_J$
for
 $\bar {\delta }=1$
.
 $H_0^{-}$
is given by (D13). (f) Comparison between the temporal evolution of
 $H_0$
computed with (3.16a
) and the approximate expression
 $H_0^-$
for various values of
 $\bar {h}_J$
,
 $\overline {V}=0.01$
and
 $\bar {\delta }=0.1$
. In these examples,
 $0.76 \leqslant \varDelta \leqslant 0.99$
.

D.5.2. Analytical approximate solution for large retraction speed
In this regime,
 $1/\overline {V} \ll 1$
and we expand
 $H$
as follows:
 \begin{equation} H(\bar {r},\bar {t}) = \sum _{i=0} \overline {V}^{-i} \, H^{(i)}(\bar {r},\bar {t}). \end{equation}
Substituting this expansion into (3.16a
) and solving order by order, we get at order
 $\overline {V}^{\,0}$
,
 $H^{(0)}=\bar {t}$
as expected since this is the evolution of
 $H^{(0)}$
for an infinite retraction speed. Because
 $H^{(0)}$
does not depend on
 $\bar {r}$
, the other
 $H^{(i\gt 0)}$
are only functions of
 $\bar {t}$
. Therefore, in this approximation scheme, we have
 $H(\bar {r},\bar {t}) = H_0(\bar {t})$
. Up to order
 $\overline {V}^{-2}$
, we find
 \begin{equation} H_0(\bar {t}) \simeq H_0^+(\bar {t}) = t - \frac {1}{2 \overline {V} (1 + \bar {h}_J)}\, t^2 + \frac {4 + 4 \bar {h}_J - 3 t}{24\overline {V}^2 (1 + \bar {h}_J)^3} t^3. \end{equation}
To estimate the accuracy of this approximate solution, we define
 \begin{equation} \varDelta = 100 \int _0^1 \frac {|H_0(\bar {t}) - H_0^+(\bar {t})|}{H_0(\bar {t})} \, {\textrm d}\bar {t}, \end{equation}
so that
 $H_0^+$
gives a good approximation of
 $H_0$
when
 $\varDelta \lesssim 1$
. Figure 13(c) shows the evolution of
 $\varDelta$
as a function of
 $\overline {V}$
and
 $\bar {h}_J$
for
 $\bar {\delta }=1$
. Figure 13(d) shows some comparisons between
 $H_0(\bar {t})$
computed with (3.16a
) and
 $H_0^+(\bar {t})$
defined in (D10). In these examples,
 $H_0^+$
approximates well
 $H_0$
because
 $7\times 10^{-4} \leqslant \varDelta \leqslant 0.73$
.
D.5.3. Analytical approximate solution for small retraction speed
As shown above, when
 $\bar {\delta } \lt \bar {\delta }_{0}(\overline {V}, \bar {h}_J)$
, see (D8),
 $H_0^{1D}$
obtained by solving (D6) is a good approximation of the full solution
 $H_0$
. Here, we further assume that
 $\overline {V}\ll 1$
so that
 $H_0 \ll 1$
. In this case, linearising (D6) leads to
 \begin{equation} \frac {{\textrm d} H_0^{-}}{{\textrm d} \bar {t}} = 1 - \frac {1}{\overline {V}} \left [\frac {H_0^{-}}{1 + \bar {h}_J -\bar {t}} \right ], \quad H_0^{-}(0) = 0, \end{equation}
which can be solved exactly:
 \begin{equation} H_0^{-}(\bar {t}) = \frac {\overline {V}}{1-\overline {V}} [1 + \bar {h}_J -\bar {t}]\left [1-\left (\frac {1 + \bar {h}_J -\bar {t}}{1+\bar {h}_J}\right )^{(1-\overline {V})/\overline {V}}\right ]. \end{equation}
Figure 13(e) shows the evolution of
 $\varDelta$
, defined in (D11) with
 $H_0^{+}$
replaced by
 $H_0^{-}$
, as a function of
 $\overline {V}$
and
 $\bar {h}_J$
for
 $\bar {\delta }=0.1$
. Figure 13(f) shows some comparisons between
 $H_0(\bar {t})$
computed with (3.16a
) and
 $H_0^-(\bar {t})$
defined in (D13). In these examples,
 $H_0^-$
approximates well
 $H_0$
because
 $0.76 \leqslant \varDelta \leqslant 0.99$
.
Appendix E. Parallel plates: permeability and equation for the interface
For completeness, we give here the derivation of (6.1a ). We first compute the permeability before deriving the PDE.
E.1. Permeability
We consider here the flow between two immobile parallel plates as shown in figure 10(a). Since the
 $x$
direction is the confinement direction, the lubrication equations for a Newtonian and incompressible fluid read in Cartesian coordinates as
 \begin{equation} \mu \frac {\partial ^2 u_z}{\partial x^2} = \frac {\partial p}{\partial z} + \rho g, \quad \mu \frac {\partial ^2 u_y}{\partial x^2} = \frac {\partial p}{\partial y},\quad \frac {\partial p}{\partial x} = 0,\quad \frac {\partial u_x}{\partial x} + \frac {\partial u_y}{\partial y} + \frac {\partial u_z}{\partial z}=0. \end{equation}
Symmetry at
 $x=0$
and non-slip at the walls (
 $x=d$
) yields the following boundary conditions:
 \begin{equation} u_x = \frac {\partial u_y}{\partial x} = \frac {\partial u_z}{\partial x} = 0 \quad \text{at}\quad x = 0, \quad \quad u_z = u_y = u_x = 0 \quad \text{at}\quad x = d. \end{equation}
The third equation of (E1) yields
 $p = p(y,z)$
. The first and second equations of (E1) can then be easily integrated using the boundary conditions (E2) for
 $u_z$
and
 $u_y$
:
 \begin{equation} u_z(x,y,z) = \frac {(x^2-d^2)}{2\mu } \left (\frac {\partial p}{\partial z} + \rho g\right ), \quad u_y(x,y,z) = \frac {(x^2-d^2)}{2\mu } \frac {\partial p}{\partial y}. \end{equation}
Mass conservation, together with the boundary condition (E2) for
 $u_x$
at
 $x=0$
leads to
 \begin{equation} u_x = \frac {(3d^2 x - x^3)}{6\mu } \left (\frac {\partial ^2 p}{\partial y^2}+ \frac {\partial ^2 p}{\partial z^2}\right ) \quad \Rightarrow \quad \frac {\partial ^2 p}{\partial y^2}+ \frac {\partial ^2 p}{\partial z^2}=0, \end{equation}
where we used the boundary condition (E2) at
 $x=d$
for
 $u_x$
to obtain the equation for the pressure. This equation must be solved for
 $x=d$
but, because
 $p$
does not depend on
 $x$
, it is valid for any
 $x$
and
 $u_x\equiv 0$
. Because
 $p$
does not depend on
 $x$
and
 $u_x = 0$
, it is natural to consider the
 $x$
-averaged velocity field. We define
 \begin{equation} v_i(y,z) = \frac {1}{2d}\int _{-d}^{d} u_i(x,y,z)\, {\textrm d}x. \end{equation}
We then obtain an effective two-dimensional problem with the following velocity field:
 \begin{equation} v_y(y,z) = -\frac {d^2}{3\mu } \frac {\partial p}{\partial y} \equiv -\frac {k_{\perp }}{\mu } \frac {\partial p}{\partial y}, \quad v_z(y,z) = -\frac {d^2}{3\mu } \left (\frac {\partial p}{\partial z} + \rho g\right ) \equiv - \frac {k_{\parallel }}{\mu } \left (\frac {\partial p}{\partial z} + \rho g\right ). \end{equation}
The velocity is thus given by Darcy’s law with the permeabilities
 $k_{\perp }/d^2 = k_{\parallel }/d^2 = 1/3$
.
E.2. Pressure, velocity and equation for the interface for two parallel plates
The velocity and pressure fields of the fluid between two parallel plates separated by a distance
 $2d$
along the
 $x$
axis and removed along the
 $z$
axis at speed
 $V$
from a liquid bath is given by Darcy’s law in Cartesian coordinates:
 \begin{equation} v_{y}(y,z) = -\frac {k_{\perp }(z)}{\mu } \frac {\partial p}{\partial y}, \quad v_z(y,z) = V - \frac {k_{\parallel }}{\mu } \left (\frac {\partial p}{\partial z} + \rho g\right ), \quad \frac {\partial ^2 p}{\partial z^2} +\frac {k_{\perp }(z)}{k_{\parallel }}\frac {\partial ^2 p}{\partial y^2} =0, \end{equation}
where the equation for the pressure is obtained from mass conservation and
 $z=0$
corresponds to the position of the air–liquid interface of the bath. As for brushes, we consider that there is no flow along the transverse (horizontal) direction inside the fluid transported by the brush located above the level of the liquid bath. Therefore,
 \begin{equation} k_{\perp }(z) = k_{\perp } \theta (-z) = \frac {d^2}{3} \theta (-z), \qquad k_{\parallel }=\frac {d^2}{3}, \end{equation}
where
 $\theta$
is the Heaviside function. Using the change of variables
 \begin{equation} \bar {y} = 2y/W, \quad (\bar {z},\bar {h},\bar {L},\bar {h}_{J},\bar {t},\bar {p}) = (z,h,L,h_J,V t, p/\rho g)/L_0, \end{equation}
where
 $W$
is the width of the plates along the
 $y$
axis, the equation for the pressure becomes
 \begin{equation} \frac {\partial ^2 \bar {p}}{\partial \bar {z}^2}+ \delta ^2 \frac {k_{\perp }(\bar {z})}{k_{\parallel }} \frac {\partial ^2 \bar {p}}{\partial \bar {y}^2} =0, \quad \delta = \frac {2L_0}{W}, \end{equation}
where the aspect ratio
 $\delta$
is assumed to be small. Expanding the pressure up to order
 $\delta ^2$
,
 $\bar {p} = \bar {p}_0 + \delta ^2\, \bar {p}_1$
, (E10) becomes at orders
 $\delta ^0$
and
 $\delta ^2$
 \begin{equation} \frac {\partial ^2 \bar {p}_0}{\partial \bar {z}^2}=0, \quad \frac {\partial ^2 \bar {p}_1}{\partial \bar {z}^2}=-\frac {k_{\perp }(\bar {z})}{k_{\parallel }} \frac {\partial ^2 \bar {p}_0}{\partial \bar {y}^2}. \end{equation}
These equations are solved with the boundary conditions
 \begin{equation} \bar {p}_0(\bar {y},-\bar {L}) = \bar {L}, \quad \bar {p}_0(\bar {y},\bar {h}) = -\bar {h}_{J}, \quad \bar {p}_1(\bar {y},-\bar {L}) = 0, \quad \bar {p}_1(\bar {y},\bar {h}) = 0. \end{equation}
The solutions are
 \begin{align} \bar {p}_0(\bar {y},\bar {z}) &= (\mathcal{P}(\bar {y})-1)\, \bar {z} + \bar {L} \mathcal{P}(\bar {y}), \quad \mathcal{P} = \frac {\bar {h}(\bar {y})-\bar {h}_{J}}{\bar {h}(\bar {y})+\bar {L}}, \end{align}
 \begin{align} \bar {p}_1(\bar {y},\bar {z}) &= \frac {1}{6} \left [-\bar {z}^2\left (\bar {z} + 3 \bar {L}\right )\theta (-\bar {z}) + \frac {2\bar {L}^3(\bar {h}(\bar {y})-\bar {z})}{\bar {h}(\bar {y}) + \bar {L}}\right ] \frac {\partial ^2\mathcal{P}(\bar {y})}{\partial \bar {y}^2}. \end{align}
Using (E9), equation (E7) and for the interface become
 \begin{align} v_{y}(\bar {y},\bar {z}) &= -\delta \, \frac {k_{\perp }(\bar {z})}{k_{\parallel }} \, V_{\parallel } \frac {\partial \bar {p}}{\partial \bar {y}}, \quad v_z(\bar {y},\bar {z}) = V - V_{\parallel } \left (\frac {\partial \bar {p}}{\partial \bar {z}} + 1\right ), \quad V_{\parallel }=\frac {k_{\parallel } \rho g}{\mu }, \end{align}
 \begin{align} \frac {\partial \bar {h}(\bar {y},\bar {t})}{\partial \bar {t}} &= \frac {v_z(\bar {y},\bar {h})}{V}. \end{align}
Substituting (E14a ) into (E14b ), we get
 \begin{equation} \frac {\partial \bar {h}}{\partial \bar {t}} = 1 - \frac {1}{\overline {V}} \left (\frac {\partial \bar {p}}{\partial \bar {z}} + 1\right )_{\bar {z} = \bar {h}} = 1 - \frac {1}{\overline {V}} \left (\frac {\partial \bar {p_0}}{\partial \bar {z}} + \delta ^2 \frac {\partial \bar {p_1}}{\partial \bar {z}} + 1\right )_{\bar {z} = \bar {h}}, \quad \overline {V} = \frac {V}{V_{\parallel }}, \end{equation}
where we used the expansion
 $\bar {p} = \bar {p}_0 + \delta ^2\, \bar {p}_1$
. Using (E13), we have
 \begin{equation} \left . \frac {\partial \bar {p}_0}{\partial \bar {z}}\right |_{\bar {z} = \bar {h}} = \mathcal{P}-1, \quad \left . \frac {\partial \bar {p}_1}{\partial \bar {z}}\right |_{\bar {z} = \bar {h}} = - \frac {1}{3}\frac {\bar {L}^3}{\bar {L}+ \bar {h}(\bar {y})} \, \frac {\partial ^2\mathcal{P}(\bar {y})}{\partial \bar {y}^2}, \end{equation}
so that (E15) becomes
 \begin{equation} \frac {\partial \bar {h}}{\partial \bar {t}} = 1 - \frac {\mathcal{P}}{\overline {V}}+ \frac {\delta ^2}{3\overline {V}} \frac {\bar {L}^3}{\bar {L}+ \bar {h}(\bar {y})} \frac {\partial ^2\mathcal{P}(\bar {y})}{\partial \bar {y}^2}. \end{equation}
It is convenient to measure the position of the air–liquid interface with respect to its static initial position. Therefore, we have
 \begin{align} H(\bar {y},\bar {t}) &= \bar {h}(\bar {y},\bar {t}) - \bar {h}_J, \quad \mathcal{P} = \frac {H}{H + \bar {h}_J +\bar {L}}, \end{align}
 \begin{align} \frac {\partial ^2\mathcal{P}(\bar {y})}{\partial \bar {y}^2} &=\frac {(\bar {h}_J +\bar {L})}{(H + \bar {h}_J +\bar {L})^2} \left [\frac {\partial ^2 H}{\partial \bar {y}^2} - \frac {2}{H+ \bar {h}_J +\bar {L}} \left [\frac {\partial H}{\partial \bar {y}}\right ]^2 \right ] .\end{align}
Substituting (E18) in (E17), we finally get
 \begin{equation} \frac {\partial H}{\partial \bar {t}} = 1 - \frac {1}{\overline {V}} \left [\frac {H}{H+ \bar {h}_J +\bar {L}} \right ]+ \frac {\delta ^2}{3\overline {V}}\frac {\bar {L}^3 (\bar {h}_J+\bar {L})}{(H + \bar {h}_J+ \bar {L})^3} \left [\frac {\partial ^2 H}{\partial \bar {y}^2} - \frac {2 (\partial _{\bar {y}} H)^2}{H+ \bar {h}_J +\bar {L}} \right ]. \end{equation}
As for brushes, the last term of (E19) is very small and can be neglected to obtain (6.1a ).



