INTRODUCTION
Yam (Dioscorea species; family, Dioscoreaceae) consists of over 600 species of which D. rotundata Poir (guinea yam, white yam), D. alata L. (water yam), D. cayenensis Lam. (yellow yam), D dumetorum Kunth (bitter yam) and D. esculenta Lour (lesser yam) are edible and cultivated on the largest scale. Yams are perennial species that produce underground ‘stem’ tubers that have meristematic tissue in loci (eyes) close to the tuber surface and under the right conditions these can sprout. It is the yam tuber that is consumed following processing and cooking. This paper focusses on D. rotundata (white yam) and henceforth will be referred to as ‘yam’. The yam tuber is rich in carbohydrate (75 to 85% of dry weight) and provides an excellent source of the B-complex group of vitamins, vitamin-A, beta carotene and some minerals (Muzac-Tucker et al., Reference Muzac-Tucker, Asemota and Ahmad1993) and the protein content varies between 2 and 5% on a dry weight basis (Alamu et al., Reference Alamu, Maziya-Dixon, Okonkwo and Asiedu2014). As a result, it is thought that yam tubers provide excellent nutritional sustenance (Muzac-Tucker et al., Reference Muzac-Tucker, Asemota and Ahmad1993) and can be sold as a cash crop given its relatively high market price. These nutritional and market value attributes mean that yam can be an important crop for food security in West Africa (Mignouna et al., Reference Mignouna, Akinola, Suleman, Nweke and Abdoulaye2014; Verter and Becvarova, Reference Verter and Becvarova2014). The crop also has cultural importance in a number of societies (Hahn et al. Reference Hahn, Osiru, Akorada and Otoo1987). In Igbo culture (an ethnic group in the South East of Nigeria), for example, yam is perceived as a ‘man's crop’ as growing it is a symbol of strength which commands respect in society (Okeke et al., Reference Okeke, Eneobong, Uzuegbunam, Ozioko and Kuhnlein2008).
The West African part of the yam belt accounts for some 95% of the global production of white yam (48 million tonnes), and Nigeria produces three quarters of the yams in West Africa (Shehu et al., Reference Shehu, Iyortyer, Mshelia and Jongur2010). D. rotundata is indigenous to West Africa and is especially widely grown in that part of the world, predominantly five countries; Benin, Côte d'Ivoire, Ghana, Nigeria and Togo (Asiedu and Sartie, Reference Asiedu and Sartie2010; Mignouna et al., Reference Mignouna, Akinola, Suleman, Nweke and Abdoulaye2014). A number of closely related species to D. rotundata can be found growing wild in Nigeria and to some extent domestication is still taking place (Scarcelli et al., Reference Scarcelli, Tostain, Mariac, Agbangle, Da, Berthaud and Pham2006; Vernier et al., Reference Vernier, Orkwor and Dossou2003). There are many cultivated varieties of white yam and this provides farmers with flexibility (Baco et al., Reference Baco, Biaou, Pham and Lescure2008) although there is evidence that diversity is declining as farmers opt for varieties that best suit their local growing conditions and markets (Zannou et al., Reference Zannou, Ahanchede, Struik, Richards, Zoundjihekpon, Tossou and Vodouhe2004).
Yams can primarily be propagated in the field and nursery via two main methods: (1) use of yam vine cuttings; and (2) planting material derived from tubers – small whole tubers referred to as ‘seed’ yams so as to distinguish them from ‘ware’ yams (the tubers that are consumed) and cut pieces of a yam tuber referred to as setts. The use of vine cuttings has potential but has not yet been employed on a large scale (Asante et al., Reference Asante, Otoo, Wiredu, Acheampong, Osei-Adu and Nsiah-Frimpong2011) and in practice, most farmers employ the use of tuber-derived material – either seed yams or setts – and it has been well established that multiplication ratios for yam are relatively low, ranging from 1:4 to 1:8 (Alvarez and Hahn, Reference Alvarez, Hahn, Terry, Doku, Arene and Mahungu1984), and shoot emergence tends to be uneven so that a field of planted seed yams or setts will have plants at various stages of growth (Otoo et al., Reference Otoo, Osiru, Ng and Hahn1987). Planting poor quality planting material can be assumed to impact on subsequent ware crop yield and tuber quality, and a recent paper suggests that under farmer-managed conditions, the use of good quality seed yams can make a significant difference to ware yam yield (Morse and McNamara, Reference Morse and McNamara2016) and unsurprisingly good quality seed yams sell for a premium price in markets (McNamara et al., Reference McNamara, Morse, Ugbe, Coyne and Claudius-Cole2012).
Researchers have sought to develop new ways of increasing the availability of good quality planting material, and these have often revolved around the use of small setts (minisetts) to generate seed yams. Ideally, a farmer would need to produce seed yams approximately 0.25 to 1 kg in size (so called ‘Grade I’ seed yams; Ogbonna et al., Reference Ogbonna, Anyaegbunam and Asumugha2011a; Reference Ogbonna, Korieocha, Onyenobi and Njoku2011b) but the sett size needed to produce this will vary depending upon factors such as variety and the environment (soil, rainfall, management practice, etc.). The sett also needs to be treated with pesticide to ensure that the cut surfaces are not vulnerable to pest and disease attack (Morse and McNamara, Reference Morse and McNamara2015). One approach for generating seed yams is called the Adaptive Yam Minisett Technique (AYMT) and employs sett sizes of between 70 to 100g and a pesticide ‘dip’ (Morse and McNamara, Reference Morse and McNamara2015; Morse et al., Reference Morse, McNamara and Acholo2009). Whilst the economics of the AYMT have been explored along with the impact of factors such as pesticide treatment and yam variety (Morse and McNamara, Reference Morse and McNamara2015), there are other potentially important factors that have received no attention to date. One of them is the time of sett planting whilst the other relates to potential differences between seed yam plots owned by men and those owned by women. Yam is typically regarded as a ‘male’ crop in much of West Africa and men do the site preparation, ridging, planting, staking and harvesting, whilst women are typically involved in weeding, transportation and marketing. Women tend to hire men to work on their yam plots, but does this have an influence on output? Most of the information about such a difference between gender ownership of yam plots is anecdotal and based on discussions with farmers and there are few published studies. Omojola (Reference Omojola2014) did find a statistically significant difference in the yields of male and female wetland farmers growing ware yam in the South West of Nigeria, with male yam farmers having greater yields than female farmers, but other studies have suggested no significant difference and there are few studies that have looked specifically at the impact on seed yam (Okeke et al., Reference Okeke, Okeke and Udeora2013; Okelola et al., Reference Okelola, Ariyo, Ume, Anozie and Olowoyo2014).
The research reported in this paper describes the results of ‘farmer-managed’ plots of AYMT established in Nigeria between 2013 and 2015. The primary purpose of these plots was to introduce farmers to the AYMT rather than undertake formal experiments. The intention was to allow them to experience AYMT first-hand, but the dates of management activities, yields and tuber numbers were recorded and fortuitously the farmers experimented with a range of planting dates over the 3 years to see how late they could plant. Also, as a number of the plots were owned by women, it was possible to look for differences between male and female owned plots. Hence, the focus of the paper will be on exploring the influence of planting date and gender of the plot owner on output variables from seed yams plots established with AYMT.
MATERIALS AND METHODS
Research sites, treatments and design
AYMT demonstration sites were established between 2013 and 2015, with each site having two plots: one planted to untreated setts and one to setts treated with pesticide. The main location for the sites was the area surrounding the town of Idah (7°05′N; 6°45′E and population approximately 80 000), Kogi State, Nigeria, and 30 sites were established each year over that period. AYMT demonstrations were also established in 2015 in the area of Amoke town in Benue State, Nigeria (7°20′N; 8°45′E). Both Idah and Amoke are located in the middle belt of Nigeria (Supplementary Figure S1, available online at http://dx.doi.org/10.1017/S0014479716000648) and close to two main rivers (Niger and Benue), although Idah sits on the eastern bank of the Niger whilst Amoke is some miles inland. The soil in the Idah area is predominantly of the Fluvisol type (FL) whilst the area around Amoke is dominated by Alisols (AL) and Acrisols (AC).
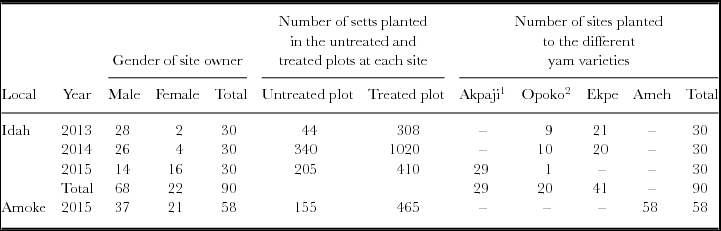
The number of sites included in this study for both the Idah and Amoke areas are set out in Table 1, along with the gender of the named ‘owner’ of the plot, the number of setts planted in the untreated and treated plots and the varieties planted. The ‘owner’ of the site is defined as the person who ultimately has prime responsibility for its management and it is this person who receives the produce. Hence, a woman may not own the land on which the plot is established, but she will be in charge of the management of the plot even if she does not become involved in any of the activities. Male owners do much of the work on their sites and visit it on a regular basis whilst the female owners, especially in the Idah area, typically hire men to do the bulk of the work for them.
Site characteristics for the AYMT demonstration programme between 2013 and 2015.

1 This variety is also known as Ugah and Alumaco.
2 This variety is also known as Oboko.
All of the mother tubers used to generate the setts had already broken dormancy. Choice of yam variety was left for the farmer but given that the planting material was purchased for them it was necessary to have a degree of consensus where possible so that material could be sourced. In the Idah area, during 2013 and 2014, some farmers wished to grow a variety called Ekpe whilst others preferred to grow Opoko (or Oboko). In 2015, the consensus shifted almost completely towards Akpaji (also called Ugah and Alumaco). In Amoke, the consensus was entirely focussed on Ameh in 2015, a variety not popular in the Idah area although it is known to exist there.
The number of setts planted at each site was specified by the researchers and kept constant across all sites that year. Farmers were also encouraged to adopt the same spacing, typically between two and three setts planted per square metre (spacing of 35 to 50 cm between stands planted on metre ridges), and to use the same spacing for untreated and treated setts. Other than these requirements the management of each plot was left entirely for the farmer. Most of the sites were staked but the form of the staking (material used, height, spacing, trellising) was left for the farmer to decide. Plots were typically weeded twice, although some farmers used herbicide (pre- and post-emergent) as a supplement to help keep the weed pressure down.
Each site had two plots: one smaller plot planted to untreated setts and one larger plot planted to treated setts. It should be noted that these were primarily intended as demonstrations rather than formal trials and that is the reason why the untreated areas were smaller than the treated areas. Treatment was via a ‘pesticide dip’ method described in Morse and McNamara (Reference Morse and McNamara2015). The pesticides employed were Act Force Gold (insecticide; 45% w/w chlorpyrifos) and Z Force (fungicide; 80% w/w/ mancozeb). For every 10 litres of water, a total of 100 ml of Act Force Gold (the insecticide; contains 45% of chlorpyrifos) and 100 g of Z-Force (the fungicide; contains 80% of mancozeb) were added. Setts were cut to the recommended size (80 to 100 g) and dipped into the pesticide solution before drying in the shade and planting. Planting and harvesting dates were chosen by the farmers and the months of planting are shown in Supplementary Table S1 (available online at http://dx.doi.org/10.1017/S0014479716000648) and it is interesting to note how planting become later between 2013 and 2015 in Idah.
Data collection and analysis
The agronomic variables recorded for the untreated and treated plots at each site were as follows: (i) Sprouting rate (%): typically recorded around two months after planting; (ii) Average tuber weight (kg): total weight of all tubers harvested divided by the number of tubers harvested; (iii) Average weight of tubers per sett planted (kg): total weight of all tubers harvested divided by the number of setts planted; (iv) Average number of tubers per sett planted: total number of tubers harvested divided by the number of setts planted; (v) Average weight of tubers per sett sprouted (kg): total weight of all the tubers harvested divided by the number of setts that had sprouted (typically around 2 months after planting) and (vi) Average number of tubers per sett sprouted: total number of tubers harvested divided by the numbers of setts sprouted.
Dates of planting were recorded for each site and these were transformed into days with the 1st January each year being day 1. Analysis of the results was via multiple linear regression with dummy variables for treatment, variety and gender. Data from the Idah and Amoke areas were analysed separately, largely to avoid the confounding of location with variety. Only one yam variety was planted in the plots at Amoke, and whilst this variety is known to be present in the Idah area, it was not one of their preferred varieties. Given that Idah and Amoke are different in a number of regards, it was decided to analyse the data separately. The models for the two areas are as follows:
-
1. Idah area
Variable = α + β1.yam variety + β2.sett treatment + β3.gender + β4.day of planting + β5. (sett treatment × day of planting) + Error
-
2. Amoke area
Variable = a + β1.sett treatment + β2.gender + β3.day of planting + β4. (sett treatment × day of planting) + Error
A dummy variable was employed for gender (1 = male and 2 = female), treatment (1 = untreated and 2 = treated) and variety (1 =Apaji, 2 = Opoko and 3 = Ekpe).
RESULTS
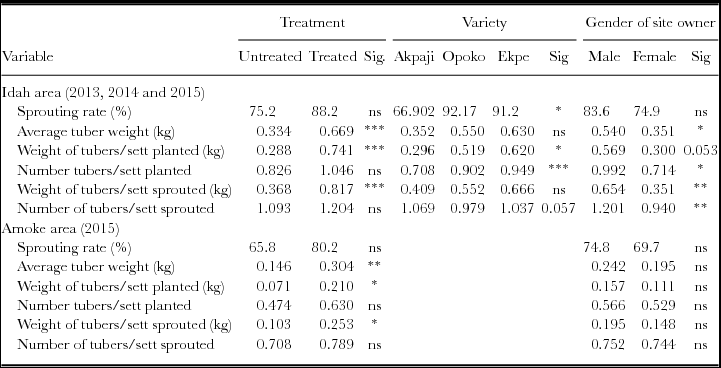
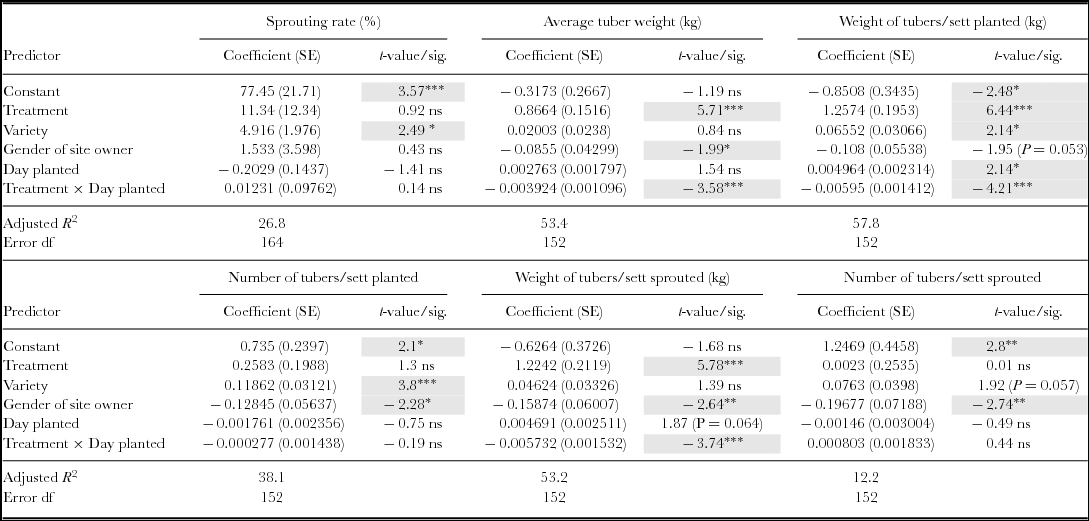
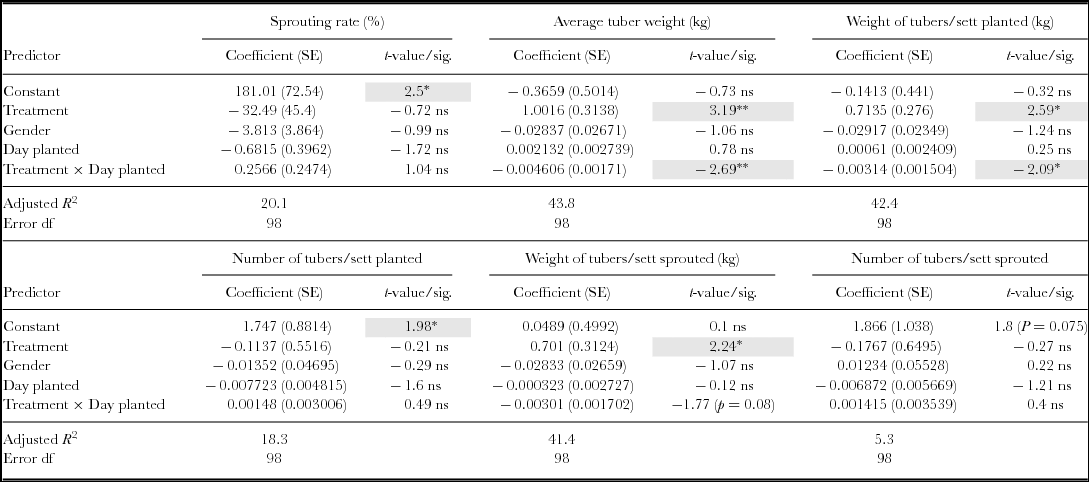
Table 2 presents the means of the variables across treatments (untreated and treated), varieties (three in the case of the Idah area) and gender. The results of the multiple linear regressions are shown in Table 3 for the Idah area and Table 4 for the Amoke area.
Table of means for the variables employed in the AYMT demonstrations (2013, 2014 and 2015).

ns = not significant (P > 0.05); *P < 0.05; **P < 0.01; ***P < 0.001.
Results of multiple linear regression tests conducted on the variables from the AYMT demonstration plots in the Idah area.

ns = not significant (P > 0.05); *P < 0.05; **P < 0.01; ***p < 0.001. Shaded cells are those that are statistically significant.
Results of multiple linear regression tests conducted on the variables from the AYMT demonstration plots in the Amoke area.

ns = not significant (P > 0.05); *P < 0.05; **P < 0.01; ***P < 0.001. Shaded cells are those that are statistically significant.
The results for Idah and Amoke in Table 2 suggest that the sett treatment does increase the weight of tuber obtained per sett planted and germinated relative to the untreated control, although it has no apparent effect on the number of tubers harvested per sett planted or sprouted. In Idah, it was found that varieties do differ in terms of their sett sprouting rate and weight of tubers per sett planted and germinated although care does need to be taken with interpretation given that Ekpe and Opoko were planted in 2013 and 2014 and Akpaji in 2015. Akpaji appears to have lower average tuber weight, weight of tubers/sett planted and number tubers/sett planted relative to the other two varieties. These findings regarding the impact of pesticide treatment and variety were expected and indeed were highlighted in the results of previous work utilising AYMT demonstration plot data from 2013 and 2014 (Morse and McNamara, Reference Morse and McNamara2015; Reference Morse and McNamara2016).
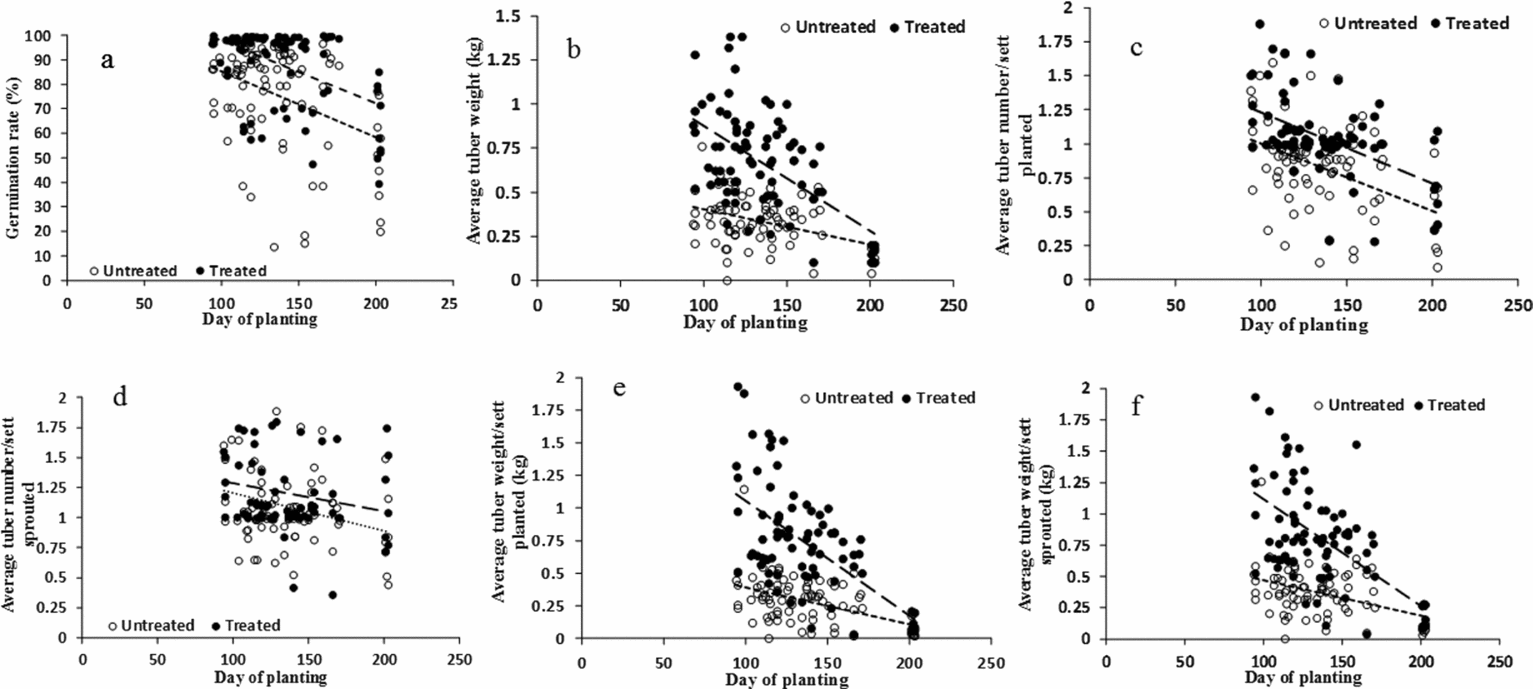
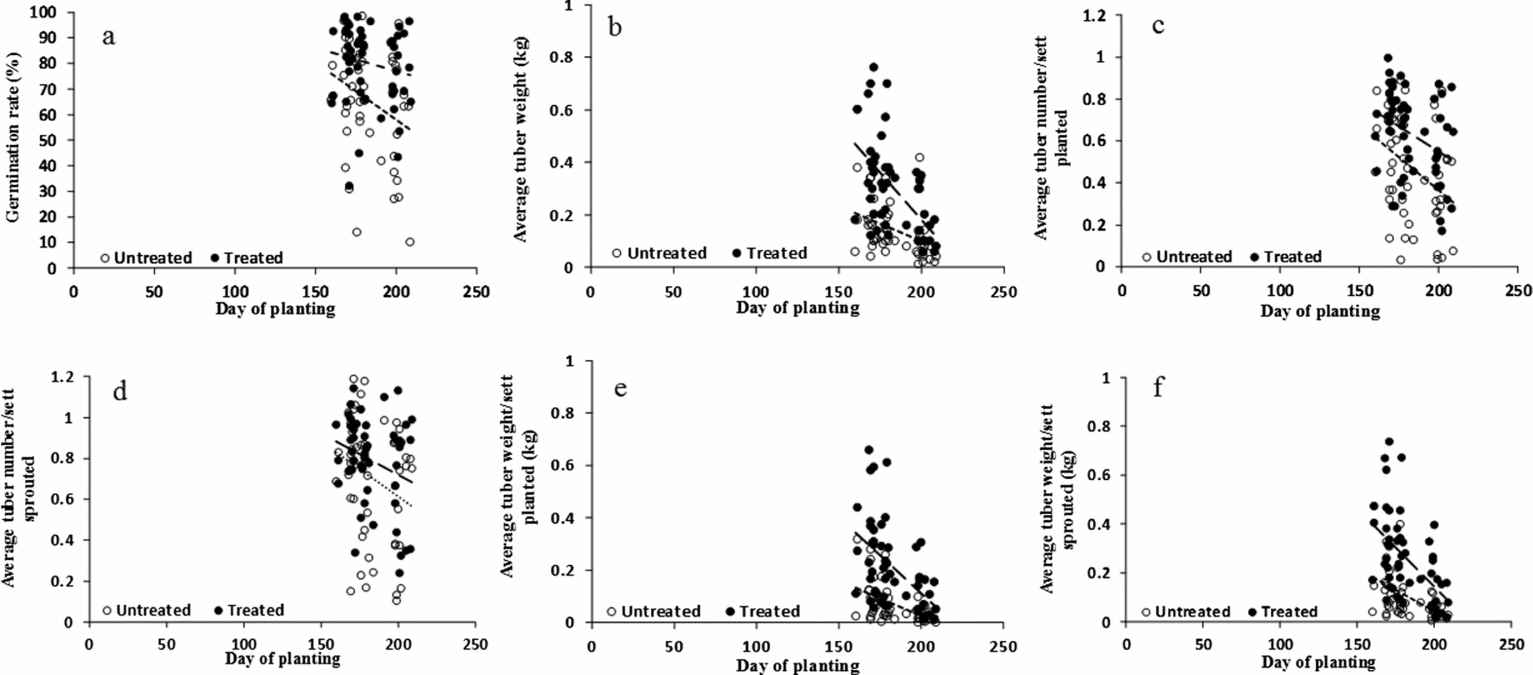
A new insight from Table 3 for Idah and to a lesser extent Table 4 for Amoke rests with the effect of planting date. The regression analyses suggest that the tuber weight variables (per sett planted and per sett sprouted) declined with later planting, and the rate of decline was different for untreated and treated setts, hence, the interaction term ‘treatment × day of planting’ was often statistically significant. Plots of the variables against planting day are presented in Figure 1 for Idah and Figure 2 for Amoke. The lines in the graphs are least squares ‘best fits’ to provide the reader with a visual sense of trend over time. Treated setts planted earlier did best of all in terms of the weight variables but these declined rapidly with later planting. Untreated setts did not do as well as the treated setts, and the weight variables also declined with later planting. The results suggest that the positive gains from using pesticide treatment were rapidly eroded with later planting. The results also suggest that planting time did not have an impact on the number of tubers of stand.
Plots of agronomic variables against planting day for the Idah area: (a) Sprouting rate (%); (b) Average tuber weight (kg); (c) Average weight of tubers per sett planted (kg); (d) Average number of tubers per sett planted; (e) Average weight of tubers per sett sprouted (kg); (f) Average number of tubers per sett sprouted.

Plots of agronomic variables against planting day for the Amoke area: (a) Sprouting rate (%); (b) Average tuber weight (kg); (c) Average weight of tubers per sett planted (kg); (d) Average number of tubers per sett planted; (e) Average weight of tubers per sett sprouted (kg); (f) Average number of tubers per sett sprouted.

The final sets of results to be highlighted are those related to the gender of the farmer owning the plot. Means of the output variables are shown to the right hand side of Table 2 and the gender term is presented in the regression analyses of Tables 3 and 4. A number of statistically significant effects were observed for the Idah plots, suggesting that female owners tended to have lower results in terms of a number of the agronomic variables (average tuber weight, number tubers/sett planted and weight of tubers/sett sprouted) than did their male counterparts. The variable ‘weight of tubers/sett planted’ was almost statistically significant (P = 0.053). Whilst the gender differences were not statistically significant from the Amoke data, the variables were also higher for the male owners compared to the female owners.
DISCUSSION
The positive impact on tuber weight of treating yam setts before planting is clear from the research presented here and indeed has been noted in previous publications (Morse and McNamara, Reference Morse and McNamara2015; Reference Morse and McNamara2016; Morse et al., Reference Morse, McNamara and Acholo2009). The results also confirm a point made before regarding the effect of pesticide treatment on tuber weight rather than tuber number (Morse and McNamara, Reference Morse and McNamara2015). This is an important distinction as ideally the farmer would wish to produce seed yams of around 0.4 to 0.5 kg in weight and to have more of them per stand. Each sett produces approximately one tuber and sett treatment tends to increase the size of that tuber rather than a division of the biomass across a number of tubers. The result can be some tubers that are of 1 kg or so in size, far too large for planting as seed yams. Conversations with the farmers over the 3 years of this programme suggests that some of the produce of the AYMT plots is consumed by the households, although interestingly none of the tubers have been sold. Nonetheless, whilst these findings are not new, these results provide confirmation spanning 3 years and over two separate places in Nigeria (Idah and Amoke). The mechanism behind this effect is probably a combination of (i) a reduction in the pest and disease presence within the sett as a result of penetration of the liquid forms of the pesticides into the flesh and (ii) a degree of protection against invasion of pests and diseases once the sett has been planted.
The result is less pest and disease damage for treated setts compared to untreated ones and thus a better start in terms of tuber development. Given the nature of the two pesticides (chlorpyrifos and mancozeb) used in these demonstrations, it is unlikely that they are translocated to the developing tuber and thus provide it with much protection, but this cannot be ruled out and more research would certainly help answer this question (Morse and McNamara, Reference Morse and McNamara2016).
The varietal difference in terms of performance within AYMT has also been noted by others such as Morse and McNamara (Reference Morse and McNamara2015). However, care does need to be taken given that in years 2013 and 2014, the farmers in the Idah area planted Ekpe and Opoko whilst in 2015, almost all of the farmers planted Akpaji.
Although the effects of sett treatment with pesticide and yam variety are well established in the literature, this paper presents the first results to show the impact of planting dates on seed yam production (primarily tuber weight) via the AYMT. Planting date clearly impacts upon tuber weight, with a significant decline from April through to July. It could be argued that this is expected given that yam is a crop that grows relatively slowly and the rainy season tends to end around October. Also, the physiological state of mother tubers from which setts are prepared grows poorer as planting is delayed. Even so, it has generally been assumed that planting of the AYMT setts could take place as late as July and still produce a reasonable seed yam crop. However, these results show how later planting does reduce the time that tubers have to produce bulk. The decline in tuber weight is especially marked for the treated setts relative to untreated, suggesting that the benefits of sett treatment decline rapidly with later planting. Indeed, it is interesting how planting date has gradually increased in the Idah area since the first demonstrations of 2013, and one reason for this, according to the farmers, is the need for them to complete planting of the ware yam crop before they can move onto the seed yam. It needs to be remembered that ware yam is the main crop both for providing food for the household and ensuring income; hence, it is not surprising that the farmers wish to prioritise it over the seed crop. After all the seed yams are a means to an end. Nonetheless, these results clearly indicate that farmers should avoid postponing the planting of the seed yam crop till June and July, and should look to establish the crop in April or May at the latest, although it has to be noted that even late planting in July still generated some crop and it will be interesting to see whether such ‘late season’ seed yam continues to be adopted by farmers.
The findings on the impact of the gender of plot owner are perhaps the most interesting to emerge from these data. The results from the AYMT plots between 2013 and 2015 in Idah, and to a lesser extent those from Amoke, suggest that the female managed plots did not do as well as the male managed ones especially in terms of tuber weight but also in terms of tuber number. It has not been conclusively established whether this difference between men and women's involvement in yam production has an impact on crop performance, although Omojola (Reference Omojola2014) did pick up a statistically significant difference for wetland farmers growing ware yam in the South West of Nigeria, and only circumstantial evidence exists based on discussions with farmers. It has long been known that yam is a male crop and hence most yam farmers are male (Okeke et al., Reference Okeke, Eneobong, Uzuegbunam, Ozioko and Kuhnlein2008). Men make the key decisions in yam production and do most of the work in terms of site preparation, planting, staking and harvesting. Women often play a role in terms of weeding, transportation of tubers to and from storage and, especially, with marketing. It has also been known that women can ‘own’ yam plots although they usually hire men to do most of the work for them. So why would there be differences in outputs between the male and female owned plots? There are a number of possible explanations. First, of course, it may be argued that the men simply have more experience in yam production than do the women, although it has to be noted that the AYMT is a relatively new introduction in the areas. Even so it would be reasonable to assume that as the men had more experience with yam in general then this may have helped them with their seed yam plots. Second, it has been noted by some farmers that when women own yam plots they may not necessarily be as ‘hands on’ as their male counterparts, but this has largely been expressed in terms of ware yam rather than seed yam. It may also be that female owned plots were planted on land that was of lesser quality for yam compared to that used by the men. Finally, as women have to pay men to work on the yam crop, it may be that the plots received less attention compared to male owned plots where the owners themselves do much of the work and are perhaps more diligent as a result. The authors have no evidence to support any of these explanations and can only speculate. Hence, there is clearly much scope for further research.
AYMT does provide the basis for the production of good quality seed yams and other research has shown that planting seed yams produced from treated setts does generate more ware yam than the use of seeds produced from untreated setts. Compared to the use of other techniques such as vine cuttings, AYMT builds upon methods that farmers already employ and with which they are familiar. Whilst it has been shown to work in terms of producing seed yams of good quality, there is still much research to be done. Of particular interest will be the search for a variety that produces more tubers per sett rather than a single large tuber. For example, late-maturing yam varieties known under the common name ‘Kokoro’ in Togo, Benin and western Nigeria produce 3 to 12 tubers per plant and could be ideal for AYMT (Dansi et al., Reference Dansi, Mignouna, Zoundjihekpon, Sangare, Asiedu and Quin1998). But as always with yam, the need for more tubers is traded against others seen to be important by farmers such as taste, durability and storability. The latter characteristics are important drivers in varietal choice and this becomes reflected in market price. Indeed, over the years of the research in Idah, there has been an interesting shift away from varieties such as Opoko and Ekpe in 2013 and 2014 and towards Akpaji in 2015. According to the farmers, this change is due to a greater demand now for Akpaji which is regarded as having better taste than the other varieties as well as is also claimed better resistance to drought. The yam system in Nigeria is clearly very dynamic and complex, and the crop is certainly worthy of far more research effort than it has received to date.
CONCLUSION
The results presented here lead to a number of conclusions: (i) AYMT provides the basis for the production of good quality seed yam in Nigeria; (ii) treatment of the setts with an insecticide and fungicide dip prior to planting makes a significant difference to the weight of the tubers that are produced; (iii) there are varietal differences in terms of agronomic performance under AYMT; (iv) date of planting has a significant impact on the agronomic performance of the AYMT. Farmers need to be encouraged to plant in April and May and dissuaded from planning after end of May and (v) there are cultural impacts on the performance of the AYMT, with female-owned plots not doing as well as male-owned ones. There are a number of possible explanations for this and from the authors are not able to identify any particular one or combination as being the most likely. It can be said that having female manged seed yam plots is a pioneering move and there is a need for major discussion and dialogue with the female owners. This is all the more critical as female seed and ware yam traders (entrepreneurs) are about to enter a phase of producing high quality seed yam.
Finally, the results point to a number of gaps in knowledge with regard to seed yam, and arguably the largest of these is the varietal response to AYMT and whether varieties exist which generate more tubers of small size than one large tuber. The gender difference is an interesting one and given that some women are clearly enthusiastic about producing seed yam it is important to consider the additional support that they may need.
Acknowledgements
The authors wish to acknowledge the help of Clement Agada and Gabriel Ameh in the Idah and Amoke areas, respectively. The authors would also like to thank Dr Lava Kumar, Dr Robert Asiedu, Dr Beatrice Aighewi and Dr Norbert Maroya, all of the International Institute of Tropical Agriculture. The authors gratefully acknowledged the financial support for this work by the Bill and Melinda Gates Foundation (BMGF) under the Yam Improvement for Income and Food Security in West Africa (YIIFSWA) grant awarded to the International Institute of Tropical Agriculture. The authors wish to express their gratitude to the peer reviewers for their excellent comments and advice for improvement of the paper.
Supplementary materials
For supplementary material for this article, please visit http://dx.doi.org/10.1017/S0014479716000648.