I. INTRODUCTION
Noise radar is a radar that uses a random or pseudo-random signal as a sounding waveform. Such a waveform, due to the unpredictability of the temporal realization of the noise signal, is much harder to detect and jam in comparison with the frequency-modulated continuous waveform (FMCW), commonly used in CW radars. The idea of the noise radar was introduced in the 1950s [Reference Horton1], but broad usage of noise radars was postponed due to technical difficulties at that time. With advancement in radiofrequency circuit design and the much greater computational power of modern computers, the noise radar is becoming a topic of interest in many research institutions [Reference Axelsson2–Reference Walton, Theron, Gunawan and Cai8].
Noise radars working in CW mode have separate transmit and receive channels. The detection is performed by comparing the sounding signal with the surveillance signal, usually via the complex correlation function given by:
 $${{\rm \cal R}}_{xy} [m] = \displaystyle{1 \over N}\sum\limits_{n = 0}^{N - 1} y[n]x^{\ast} \left[ {n - m} \right],$$
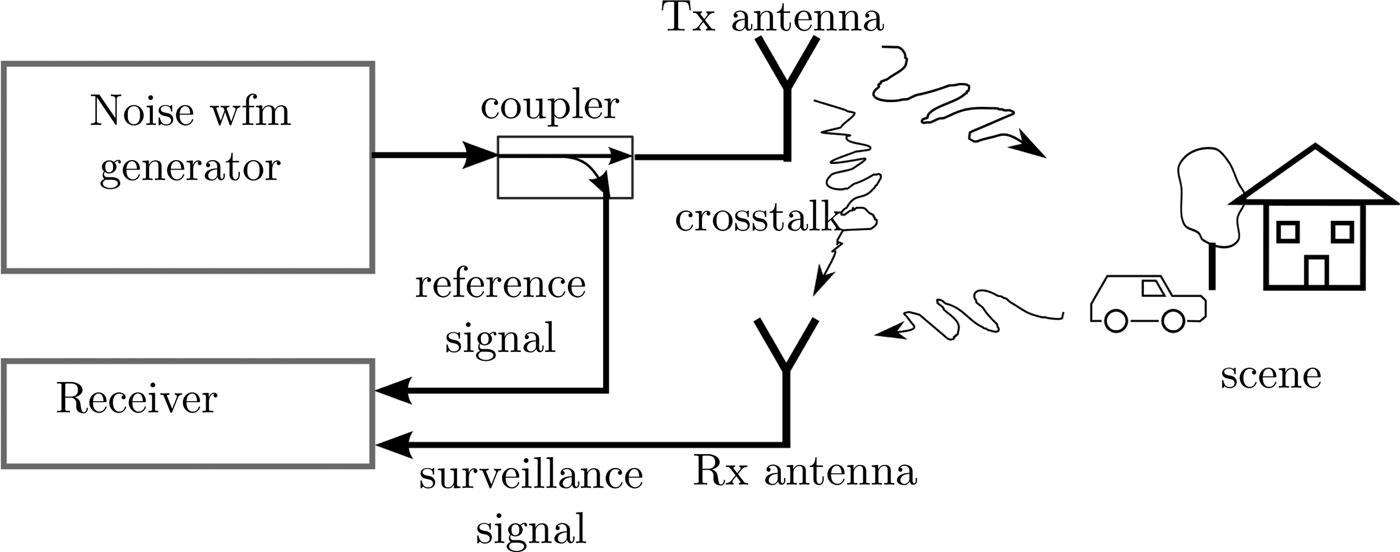
where N is the length of the block of the signal, y[n] is the surveillance signal, x[n] is the reference signal, and * is a complex conjugate operator. The complex values of the signal are obtained by down-converting the high-frequency signal and sampling it in the base band. Each block of the sounding signal is a unique realization of the noise process. The sounding signal therefore must also be acquired by the radar synchronously with the surveillance channel. This is done by splitting a fraction of the power of the sounding signal to the reference channel. The typical flow chart of a noise radar is presented in Fig. 1.
Typical noise radar signal flow chart.

The transmitter and receiver antennas are usually located in close proximity to each other. The direct crosstalk between antennas produces a strong stationary echo in the surveillance channel. The correlation function sielobes originating from this echo may be higher than the correlation peaks corresponding to different echoes present in the surveillance channel, thus weaker echoes will not be detected. Such an effect is often referred to as a masking effect. The sidelobes consist of two factors: a deterministic one related to the power spectral density (PSD) of the waveform, and a non-deterministic one related to the time-bandwidth (BT) product.
Having a signal with a rectangular PSD, the sinc-like sidelobes will appear for each echo, which affects the surrounding of the given echo's correlation peak. Applying various spectral windows on the PSD trades the range resolution for the shape and level of those sidelobes. Using a Gaussian window as proposed in [Reference Lukin9] allows the complete reduction of PSD-related sidelobes at the cost of a very wide main lobe. In this paper, author decided to use Hann spectral windowing as it gives a good sidelobe reduction while limiting the spread of the mainlobe.
Each realization of the signal has different non-deterministic sidelobes. The mean level of those sidelobes is the BT factor and those sidelobes spread in the entire range plane. Unless additional processing is performed, echoes with power BT lower than the crosstalk echo power cannot be detected at any range.
A common method to overcome the masking effect originating from non-deterministic sidelobes includes the modification of the sounding waveform in order to obtain a waveform with lower sidelobes than BT ratio [Reference Kulpa and Misiurewicz10–Reference Stoica, He and Li12], the usage of complementary waveforms [Reference Dang, Pezeshki, Howard and Moran13, Reference Golay14] or the application of certain post-processing techniques such as the CLEAN algorithm [Reference Kulpa15], the apodization filter [Reference Xu and Narayanan16], or Axelsson's mismatched filter [Reference Axelsson17]. The mismatched filter trades the peak sidelobe to the noise level for other advantages. In this paper, a mismatched filter that enhances the dynamic range of the system will be presented. Contrary to Axelsson's approach, the filter suppresses close range sidelobes and does not require information about the position of strong echoes present in the surveillance signal. The method presented in this paper is valid for a wide range of noise signals, including poly-phase uniform noise, Gaussian noise, or band-limited signals. A similar approach regarding binary signals was proposed in [Reference Rohling and Plagge18].
The paper is constructed as follows. In Section II, the filter design method is presented. Section III describes the simulation results. In Section IV, the measurement data are shown. Section V concludes the paper.
II. MISMATCHED FILTER DESIGN
The goal of the mismatched filter design algorithm is to create a filter where the correlation function of the radar reference signal and the mismatched filter impulse response is equal to 0 for certain time lags. In CW radars, the signal length is usually much greater than the time lag related to the maximum radar observation range. For the purpose of the dynamic range improvement, only the area within the radar observation range is relevant. The sidelobes beyond this region may remain unchanged.
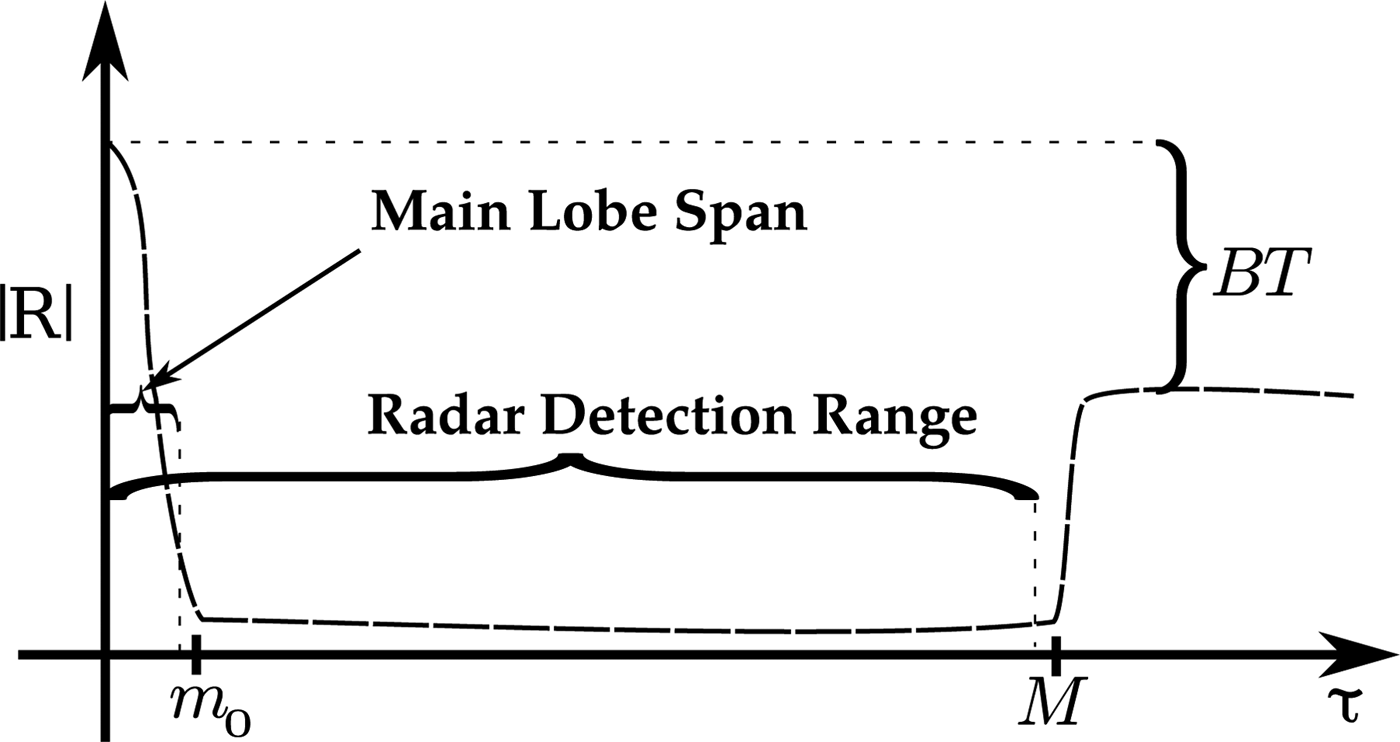
Let us assume a mismatched filter impulse response (z[n]) and a radar reference signal (x[n]). Moreover, let m 0 be the smallest integer larger than the mainlobe's span and M be the smallest integer larger than the radar's range, both expressed in the samples. Ideally, the correlation function of x[n] and z[n] should be equal to 0 for all integers between m 0 and M as presented in Fig. 2. Due to the correlation function symmetry:
 $${\hat {\cal R}}_{zx} [m] = {\hat {\cal R}}_{zx}^{\ast} [ - m]$$
the samples between −M and −m 0 should equal 0 as well. In order to design the desired mismatched filter, the following steps must be executed:
-
1. Calculate the autocorrelation function of the reference signal
 ${\hat {\cal R}}_{xx} $
.
-
2. Calculate the desired correlation function
${\hat {\cal R}}_{zx} $
as follows:
(3)where k = 0 for the linear correlation and k ∈ ℤ for the circular correlation.
$${\hat {\cal R}}_{zx} [n] = \left\{ {\matrix{ 0 \hfill & {{\rm for}\;n \in \langle m_0 + kN,M + kN\rangle,} \hfill \cr 0 \hfill & {{\rm for}\;n \in \langle \!-\! M + kN, - m_0 + kN\rangle,} \hfill \cr {{\hat {\cal R}}_{xx} [n]} \hfill & {{\rm otherwise,}} \hfill \cr}} \right.$$
-
3. Finally, calculate the filter impulse response from
(4)where X(l) is the signal x[n] spectrum and
$$z(n) = \displaystyle{1 \over N}\sum\limits_{l = 0}^{N - 1} \displaystyle{{\hat S_{zx} (l)} \over {X^{\ast} (l)}}e^{j2\pi {\rm ln}/N}, $$
$\hat S_{zx} (l)$
is the estimated cross-spectral density calculated from correlation function
${\hat {\cal R}}_{zx} $
.


Expected correlation function of recorded signal and mismatched filter impulse response.

One additional step may be added to improve the dynamic range at the cost of resolution. The mismatched filter impulse response may be modified by applying a spectral window. As already mentioned in Section I in this paper, in most cases the Hann window is used. The mismatched loss of applying the Hann window itself is ca. 6.5 dB. However, in order to separate the spectral windowing loss from the loss introduced by (4), in the following part of the paper the mismatched loss will be calculated between the windowed matched and windowed mismatched signals.
III. SIMULATIONS
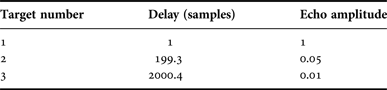
The mismatched filter range compression method was tested using data simulated in the MATLAB environment. In this experiment, a Gaussian pseudo-noise signal was generated for N = 215 samples, which corresponds to BT ≈ 45 dB. The range compression using both matched and mismatched filters was performed. The Hann spectral windowing was applied to the matched filter as well. The mismatched filter suppression area was chosen between m 0 = 3 and M = 3000. Three target environments were simulated, with each target having different range and echo power. The parameters of the targets are presented in Table 1. The delay was normalized to the non-windowed matched filter range resolution cell.
Simulation parameters.

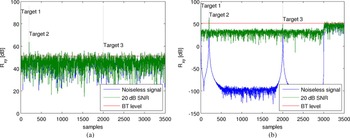
In order to illustrate the influence of external noise, two cases were investigated: first with no external noise, and second with additional white noise with the 20 dB signal-to-noise ratio (SNR) compared with the strongest echo's power. As shown in Fig. 3 in both cases the mismatched filter allows the detection of the weakest target, whereas in the matched filter approach the third target is entirely masked by the sidelobes originating from the first target echo. The straight line shows the time-bandwidth level, which is equal to the expected mean of the sidelobe level of a non-windowed Gaussian noise signal. The simulations also showed that the dynamic range improvement is limited by the SNR, and the mismatched filter approach does not improve the noise resistance of the system. Moreover, the mismatched filter loss calculated for the simulation data is negligible, below −0.05 dB.
Results of simulated data. (a) Matched filter. (b) Mismatched filter.

IV. MEASUREMENT ANALYSIS
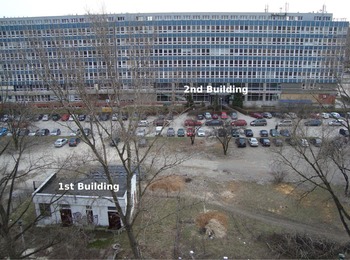
In order to verify the algorithm with real data, files containing unmodified noise signals from trials conducted in 2011 [Reference Maślikowski and Kulpa19] were processed. The measurement system consisted of the Agilent MXG N5182A arbitrary waveform generator, the Agilent VSA 89640 2-channel vector signal analyzer, a directional coupler and two patch antennas. The antennas were placed on a remotely controlled trolley on the balcony. An optical picture of the observed scene is presented in Fig. 4. The most prominent scatterers are a small warehouse to the left, about 30 m away, and the Civil Engineering Faculty building in the background, about 100 m away from the radar.
Observed scene setup.

The system operated in L-band with 46.08 MHz sampling frequency. The Gaussian noise with 36 MHz bandwidth was used as a sounding signal resulting in a 4.2 m range resolution cell. The electronically steered trolley moved along the balcony in stop-and-go mode. After every measurement, the antennas were moved by 3 cm. The total synthetic aperture length was equal to 10.5 m, which consisted of 350 steps along the balcony. The reference and surveillance signals were recorded synchronously and down-converted to 36 MHz resulting in 215 samples of a single block, which relates to BT ≈ 45 dB.
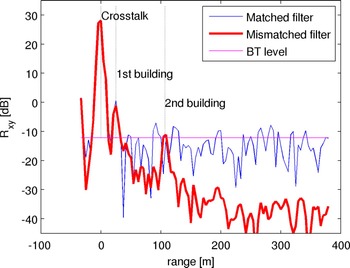
In order to obtain a synthetic aperture radar (SAR) image, first the range compression of the recorded signal is performed for each block. Both matched and mismatched filter approaches were used, with the mismatched filter parameters corresponding to those used in the simulation. The signal had a Hann spectral window applied before correlation. The results for a single-antenna location are presented in Fig. 5. The strongest echo in the figure is the antenna crosstalk. For the sake of convenience, the 0 m label was placed at the location of the crosstalk echo. The difference between the first correlation sample and the antenna crosstalk corresponds to the cable length. The first building is clearly visible in both approaches. However, the second building is only visible in the mismatched filter approach and the overall dynamic range improvement varies from 15 to 30 dB. The mismatched filter loss calculated for the main lobe of the antenna crosstalk is below 0.05 dB.
Range compression comparison.

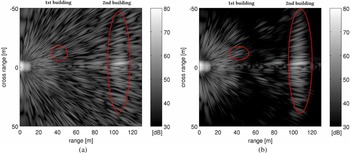
After obtaining a range compression vector for each antenna's position, the cell migration correction algorithm was calculated for each pixel of the output image, followed by azimuth matched filtration as described in [Reference Maślikowski, Contartese, Malanowski and Kulpa20]. The resulting images are presented in Fig. 6. The strong echo at zero range is the antenna crosstalk artifact followed by the ground reflections. In Fig. 6(a), the Civil Engineering building is barely visible. The mismatched filter approach suppressed the sidelobes significantly, which not only allows both buildings to be seen, but also the cars in the parking lot in front of the Civil Engineering building. About 15 dB of improvement on SAR image was obtained. The poor image resolution is caused by low signal bandwidth.
SAR image comparison. (a) Matched filter. (b) Mismatched filter.

V. CONCLUSION
In this paper, a novel mismatched filter approach for suppressing range sidelobes in noise radar is presented. The usability of the method is confirmed by both simulations and measurements. The algorithm may be easily applied to existing radars without the need to modify the radar transmitter. The measurement analysis showed 15 dB of dynamic range improvement in comparison with the matched filter approach. The main limiting factor of the algorithm is the SNR in relation to the strongest echo.
ACKNOWLEDGEMENTS
This work was partially supported by the Polish Ministry of Science and Higher Education through the science budget for 2012–2015 under the research program ‘Diamentowy Grant’, project no. 0009/DIA/2012/41.
 Janusz S. Kulpa received his B.Sc. and M.Sc. degrees in Electrical and Computer Engineering from the Warsaw University of Technology, Warsaw, Poland in 2011 and 2013, respectively. He is currently in the process of completing his Ph.D. and works as a research assistant at the Warsaw University of Technology. His research interests include Passive Radars, Noise Radars, and Compressive Sampling.