Economic historians have always regarded the expansion of markets and the resulting increase in the division of labor and specialization as powerful sources of growth, especially in pre-industrial Europe (Kelly Reference Kelly1997; Epstein Reference Epstein2000; Malanima Reference Malanima2009; Persson Reference Persson2010; Chilosi et al. 2013; for dissenting voices, see Clark Reference Clark2007; Bateman Reference Bateman2012; van Bavel 2016). Some have also argued that the development of better integrated markets in England and the Dutch Republic since the seventeenth century contributed crucially to the Little Divergence between these countries and the rest of Europe (Allen Reference Allen2001; Fouquet and Broadberry 2015). Market integration, thus, has been placed squarely at the center of the economic development of Europe. Whether it deserves this place is difficult to test. Historians have spent decades investigating qualitative sources, such as legal codes or contracts concluded between merchants (evidence that is difficult to quantify), to examine the development of trade and markets. Even when they used sources that contained quantitative data (e.g., merchant books of account), they rarely collected and analyzed them econometrically. We, therefore, know far less about the quantitative than the qualitative aspects of European commerce.Footnote 1
This is why economic historians have increasingly turned to price data. Wheat prices especially are among the best quantitative evidence available: they are abundant and, given the fairly homogenous nature of wheat, relatively easy to standardize. Spreads between prices in different locations persistently above the commodity points (i.e., the trade costs, possibly adjusted for arbitrage risk) would suggest that merchants left opportunities for arbitrage unexploited and, therefore, that trade would be less intensive than otherwise possible. Moreover, where prices on different markets moved in step, this was probably the result of merchants using the same information to make decisions about buying and selling commodities. Hence, analyzing price differentials systematically helps compensate for the lack of evidence on actual trade flows.
Historians broadly agree on nineteenth- and twentieth-century trends in trade identified in this way. By contrast, a consensus on when, how far, and how quickly markets integrated across Europe and over the very long term, let alone about why they did so, is still lacking. In particular, findings on the timing of pre-modern integration differ widely—unsurprisingly so, given that research has so far failed to agree on a number of central methodological points. There is neither a consistent and precise definition of integration nor agreement on what measures of integration to use (Fackler and Goodwin 2001, pp. 976–81). Moreover, the results of empirical work are hard to compare because scholars have focused on different product markets, regions, and time periods and used different econometric techniques (Federico Reference Federico2012a).
This paper builds on an extensive new wheat price data set that covers far more markets, a wider geographical area (most of Europe), and a longer period of time (from the Black Death to the First World War) than any previous analyses.Footnote 2 The focus of the paper is on measuring and documenting wheat market integration in Europe. We study two dimensions of integration: price convergence, a decrease in price differentials between markets, and improvements in market efficiency. “Semi-strong efficiency” is taken to refer to the extent to which prices reflect publicly available and relevant information. In an “efficient” market, there are no opportunities left for arbitrage. The market integration literature typically proceeds from the assumption that agents know prices and conditions in their own as well as other locations. If a shock causes price differentials within well-integrated markets to diverge from their equilibrium level, arbitrage would restore the equilibrium price gap. The faster this process, the more efficient is the market (Federico Reference Federico2012a, Reference Federico, Diebolt and Haupert2019). Price convergence and adjustment to shocks do not necessarily move in step. They require separate analyses with different statistical techniques and may give rise to different views of historical integration processes. We address two core questions: First, when and by how much did wheat prices converge? Second, to what extent, if any, did markets become more efficient over time?
In contrast to previous work in the field, we find that price convergence in Europe was a long-term process that began in the mid-fifteenth and continued (with accelerations and setbacks) to the mid-nineteenth century. We also find that convergence was associated with an improvement in market efficiency, approximated by co-movements in prices, from the early sixteenth century onward (likewise with temporary setbacks). The paper proceeds as follows. The next section reviews the recent literature on long-run market integration in Europe. We then set out the intuition of our approach and empirical strategy in the second section. The third section describes the extensive new data set, while the fourth section discusses the main results on price convergence and co-movement. The fifth section compares the timing of these two dimensions of integration and suggests some hypotheses to account for the similarities and differences observed. This section emphasizes the role of conflicts and better communications such as the development of postal networks and newspapers. The conclusion draws attention to the main implications of the new results.
LITERATURE SURVEY
The statistical analysis of market integration dates back to the 1950s (Achilles Reference Achilles1959), but research in this field has come into its own only since about the turn of the last century. While about half of the studies published between 2009 and 2012 concern the modern world (Federico Reference Federico2012a), it is striking that market integration is one of the few topics where quantitative methods have made major inroads into research on pre-modern economic history. This has been possible because of the extensive preservation of price data from the pre-statistical age. However, most of these studies focus on short periods, especially those on the eighteenth century, and on individual European countries such as France (Tilly Reference Tilly1971; Chevet and Saint Amour 1991; Roehner Reference Roehner1994; Chevet 1996, O’Grada and Chevet 2002). The few long-term, Europe-wide papers agree neither on the timing nor the pace of integration. The pioneering work by Achilles (Reference Achilles1959) identifies increasing integration all over Europe from 1550 to 1700, while Allen and Reference UngerUnger (1990) and Persson (Reference Persson1999) find an emerging integrated European wheat market in the eighteenth century. On the other hand, van Bochove (2007) and Özmucur and Pamuk (2007) rule out any such integration from the seventeenth to the beginning of the nineteenth century. Area studies, too, yield mixed results. For instance, Jacks (Reference Jacks2004) finds no clear trends in the Baltic before 1640, disintegration in 1640–1670, and re-integration in the eighteenth century. The most recent studies do not settle the issue. Chilosi et al. (2013) and Studer (Reference Studer2015) focus on the period from the seventeenth to the late nineteenth or early twentieth century. They observe a trend toward price convergence in the early modern period, especially from the late seventeenth to the mid-eighteenth century.Footnote 3 Their measure of efficiency (i.e., the co-movement of prices across markets), though, remains almost constant until the late eighteenth century. Drawing on a smaller number of markets, Reference BatemanBateman (2011, Reference Bateman2012) estimates 50-year averages of price gaps since 1400. Reference BatemanBateman’s averages remained large until 1500 and thereafter moved erratically: they declined in 1500–1549, increased in 1550–1600, declined again in 1600–1649, rebounded in 1650–1700, hit a trough in 1700–1749, and increased again in the second half of the eighteenth century. Contradicting most other studies (Jacks Reference Jacks2005; Federico and Persson 2007; Federico Reference Federico2011; Chilosi et al. 2013), Reference BatemanBateman argues that price gaps remained large in the first half of the nineteenth century and collapsed only between 1849 and 1900 (Bateman Reference Bateman2012). These conflicting results reflect the use of different data sets covering different markets and periods. Most works rely on small samples whose composition changes over time. For instance, Reference BatemanBateman (2011) quotes price series from 46 markets, but many of them have extensive gaps in observations.Footnote 4 Chilosi et al. (2013) find a substantial difference in dispersion of prices between a balanced sample of 13 markets and a wider unbalanced sample of about 60 markets in the nineteenth century. Though following by and large similar trends, the coefficient of variation of their balanced sample was consistently smaller than that of the unbalanced sample. Sample composition evidently matters.
EMPIRICAL STRATEGY
Mapping price convergence is fairly uncontroversial. A standard measure is the coefficient of variation, which gives the dispersion of prices across markets in a given year. It is easy to compute and comparable across time and space for the same product and allows comparisons of convergence patterns between different products. Moreover, it is reasonably robust to quality differentials for fairly homogenous products such as wheat. Ideally, prices should refer to the same quality, but biases from quality differentials and from their changes in time are not systematic and they may well cancel out each other (Federico Reference Federico2011).Footnote 5
Selecting a measure of efficiency is less straightforward. The basic idea is to examine to what extent and how quickly prices across localities re-adjusted after shocks such as crop failures, wars, or the conclusion of trade treaties. Efficiency is, thus, indicated by the extent to which prices on several markets move in line with each other. The reaction to price shocks can be estimated with different versions of autoregressive models for pairs of markets (Federico Reference Federico2012a, Reference Federico, Diebolt and Haupert2019). However, results are meaningful only if the frequency of the series (say, in months) is higher than the expected reaction time (Taylor Reference Taylor2001; Brunt and Cannon 2014) and if there is trade between markets. For most historical cases, the evidence on trade flows and time of adjustment is too scarce to assess either condition. It is, though, unlikely that prices took more than a year to adjust. Autoregressive models with annual data would, therefore, yield biased results. For this reason, we rather approximate market efficiency by its outcome, that is, by the degree of co-movement in prices. The more efficient a market, the less likely are permanent equilibrium price differentials between different locations. The previous literature focused on co-movements between pairs of markets (Federico Reference Federico2012a). Here, we consider co-movements between all price series drawing on dynamic factor analysis (DFA). In a nutshell, this is a dynamic version of principal component analysis. DFA allows extracting endogenously the common shocks affecting any number of price series and measures the degree of co-movement between this common component and local market-specific shocks (Kose, Otrok, and Whiteman 2003). In effect, the technique permits deriving a synthetic sample-wide “price” in relation to which we can assess the adjustment of local markets.
More formally, we decompose the residual from (Hodrick–Prescott) filtered series of prices  ${\rm{H}}{{\rm{P}}_{it}}{:^6}$
 $${\rm{H}}{{\rm{P}}_{it}} = {\lambda _i}{c_t} + {u_{it}},$$
where c t is the shock common to all price series at time t, λ i (“loading”) is a time-invariant feature of the ith market, and u it represents the time-varying and market-specific residuals. The expression λ i c t measures the contribution of common shocks to market-specific shocks in year t. Thus, the degree of co-movement between each market and the common component (or factor) over the entire period of estimation can be measured by the share in total variance:
 $${\tau _i} = \lambda _i^2 \times {\mathop{\rm var}} ({c_t})/{\mathop{\rm var}} ({\rm{H}}{{\rm{P}}_{it}}).$$
A sample-wide (synthetic) measure of efficiency T i can be obtained as an average of market-specific ratios τ i . We set the few cases of negative loading (λ i < 0) to zero. They correspond to a negative correlation with the common factor, but they yield a positive τ and, thus, including them would overstate the degree of co-movement.Footnote 6
DATA
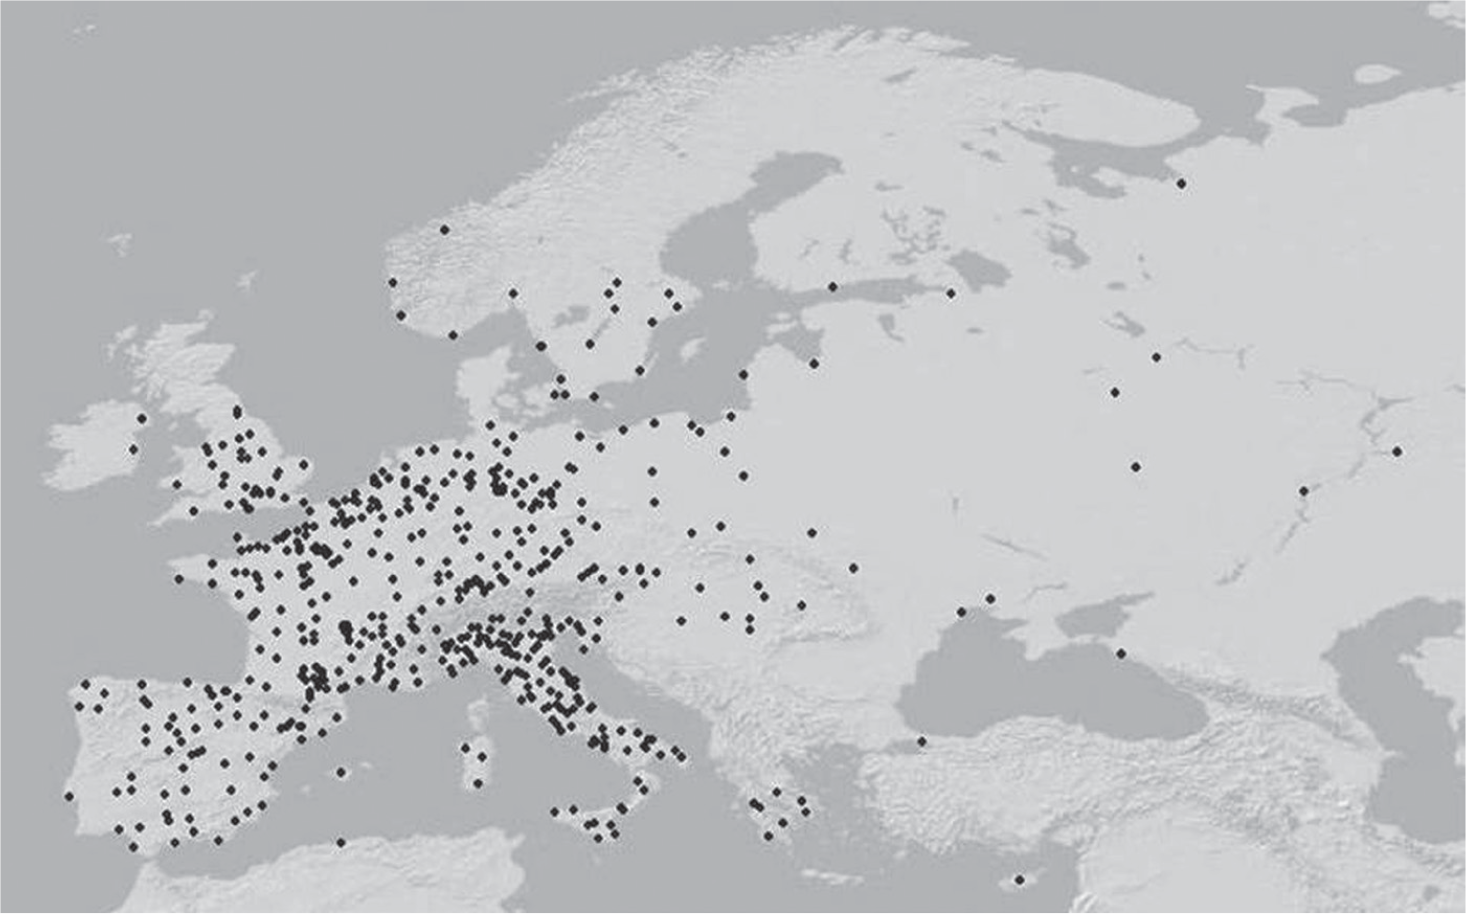
The new wheat price data set includes more than 68,000 price observations from more than 580 locations for 1348–1913, thus going far beyond what earlier studies were able to exploit (Federico, Schulze, and Volckart 2020). It covers almost the entire continent from Portugal to Russia, though most markets cluster in the territories of modern Belgium, France, Germany, Italy, and the Netherlands (Map 1).
TOTAL SAMPLE: ALL MARKETS
Sources: Authors’ own elaboration. Underlying map: Esri. “World Light Grey Base” [basemap]. Scale Not Given. January 31, 2015.

The data have been collected from a wide range of sources and we have benefited particularly from the late eighteenth-century interest in grain prices. Many journals and monographs appearing in the context of the Enlightenment did not only contain extensive discussions of grain price formation—Reference UngerUnger (1752) is a well-known example—but also published price series that in some cases stretch back for centuries (e.g., Anonymous 1765; Reference WüllenWüllen 1771; Brüggemann Reference Brüggemann1800). Much of this material has not been used by economic historians before.
Almost all historical sources report only one price of “wheat” for each location and the few other sources distinguish at best different provenances (e.g., “domestic” versus “Baltic” in Amsterdam).Footnote 7 Note that it was not before the late nineteenth century that standardized quality grading was introduced and prices began to refer to specific grain grades (Velkar Reference Velkar2010, pp. 23–24). Differences in quality across markets and changes over time can potentially affect our measure of price dispersion. However, as set out above, any resulting biases are undetermined over the long run, are not necessarily systematic, and can cancel out (see the Empirical Strategy section).
All prices are converted to grams of silver per hectoliter.Footnote 8 For the period before the establishment of the international gold standard in the 1870s, conversions are based on the pure silver content of the coinage used locally. We use the content of the largest denomination, as people typically did not use small change to buy grain. Changes in the pure silver content of currencies through debasements and (rarer) reinforcement were fully taken into account. For the post-1870 gold standard period, using the pure silver content of the coinage would not have made much sense. Here, we draw on exchange rates between the local currency and the Pound sterling in combination with London silver prices. All prices have been aggregated at the level of calendar years if they were originally recorded in a frequency or applied to harvest years; they are, thus, comparable in the cross section and over time.Footnote 9
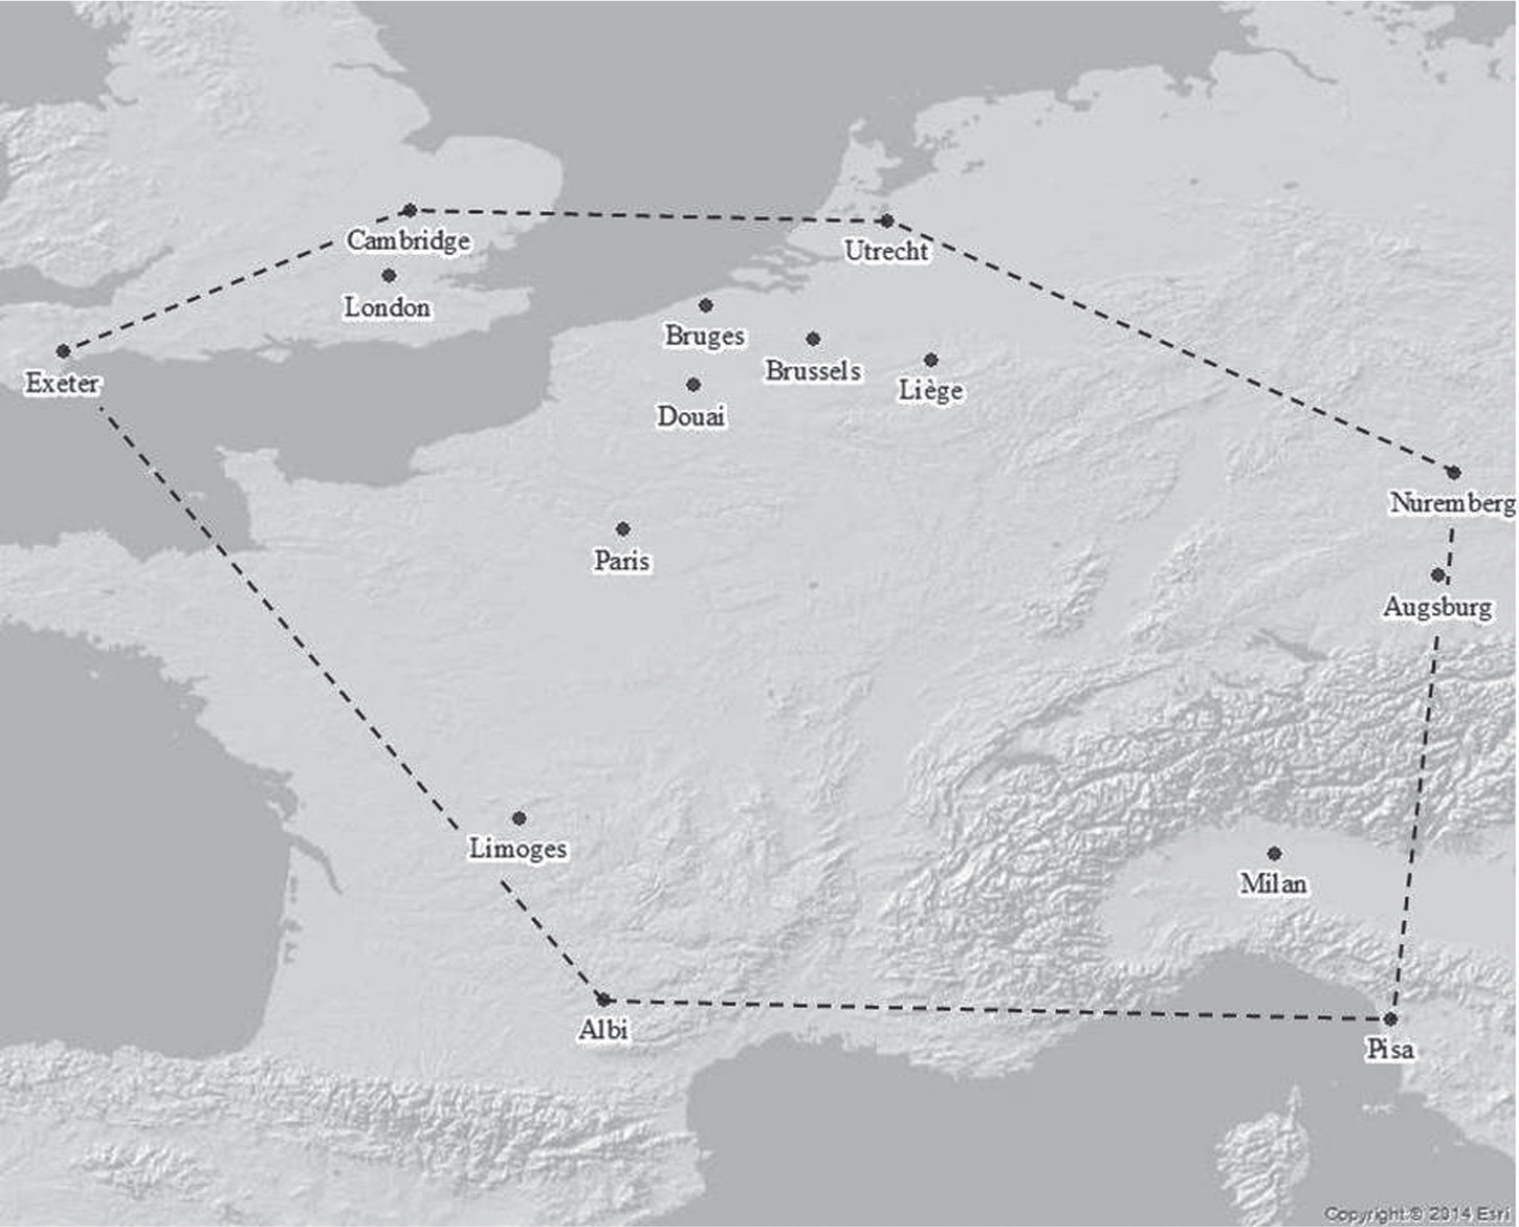
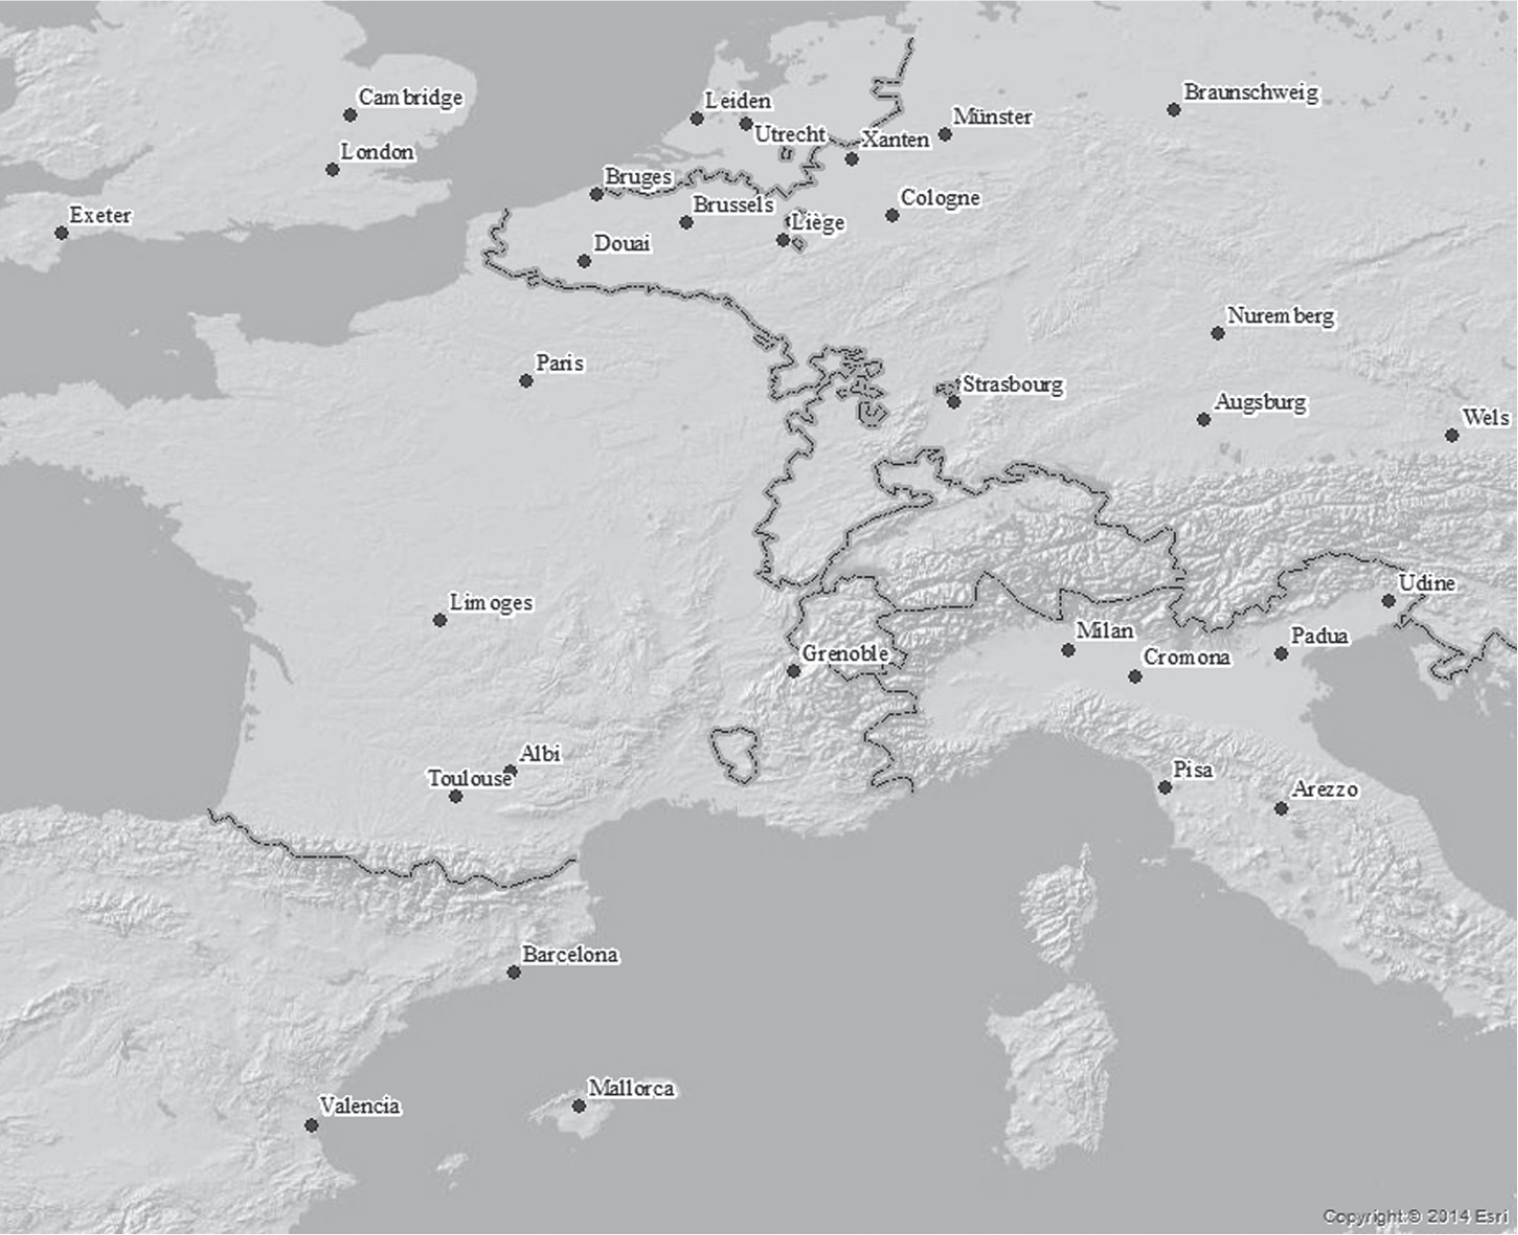
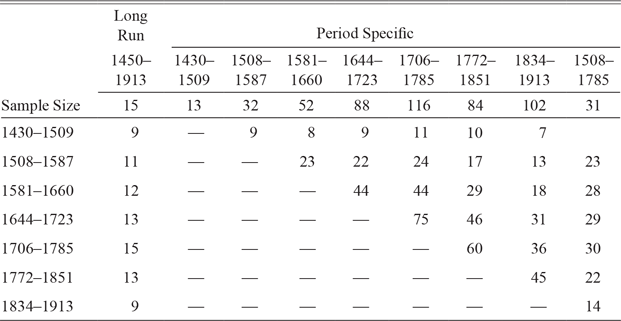
The number of available price series increases over time, reaching a maximum of 300 different markets in the eighteenth century. Inter-temporal changes in the geographical coverage, i.e., sample composition, would likely bias the results of any analysis that draws on all series in the data set (“unbalanced sample”). In the interest of consistency and as a means of avoiding these biases, we constructed different “balanced” samples, each including a constant set of markets over time. The analysis relies on a long-run balanced sample of 15 markets for 1450–1913 (Map 2) and a larger balanced sample of 31 markets that covers the period 1508–1785 (Map 3). A further set of seven overlapping period-specific balanced samples for 80-year periods is designed to maximize the number of markets represented.Footnote 10 In order to ensure as even as possible geographical coverage in the seven samples, we first superimposed a grid of 100 by 100 kilometer cells onto the European map. In the next step, we checked whether any cell contained more than one market; wherever that was the case, we retained that market whose distance to markets in neighboring grid cells is largest. The procedure serves to minimize over- or under-representation of regions. Its advantage is that it does not impose a priori segmentation into periods assumed to be historically significant. It also avoids geographical clustering of markets along political borders, which changed frequently in our period. Note that especially from the sixteenth century onward, the samples show a strong overlap in terms of the markets represented (Table 1). This facilitates the interpretation of the results of our analyses from a long-term perspective.
LONG-RUN BALANCED SAMPLE: 15 MARKETS
Note: The dotted line defines the area covered in the construction of a subset of markets from the period-specific samples (see the Results: Convergence and Co-Movement section).
Sources: Authors’ own elaboration. Underlying map: Esri. “World Light Grey Base” [basemap]. Scale Not Given. January 31, 2015

1508–1785 BALANCED SAMPLE: 31 MARKETS
Sources: Authors’ own elaboration; underlying map: Esri. “World Light Grey Base” [basemap]. Scale Not Given. January 31, 2015

BALANCED SAMPLES: NUMBER OF OVERLAPPING MARKETS

Source: See the text.
RESULTS: CONVERGENCE AND CO-MOVEMENT
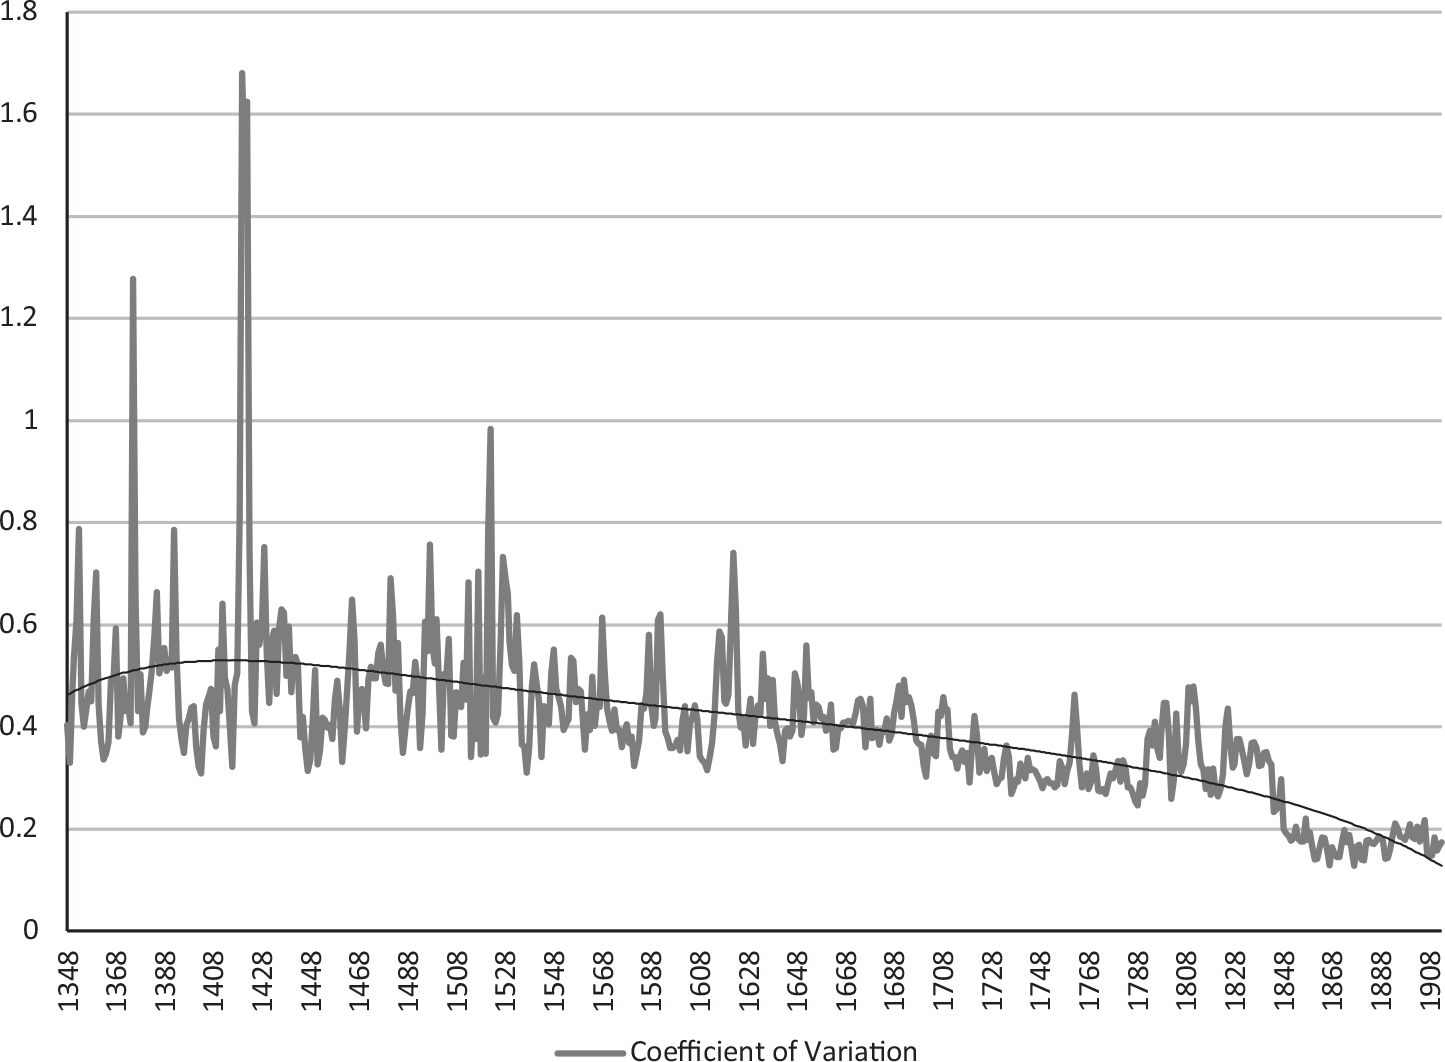
As a first cut, Figure 1 documents the coefficient of variation for all markets (unbalanced sample), including a polynomial trend for ease of exposition. Notwithstanding pronounced fluctuations in the short and medium term, the data suggest a long-run trend fall in price dispersion from, broadly, the first half of the fifteenth through to the early twentieth century. Note, though, there were significant—if temporary—reversals, especially in the early sixteenth and early seventeenth centuries as well as during the French Revolutionary and Napoleonic Wars. From about 1850, price differentials remained more or less stable.
LONG-RUN PRICE CONVERGENCE—COEFFICIENT OF VARIATION, UNBALANCED SAMPLE
Source: See the text.

Figure 2 compares the pattern of convergence from 1450 onward according to the unbalanced and the long-run balanced sample. The latter always includes the same 15 markets. The overall picture of a long-run decline in price dispersion is broadly similar in both samples. However, there are striking differences in detail and timing: Despite some pronounced variation, price differentials within the balanced sample declined from a peak at the end of the fifteenth to a trough at the beginning of the seventeenth century. For the remainder of the early modern period, convergence among the 15 markets did not progress beyond what had been achieved earlier on. The minimum of dispersion was reached in the 1870s, with the decades thereafter seeing a major rollback in price convergence.
LONG-RUN PRICE CONVERGENCE—COMPARISON: UNBALANCED VERSUS BALANCED SAMPLE
Source: See the text.

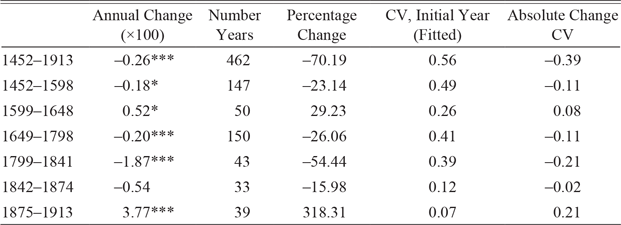
How valid is the impression gained from the development of the coefficient of variation of the balanced sample? We explore trend and level breaks more formally, using a Bai–Perron (2003) test. The results point to breaks in 1599, 1649, 1799, 1842, and 1875, yielding six periods. For each of these periods, linear trends have been estimated with an error correction model (Razzaque et al. Reference Razzaque, Grynberg and Newton2007):
 $$\Delta \ln ({\rm{C}}{{\rm{V}}_t}) = c + \beta \,{\rm{TIME + }}\psi {\rm{ln(C}}{{\rm{V}}_{t - 1}}{\rm{) + }}\varphi \,\Delta \,{\rm{ln(C}}{{\rm{V}}_{(t - 1)}}{\rm{) + }}{u_i},$$
where TIME tests for the existence of a deterministic trend: prices converge if β is negative and significant. The coefficient ψ on the error correction term, which is expected to range between –1 and 0, measures the speed of return to this trend: the higher ψ is, the faster is the return to trend. The lagged shock term [Δ ln(CV t–1)] is added to account for possible serial correlation. We compute the trend rates rate of change as t = –(β/ψ) and test the null hypothesis of the rates being zero with a Wald test.
Table 2 offers three important insights:Footnote 11 First, arguably the most striking result is the early onset of price convergence in the fifteenth century. By around 1600, price dispersion had already reached a level lower than in the early nineteenth century (fifth column in Table 2). Of course, such gains depended on time and place specific circumstances and indeed they were reversed in the first half of the seventeenth century. However, and this is our second point, this divergence had no lasting impact as convergence resumed after the end of the Thirty Years’ War. Thus, what Chilosi et al. (2013, p. 50) call “early roots” of integration, referring to the late seventeenth and early eighteenth centuries, was no more than an intermediate stage in a process that had begun at least 150 years before the start date of their analysis. Third, the table confirms that the first half of the nineteenth century, after the end of the French wars, was an age of rapid price convergence. However, this was reversed after 1870.
TRENDS IN THE COEFFICIENT OF VARIATION, LONG-RUN BALANCED SAMPLE (BAI–PERRON PERIODS)

Wald test:
* = Significant at the 10 percent level.
** = Significant at the 5 percent level.
*** = Significant at the 1 percent level.
Source: See the text.
A glance at Figures 1 and 2 suggests that the story told by the evidence from the complete, unbalanced sample differs from what the long-run balanced sample shows. This may be due to either the changing composition of the unbalanced sample, or its broader geographical coverage, or both (Maps 1 and 2 ). How representative, then, is the smaller long-run balanced sample?
We address this question in two ways. First, we consider to what extent the long-run balanced sample is representative of the area it covers, that is, markets between Southern England and Northern Italy. To this end, we draw on subsets of the seven period-specific balanced samples, which include only markets situated within the minimum-length geographical perimeter of the long-run sample (Map 2), and then compare the trends in the respective coefficients of variation. Second, we gauge the extent to which the long-run balanced sample is representative of the entire continent by contrasting trends in price dispersion in the former with the corresponding evidence extracted from the full set of period-specific balanced samples, which include markets from all over Europe (Table 1).
There are two alternative periodizations. The first is based on the 80-year period-specific samples. The second uses the Bai–Perron break dates in the long-run balanced sample, which is compared to a composite (spliced) series of the period-specific balanced samples. While there is some change in the makeup of the composite series, there is a large degree of overlap in the composition of the period-specific samples incorporated (Table 1).
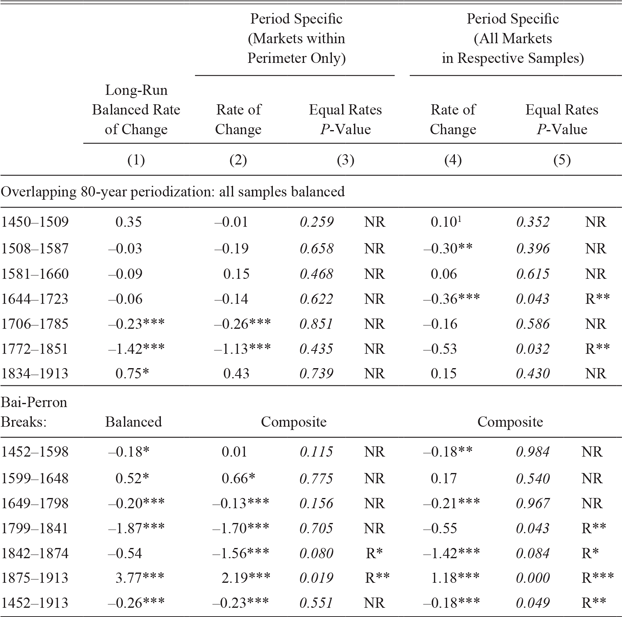
Table 3 reports the results. Comparison is facilitated by a Wald test of the null hypothesis of equal coefficients; “NR” indicates non-rejection of the hypothesis, implying that the rate of change of the coefficient of variation of the 80-year period-specific sample equals that of the long-run sample, and “R” that it is rejected.
TRENDS IN THE COEFFICIENT OF VARIATION—COMPARISON OF LONG-RUN AND PERIOD-SPECIFIC BALANCED SAMPLES

* = Significant at the 10 percent level.
** = Significant at the 5 percent level.
*** = Significant at the 1 percent level.
1 1430–1509
Source: See the text.
The upper panel shows that the long-run balanced sample of 15 markets is representative of the rates of change in price dispersion pertaining to the much larger number of markets located within its geographical perimeter (Columns (1)–(3)). It also mirrors the direction of change apart from the periods 1450–1509 and 1581–1660. Using the same samples but Bai–Perron periodization (lower panel) confirms these findings. The only exceptions are the late nineteenth and early twentieth centuries, where the rates of change differ significantly but, crucially, not their direction—both samples show statistically significant divergence after 1874. Over the entire period 1452–1913, the composite series of period-specific samples within the perimeter replicates the behavior of the balanced long-run sample. In contrast, the results for the full (or “pan-European”) set of period-specific samples are markedly different from those for the balanced long-run sample (Columns (1), (4), and (5)).
These robustness checks suggest that the long-run balanced sample represents the patterns of price divergence and convergence in the area between Southern England and Northern Italy more accurately than those in the rest of the Continent. This warrants a closer look at the regional dimensions of integration. With the onset of the Little Divergence in about the early seventeenth century, the trajectories of the different European economies began to diverge markedly: Underpinned by their comparatively early development of modern institutions, England and the Dutch Republic expanded most rapidly and assumed economic leadership from Northern Italy (Allen Reference Allen2001; Fouquet and Broadberry 2015; de Pleijt and van Zanden 2016). To what extent did the Little Divergence coincide with more advanced market integration among the economic leaders?
We address the issue by defining six regional groups of markets broadly along polity boundaries as of 1649.Footnote 12 The mid-seventeenth century has been chosen as it marks the center of the period studied; it also corresponds well with the timing of the Little Divergence and the end of the Thirty Years’ War. The six “regions” are covered in both the long-run unbalanced sample and a balanced sample of 31 markets for 1508–1785 and include Britain (England/Scotland, which for most of our period were politically integrated to a smaller or larger extent), France, the Holy Roman Empire north of the Alps (i.e., those of its territories subject to the Imperial constitution (cf. Schmidt Reference Schmidt, Robert, Schaich and Peter2011, p. 46)), Italy, which was, in Metternich’s words, a “geographical expression” rather than a political unit, the Dutch Republic, and the Iberian Peninsula (Map 3).Footnote 13
The size of these regions differed and so did, ceteris paribus, average distance-related trade costs between markets in each area. Thus, levels of integration and their changes over time have been measured by comparing actual gaps between all pairs of markets in each region with year-specific, distance-adjusted price gaps. First, we estimate the elasticity of price gaps with respect to distance, as a proxy for trade costs, by running the regression for all pairs of markets i and j in year t:
 $${\rm{abs(}}\ln ({P_{it}}{\rm{/}}{P_{jt}}{\rm{)) = }}{\varphi _t}\ln ({\rm{dis}}{{\rm{t}}_{ij}}).$$
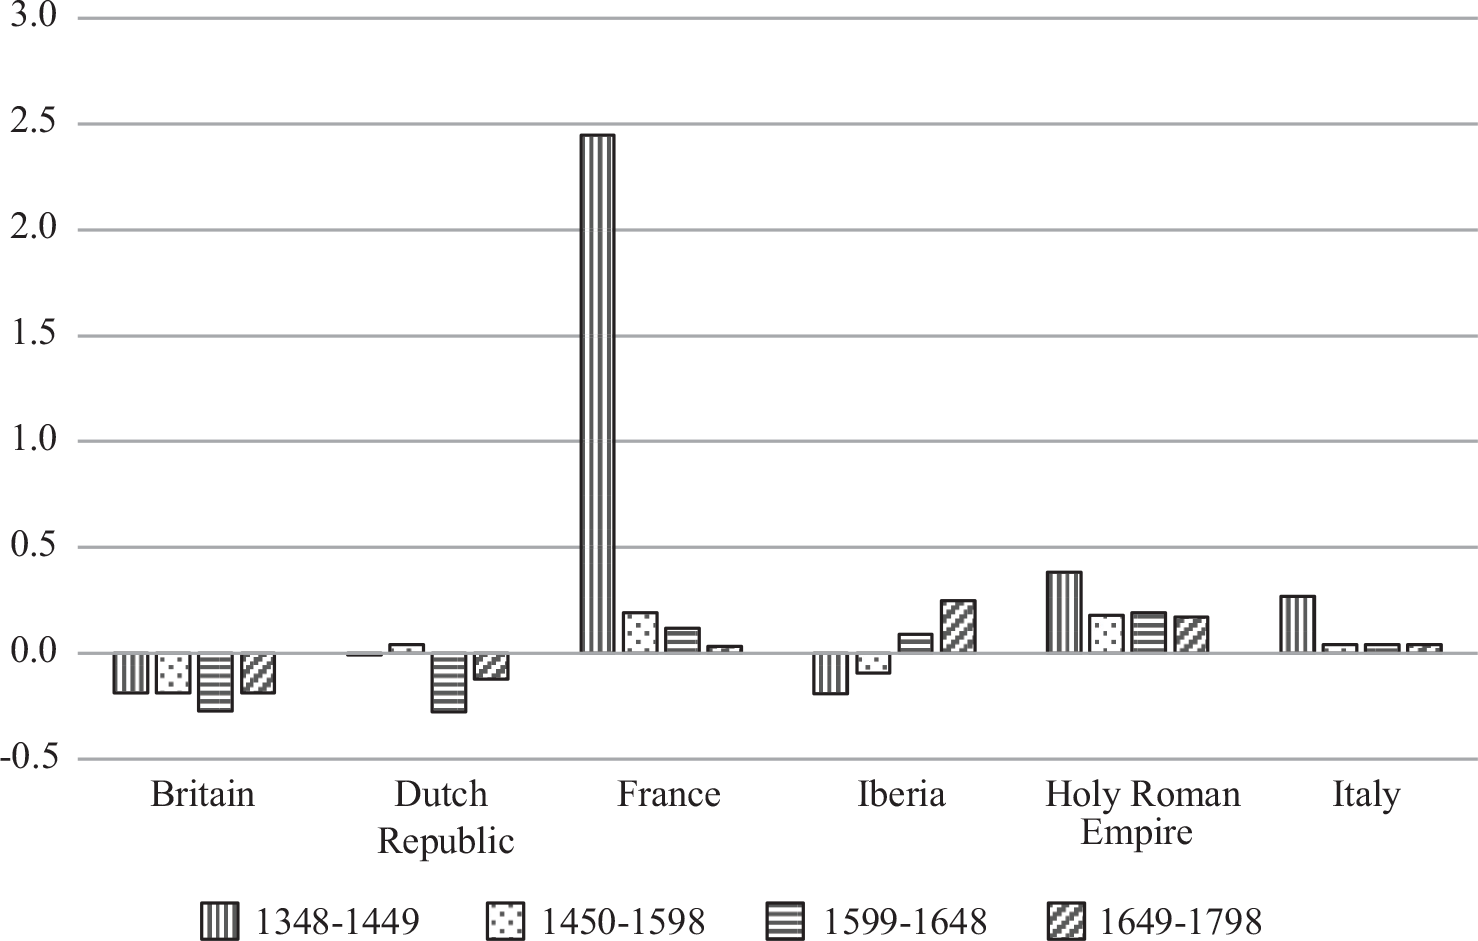
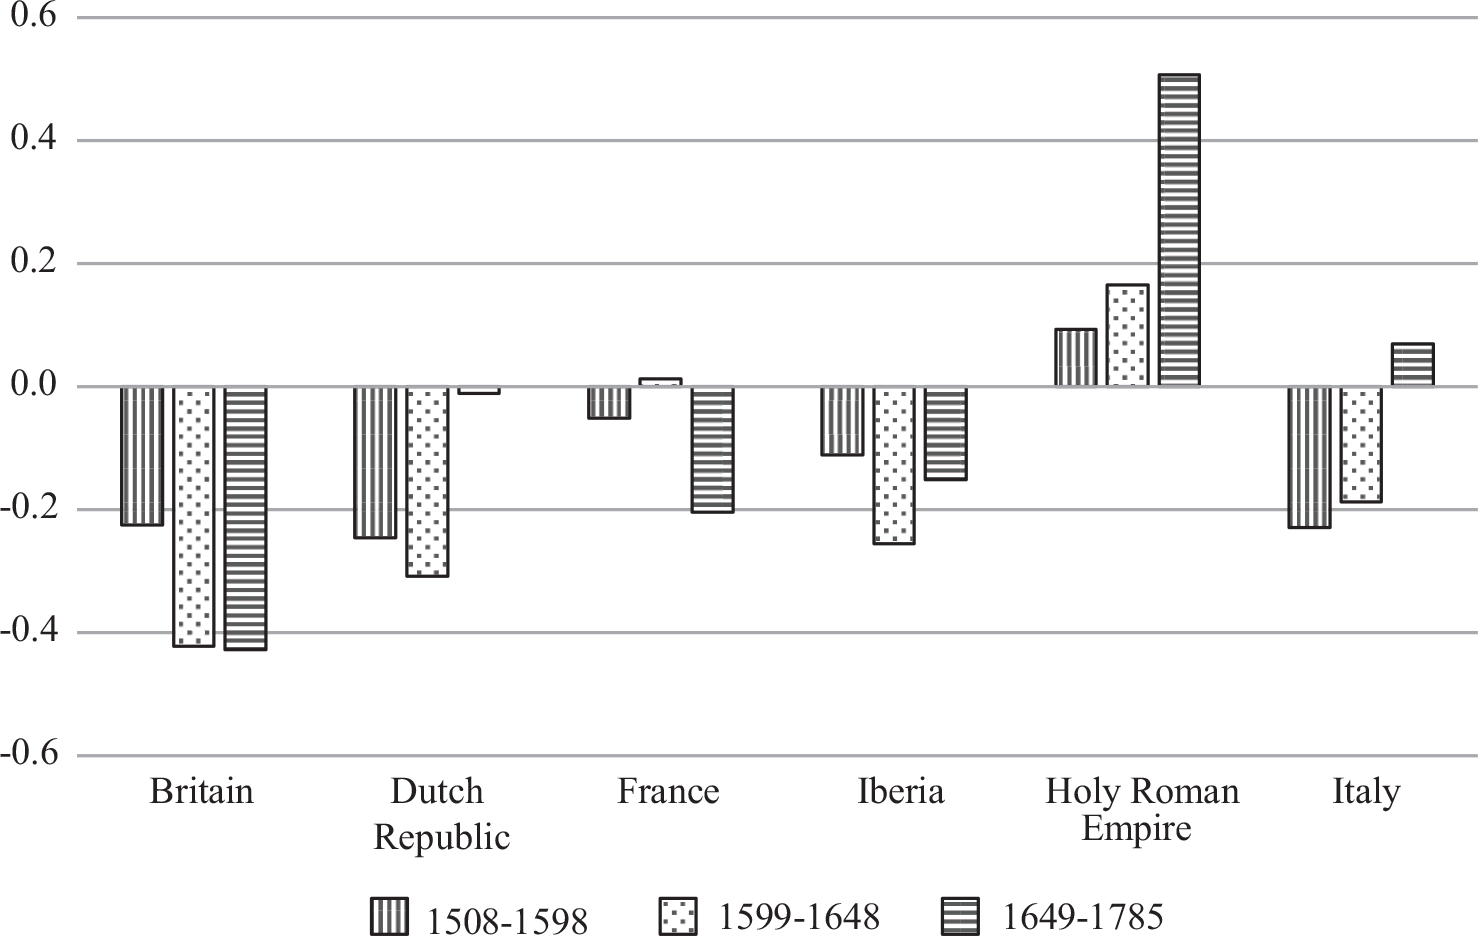
Second, as the coefficient is very volatile (because the cross section changes from year to year and there are strongly fluctuating prices), we smooth the yearly series of φ with an Epanechnikov kernel and then compute the expected price gap for each pair of markets, given their distance. Third, we average the differences between actual and expected price gaps for the markets of each region in year t and divide the result by the (smoothed) average of bilateral price gaps across European markets in the given year (minus one).Footnote 14 There are two versions. Figure 3a uses as denominator all available market pairs in the long-run unbalanced sample, that is, it compares average distance-adjusted price gaps in the six regions with the average for the entire continent (cf. Map 1). Figure 3b, in contrast, draws only on price gaps between the markets in the balanced 1508–1785 sample, that is, it compares price gaps in any of the six regions with the average across these regions that make up the sample area (cf. Map 3). In both cases, a ratio below zero implies that markets within a given region are better integrated than the relevant European average.
AVERAGE DISTANCE-ADJUSTED PRICE GAPS BY REGION (UNBALANCED SAMPLE), 1348–1798

AVERAGE DISTANCE-ADJUSTED PRICE GAPS BY REGION (BALANCED SAMPLE), 1508–1785
Source: See the text.

A first look at the evidence from the broader, Europe-wide unbalanced sample (Figure 3a) indicates strong regional deviations from the average European price gap. Markets in France, the Holy Roman Empire, and Italy appear distinctly less well integrated than the average, while price gaps in Britain were consistently smaller. The position of the Dutch Republic and Iberia changed over time. In this context, the evidence on the Northern Netherlands ties in well with the idea of a Little Divergence beginning in the seventeenth century. However, Britain enjoyed an integration advantage over the rest of the continent throughout the period.Footnote 15
The comparison within the area covering only the six regions (Figure 3b) shows that in the sixteenth century, English and Dutch markets were well integrated, but not exceptionally so. Price differentials between them were smaller than those between markets in France, Iberia, and most clearly the Empire, but Italian markets were still roughly on a par. From the early seventeenth century onward, however, Britain and the Netherlands became truly exceptional. The Empire and Italy, by contrast, deteriorated progressively in relative terms. Taken together, these findings lend considerable support to the claim that the Little Divergence began in the seventeenth century. The results for Iberia need to be taken with a pinch of salt: All three markets are on the coast, which made for comparatively easy communication between them.
While providing a comprehensive explanation of these findings is beyond the scope of this paper, offering a tentative hypothesis for future research is in order. Thus, the lack of internal custom borders, the easy access to water transport in most of the country, and the relative rarity of destructive warfare on the British Isles are likely to have contributed to the exceptionally rapid and far-reaching advance of price convergence between markets in England. The Dutch Republic cannot but have benefited from easy access to internal water transport. The Empire, by contrast, was ravaged by the Thirty Years’ War, which, though being a Europe-wide conflict, was mainly fought on its territory. In addition, the war acted as an “institutional hothouse” (Reference Ogilvie, Parker and LesleyOgilvie 1992/97): Governments attempted to cover the costs of warfare by selling regional monopoly rights that stayed in place long after the return of peace, tore apart existing trade links, and prevented the creation of new ones.
So far, the discussion of results has focused on price convergence as the first of two dimensions of market integration explored in this paper. Next, we turn to the second dimension, market efficiency, which we approximate by its outcome, that is, by the extent of co-movement in prices. The more efficient a market, the less likely are permanent equilibrium price differentials between different locations.
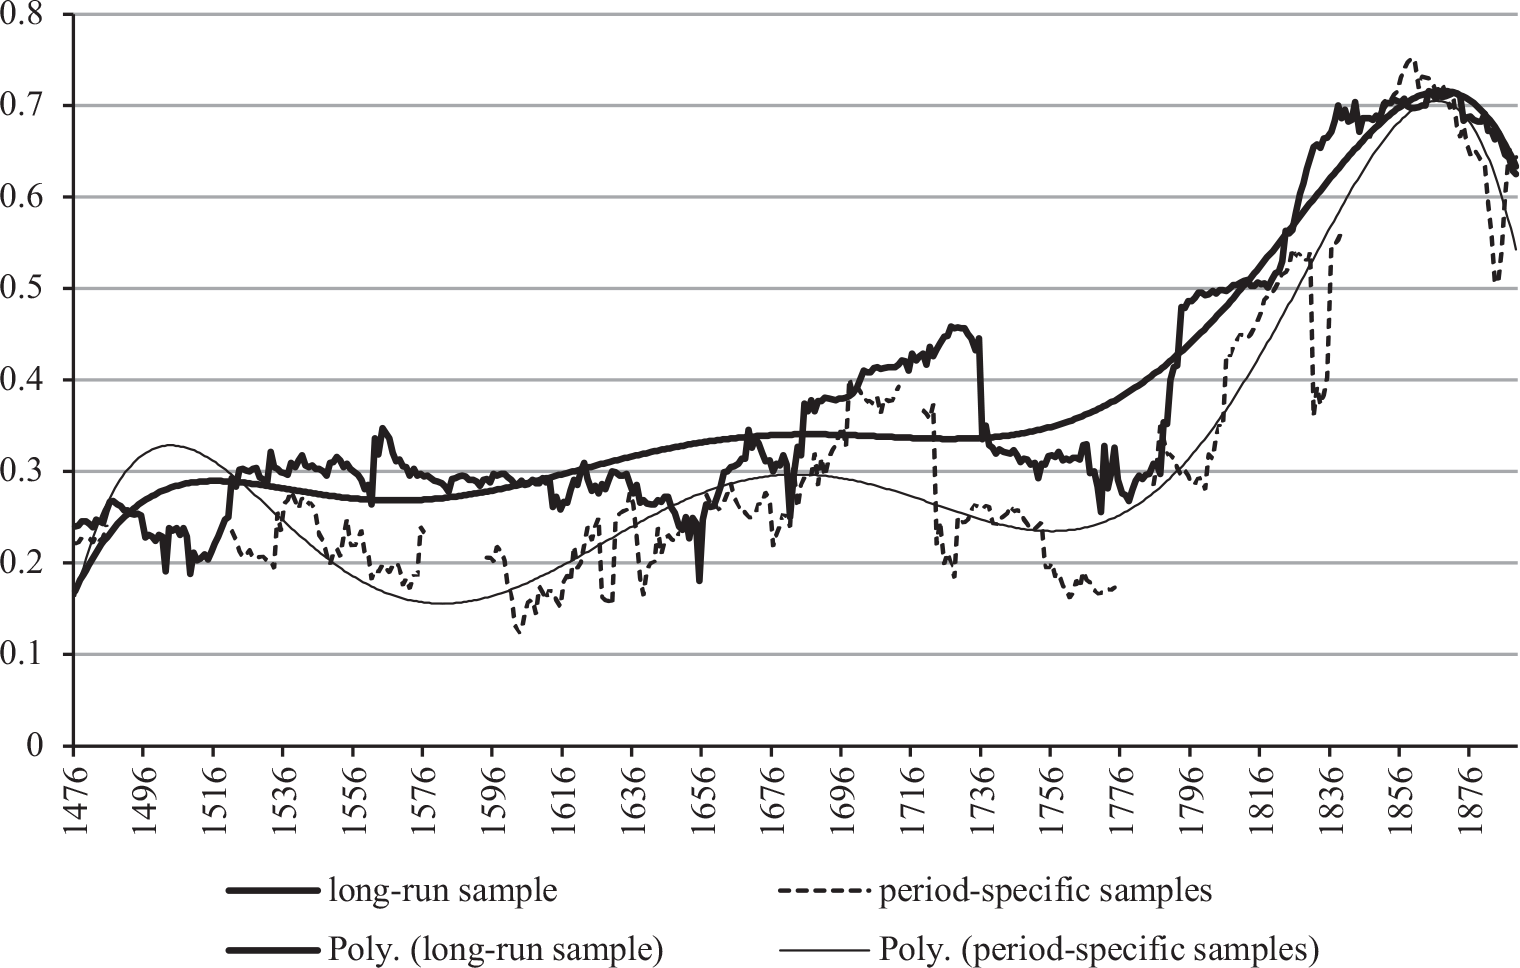
Here, we draw on DFA, as set out above (in the Empirical Strategy section), to derive a sample-wide (synthetic) measure of “efficiency.” Running the DFA model over rolling windows, we settle for 51-year rolls for the balanced long-run and the first period-specific sample (15 and 13 markets, respectively) and 25-year rolls for the other period-specific samples (between 32 and 116 markets).Footnote 16 Each roll yields estimates of the common factors (c t ) and of market loadings (λ i )—and, thus, of τ i and T i . These parameters refer to all years of the roll. For instance, the earliest roll of the long-run sample is computed with the years 1450–1501, and it measures the efficiency in 1476, its 26th year.
Both series suggest that market efficiency, as approximated by co-movement, grew over the long term, though with distinct level differences between the long-run and period-specific samples (Figure 4). Comparing the measures for both samples suggests that, taken together, the 15 markets included in the long-run balanced sample were more efficient for most of the period under review than the far larger number of markets in the period-specific samples. There are also some differences in the timing of short-run variations, but—and this is the main point—the trends suggest that the major phases of increase and decline in efficiency were fairly well aligned between the samples. Market efficiency started to improve slowly in the sixteenth century and, after a sharp reversal in the mid-eighteenth century, gains accelerated just before and after the French wars.Footnote 17 Some of the potential causes of inter-temporal changes in efficiency are discussed in the next section.
EFFICIENCY MEASURES, BALANCED SAMPLES
Source: See the text.

THE INTEGRATION OF THE EUROPEAN MARKET
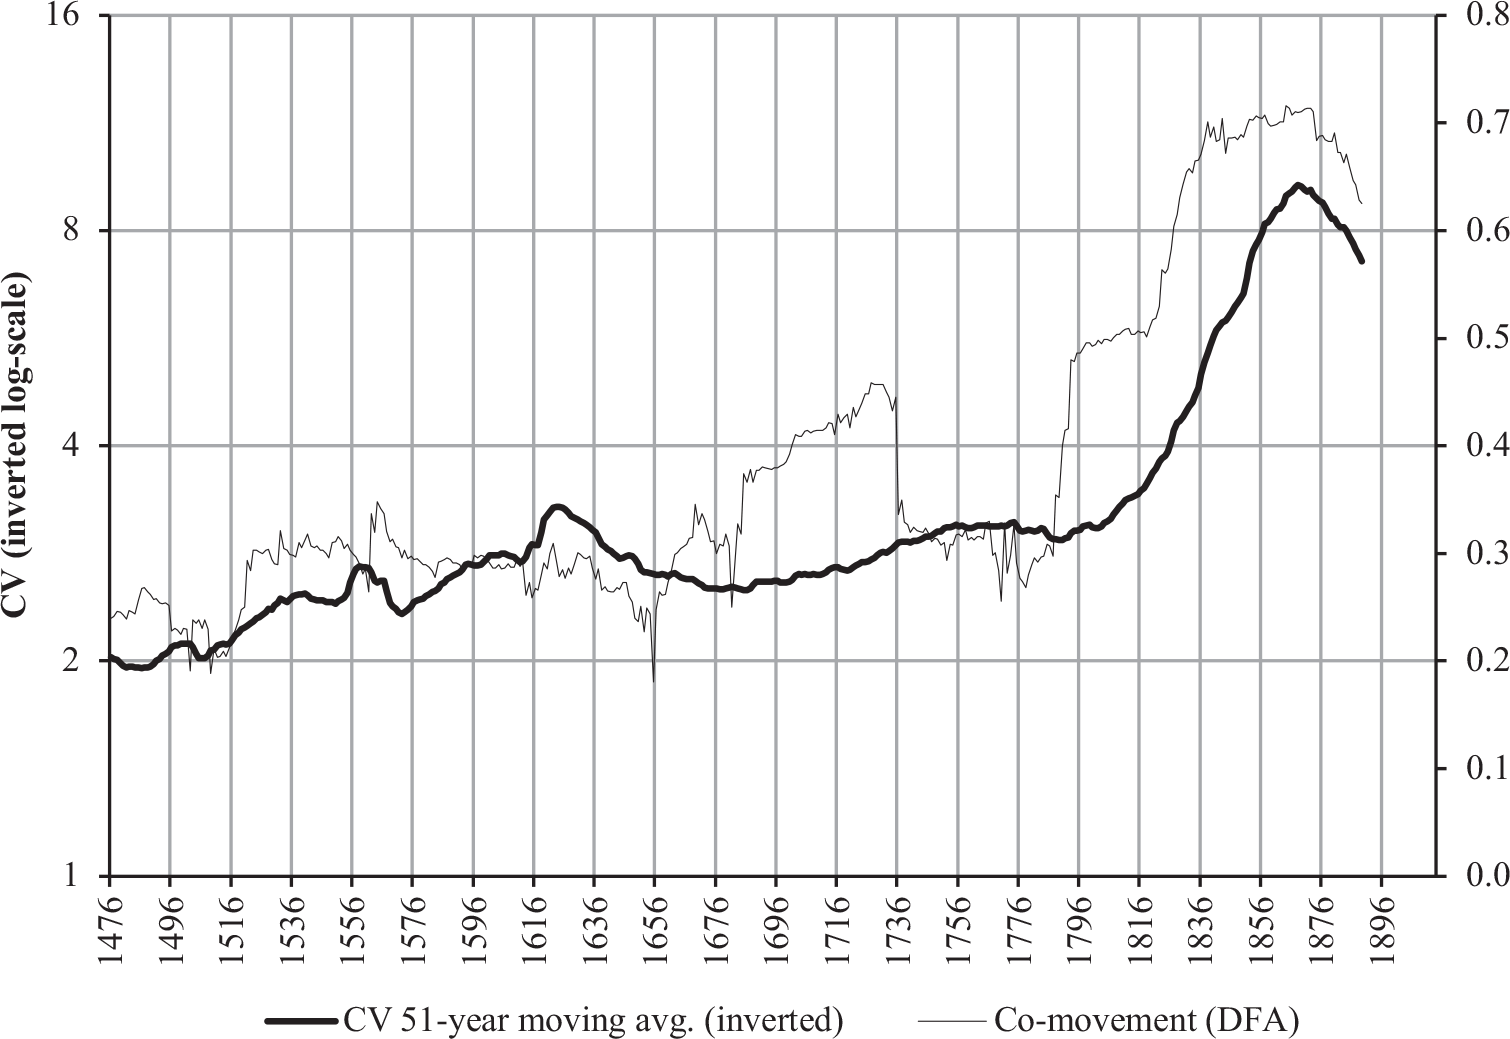
Figure 5 compares the main findings on price convergence and efficiency. The graph reproduces the DFA-based efficiency measure for the long-run sample from Figure 4. For ease of comparison, the series of the coefficient of variation (from Figure 2), expressed on a log scale, has been inverted and smoothed with a 51-year moving average.
PRICE-CONVERGENCE AND CO-MOVEMENT—BALANCED LONG-RUN SAMPLE
Source: See the text.

In the long run, market integration improved along both its dimensions: prices converged and co-movement increased (or markets became more efficient). However, the pattern of changes differed significantly between the two measures over extended periods, that is, between c. 1560 and 1618, the years from about 1655 to the 1670s, and from the 1730s to the 1770s. It was only in the first half of the sixteenth century, the Thirty Years’ War period, and from about 1790 onward that price convergence and co-movement moved broadly in tandem.
Concerning co-movement, our findings differ markedly from Chilosi et al. (2013) whose focus on the shorter, post-1620 period does not allow identifying the long-term trend that becomes apparent when the fifteenth and sixteenth centuries are included in the analysis. They see the increase in co-movement from about the 1770s in the context of French physiocratic policies that “lifted restrictions on the export of grains from localities” while at the same time pointing to “stationary trading costs in the second half of the 18th century” and lauding the “achievements of mercantilist policies of state formation” (Chilosi et al. 2013, p. 52). There are two problems with these claims. First, Turgot’s French physiocratic experiment of domestic grain market liberalization lasted less than two years (from September 1774 to May 1776; Jones Reference Jones2003, pp. 296, 300; Persson Reference Persson1999, pp. 5–6, 142–43). It would seem unlikely to have had a strong effect on Europe over the period 1770–1850. Second, there is no a priori reason why a rise in co-movement should be “difficult to reconcile” with either falling or stationary trade costs, as the authors seem to suggest.
Both price convergence and co-movement depend ultimately on trade costs. Trade costs “include all costs incurred in getting a good to a final user other than the marginal cost of producing the good itself: transportation costs (both freight costs and time costs), policy barriers (tariffs and non-tariff barriers), information costs, contract enforcement costs, costs associated with the use of different currencies, legal and regulatory costs, and local distribution costs (wholesale and retail)” (Anderson and Wincoop 2004, p. 691 f.). Some changes in these costs affect both convergence and efficiency in the same way, while others have a differential impact.
Market integration would be enhanced by institutional change, which makes arbitrage between spatially distinct markets less costly (e.g., by increasing physical or legal security), by reduction of duties and by a decline in transportation costs (and vice versa). Such changes cause the commodity points to narrow and, ceteris paribus, foster convergence and reduce the scope for uncorrelated price movements. For instance, it is well known that the 1830s and 1840s featured wide-ranging liberalization of wheat imports in Europe—the abolition of the Corn Laws being the best-known instance (Federico Reference Federico2012b). Until the 1870s, duties on wheat remained nil or negligible in all major European countries. In response to the “grain invasion” of Europe, most Continental countries started to protect wheat production from the late 1870s/early 1880s and increased duties in the 1890s. On the eve of the First World War, duties on wheat were about 30 percent in Italy, France, and Germany (Bacon and Schloemer Reference Bacon and Schloemer1940). Eight of the fifteen markets in our long-run balanced sample are located in these countries. The ratio between their average prices and those of the seven markets in free-trade countries (Belgium, Netherlands, and the United Kingdom) rose from 1.04 in 1874–1876 to 1.36 in 1911–1913. The cross-country component (reflecting international trade) accounts for 97 percent of the increase in overall variance in the long-run sample.
Conventional wisdom holds that nineteenth-century progress in transport technology—most notably the adoption of steam—helped integration (O’Rourke Reference O’Rourke1997; Findlay and O’Rourke Reference Findlay and O’Rourke2007). However, our results suggest we should not overrate the effects of technical change in this period. For one thing, the beginning of the railway age in Europe coincided with the trend break that marks the end of significant price convergence (1842); for another, the fall in transport costs in the second half of the century was obviously insufficient to make up for the effects of the protectionism that proliferated in Europe from the late 1870s onward. As for the preindustrial period, it is not clear to what extent changes in transport costs affected price convergence. The limited available evidence (Masschaele Reference Masschaele1993; Ballaux and Blonde 2018) seems to rule out any substantial decline in overland transport costs before the advent of systematic road building in eighteenth century England and France (Bogart 2005 and Reference Bogart, Diebolt and Haupert2019) and early nineteenth century Germany (Uebele and Gallardo-Albarran 2015). Concerning sea transport, the jury is still out. British domestic freight costs, at least, fell sharply in the second half of the eighteenth century (Reference HarleyHarley 1988). Reference Menard and JamesMenard (1991) argued that in the long term, freight rates were stable, whereas Van Zanden and Tielhof (2009) found an at least temporary decline in Baltic rates in the fifteenth and sixteenth centuries. Lucassen and Reference UngerUnger (2011) argue that labor productivity in shipping grew fast since the Middle Ages, which also points to a decline in freight costs.
Changes in other components of trade costs may affect price convergence and efficiency in different ways.Footnote 18 Consider, for example, information, and here not only the costs, but also the kind of information acquired. If such costs decline and the information is about existing price differentials, the scope for arbitrage over space increases, resulting in both price convergence between markets and stronger co-movement. If, however, information costs decline and the information is about expected price changes, then the outcome is an increase in the scope for arbitrage over time: Merchants may, for example, react by stockpiling grain, expecting to sell it at a later date and for a higher price. Arbitrage over time, therefore, will affect co-movement but not necessarily price convergence. Importantly, if the speed of transmitting such information differs regionally—for example, access to relevant news improves everywhere but more quickly in some markets than in others—the result will be a decline in overall co-movement. Relaxing institutional restrictions on stockpiling aimed at exploiting expected price changes (forestalling, in early modern parlance) earlier in some places than in others should have similar consequences.
These factors likely account for many of the ups and downs in co-movement we observe before the 1770s. While the introduction of printing with movable types from the mid-fifteenth century made information more accessible, the importance of this innovation should not be overrated in the present context. After all, the new technology affected mainly the storage of information, rather than its transmission between markets (cf. Dudley Reference Dudley1999, p. 601). Information transmission improved primarily through two channels: the emergence of postal systems from about 1500 and that of newspapers from c. 1600 onward. Older ways of transmitting information had relied on sending irregular messengers who were often couriers in the literal sense of the word and, therefore, slow (Volckart Reference Volckart, Müller and Ojala2007). Postal systems, by contrast, were characterized by regular links between markets, increasing speed, and reliability—three features that resulted from the creation of relay “posts,” where messengers could change horses, and from the opening of public messenger services to private consumers. The first such system was established between the Habsburg territories in the Netherlands, the Tyrol and Milan from 1490 onward, with private individuals being permitted to use the Imperial mail from 1516. While the postal network spread over the Holy Roman Empire, Habsburg, Italy, and Spain with a speed that Behringer has called a “communications revolution” (2005, p. 43 f., Reference Behringer, Lanzinner and Strohmeyer2006, p. 121), France and England copied the system only from, respectively, 1603 and 1636 onward (Morteveille Reference Morteveille2009; Lewins Reference Lewins1865, p. 38 f.).Footnote 19
The first modern newspaper—a weekly—appeared in Strasbourg in 1605 (Weber Reference Weber1992, Reference Weber2005). By stimulating interest in political news, the Thirty Years’ War helped rather than hindered the spread of the new medium across the Empire, with the first daily paper appearing in its immediate aftermath in Leipzig. As Germany was politically decentralized, effective censorship was not feasible and almost any fact and opinion could be printed somewhere. The Empire was, therefore, a particularly propitious environment for the emergence of a wide reading public that enjoyed access to a variety of news from many places. By the end of the seventeenth century, about 200 different newspapers appeared in more than 70 of its towns and cities (Schröder Reference Schröder1995, p. 6 f.). In England, the licensing act that restricted publications lapsed in 1694, and from then onward, newspapers began to proliferate. The first daily appeared in London in 1702, and in the provinces, 22 papers were founded between 1714 and 1725 alone. By 1780, there were 50 (Williams Reference Williams2009, p. 49). Absolutist France, by contrast, had just one paper—the Gazette de France—that was allowed to publish political news, though between 1745 and 1785, the number of permitted foreign political papers increased from 5 to 19 (Censer Reference Censer2002, pp. 8, 10). In short, the differential timing in the introduction of the new print medium across Europe is a likely part of the explanation as to why co-movement across European markets declined in the first half of the seventeenth century and increased thereafter up to the 1730s.
The ban on forestalling had restricted the ability of merchants to react to shocks that affected large numbers of markets simultaneously. Here, too, changes appeared in different regions at different times. Sreenivasan (Reference Sreenivasan2004, pp. 96, 271) has shown that whereas in South Germany traditional norms were still enforced in the fifteenth century, non-compliance spread and by the beginning of the seventeenth century the ancient ban on forestalling was a dead letter. In many English counties, by contrast, magistrates were still strictly enforcing such rules during the period of poor harvests in the mid-seventeenth century (Hindle Reference Hindle2008, pp. 74–76).
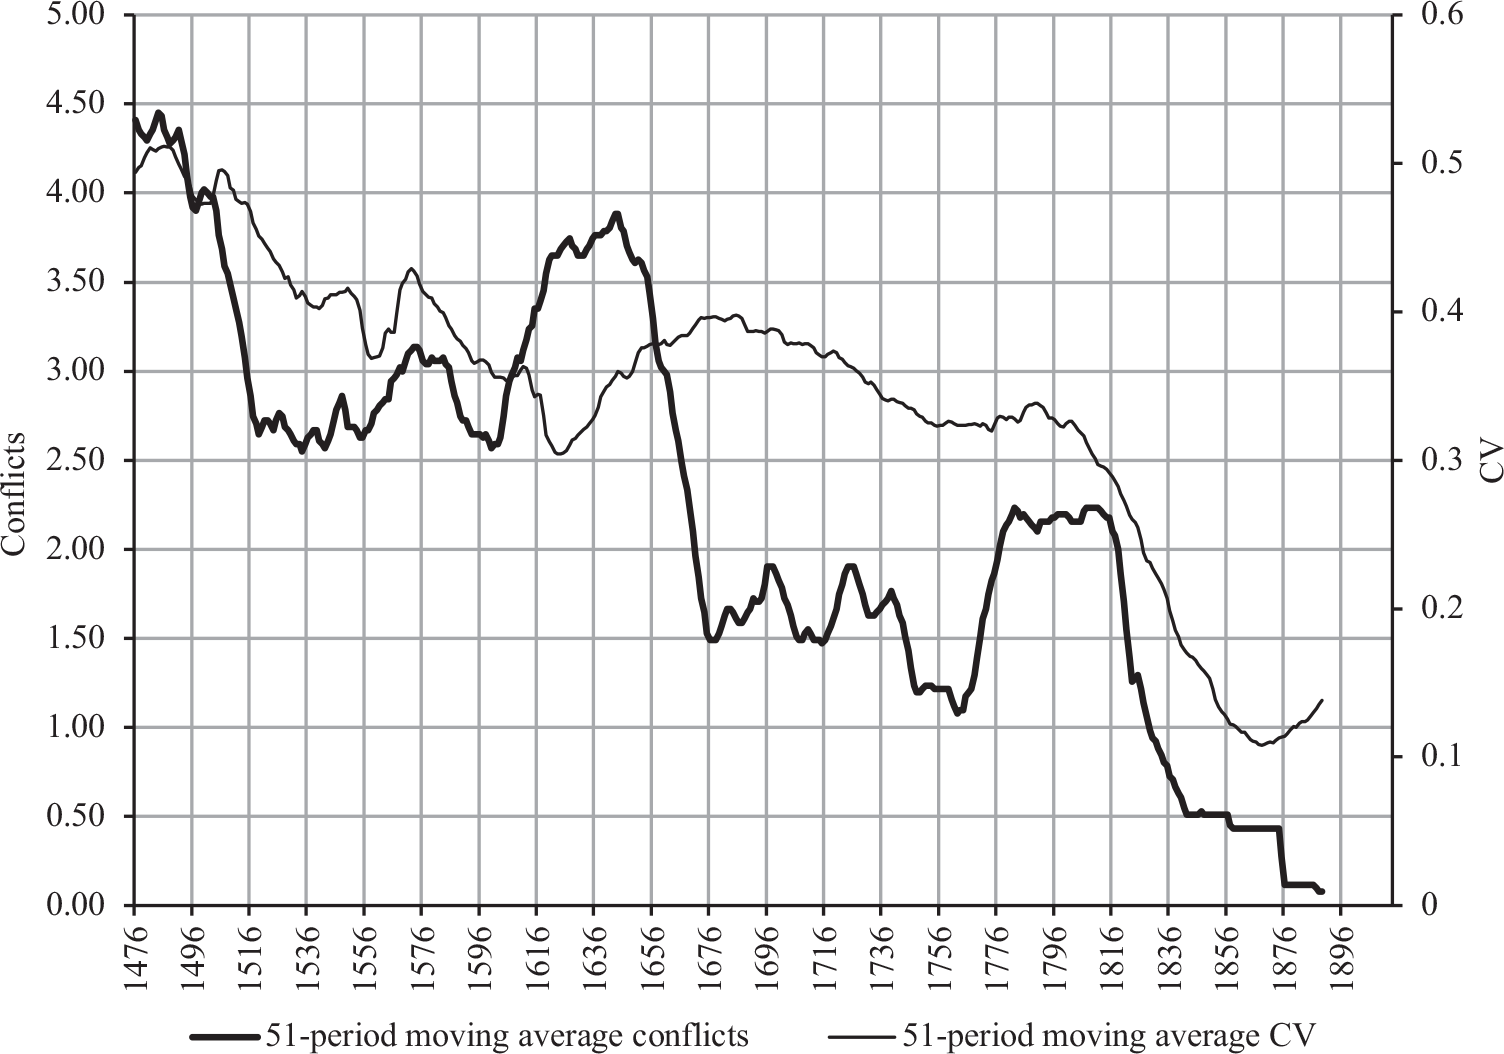
In sum, both the access of merchants to information and their freedom to respond to this information developed unevenly across space and time. Agents located in regions with no effective censorship, a variety of news channels, and institutions that imposed only weak restrictions on arbitrage over time were able to react quickly, while others were still lagging behind. It, therefore, seems plausible that the observed decline in market efficiency in the middle decades of the eighteenth century was, to some extent, the result of the simultaneous spread of newspapers in the Holy Roman Empire and Great Britain and increasingly strict censorship in France during and after the Seven Years’ War (the number of royal censors grew from 79 in 1741 to nearly 200 in 1789; Jones Reference Jones2003, p. 116). However, price convergence and the underlying arbitrage over space were affected by different factors that could be triggered by the same historical events or processes. Wars, for example, stimulated the interest in news that might concern the expected supply of grain, creating opportunities for arbitrage over time. On the other hand, it is highly likely that war disrupted trade networks and had harmful effects on price convergence. Military operations, fear and uncertainty, and the requisitioning of draught animals were bound to disrupt commerce (Wilson Reference Wilson2010, p. 800). In the seventeenth century, for example, armies needed about 10 horses for every 15 soldiers (van Crefeld 2004, p. 24). At the height of the Thirty Years’ War in Germany in 1631/32, Wallenstein and Gustavus Adolphus fielded around 100,000 men each (Wilson Reference Wilson2010, p. 494). These masses of troops would be accompanied by altogether at least 130,000 horses. According to Reference SombartSombart’s estimate (Reference SombartSombart 1916/87, p. 341), just before the advent of the railway in the early nineteenth century, the entire transport sector of the German economy employed fewer than 40,000 horses. Even considering that many more were used in agriculture (in about 1800, approximately 2.7 million; Reference BittermannBittermann 1956, p. 42 f.), and that water transport played a large role, military requisitioning must have had a severe impact on commerce. The available data are consistent with the view that wars played a role in shaping the European pattern of price convergence and divergence between the fifteenth and early twentieth centuries. Drawing on Peter Reference BreckeBrecke’s data set,Footnote 20 we computed the annual number of armed conflicts fought on the European territories covered in the long-run balanced sample.Footnote 21 Across Europe, the average number of conflicts declined over the long term, imperfectly mirroring the fall in average price differentials. Figure 6 shows a fairly close association between the frequency of warfare and the level of the coefficient of variation, drawing on 51-year moving averages as in Figure 5. Simply put, on average and over the long term, war was positively correlated with an increase in price dispersion.
CONFLICTS AND CONVERGENCE
Sources: See the text. Data on conflicts from https://brecke.inta.gatech.edu/research/conflict/.

CONCLUSION
This paper examines two dimensions of integration of the European market for wheat—the convergence in prices and the increase in efficiency—over the period from the Black Death to the First World War. Geographically, this study covers most of Europe from the Atlantic to the Ural and from the White Sea to the Mediterranean.
Our results are based on data far more comprehensive across time and space than those used in earlier analyses. They suggest a distinctly different picture of the long-run process of price convergence from that drawn in the recent historiography. Convergence started in the late fifteenth century, advanced rapidly until the beginning of the seventeenth century when it temporarily stalled, resumed after the Thirty Years’ War, and accelerated after the Napoleonic Wars in response to trade liberalization. From the late 1840s, convergence petered out and turned into divergence after 1875 as policy decisions dominated technological change. Thus, grain market integration in Europe was in the main a pre-industrial phenomenon.
The results of our regional analysis of price gaps lend support to the notion of the Little Divergence between a rapidly advancing Northwest and the rest of the Continent beginning in the seventeenth century. However, a qualifier is required here: England enjoyed a significant integration advantage over the other European economies from as early as the fourteenth century. In the sixteenth century, both English and Dutch markets were better integrated than their counterparts but not by a large margin. It was from the early seventeenth century onward that these two economies became exceptionally well integrated as especially the Holy Roman Empire at the other end of the spectrum, but also Italy, deteriorated progressively in relative terms.
Long-term improvements in market efficiency, as signaled by co-movement, began in the early sixteenth century, that is, a few decades later than the onset of long-run price convergence. There were some temporary setbacks, notably in the second half of the sixteenth and in the mid-eighteenth century. The patterns of price convergence and co-movement overlap only weakly and in a few periods. This is likely the consequence of uneven institutional change and the non-synchronous spread of modern media and systems of information transmission that affected differentially the ability of merchants to react to news. Advances that were more rapid in some markets than in others would allow merchants in favored localities to react quickly, while others lagged behind. As a result, overall co-movement declined in such phases of development. It was only the comprehensive adoption of new media and information transmission systems as well as the eventual continent-wide erosion of traditional institutions restricting arbitrage over time in the late eighteenth century that initiated a period when price convergence and co-movement advanced in tandem.
These results have some implications for our interpretation of pre-industrial economic history and, thus, for future research. First, the early modern period of European history emerges as the great age of commercial intensification at the continent-wide level. The impact of industrialization, railway construction, and trade liberalization in the nineteenth century was sizeable, but it cannot possibly explain the extent and temporal pattern of price convergence since 1450 observed here. Second, a fuller account of the regional dimensions of European market integration and the Little Divergence will have to address explicitly the causes of England’s exceptionalism in the late Middle Ages. Finally, price convergence and improvements in market efficiency were frequently out of phase. We hypothesize that this had to do with differences in the timing and extent of changes in the costs of information relevant for arbitrage over space and the costs of information relevant for arbitrage over time. Testing this proposition empirically requires operationalizing transaction costs in a way that has rarely been attempted before (cf. Volckart Reference Volckart, Müller and Ojala2007).