


1. Introduction
Alpine basement nappes are typically made up of reworked Pre-Alpine basement shaped during collisional orogeny. They have been recognized as fundamental elements that shape collisional orogens such as the Alps since the study of Argand (Reference Argand1916). The cover sequences preserved within or atop basement nappes play a key role in defining nappe boundaries and constraining the tectono-metamorphic history of orogens (e.g. Epard and Escher, Reference Epard and Escher1996; Schmid et al. Reference Schmid, Fügenschuh, Kissling and Schuster2004; Steck et al. Reference Steck, Masson and Robyr2015). The so-called ‘Internal Crystalline Massifs’ (ICMs) of the Western Alps, namely the Monte Rosa, Dora-Maira and Gran Paradiso (Bearth, Reference Bearth1952; Dal Piaz, Reference Dal Piaz1966; Vialon, Reference Vialon1966; Compagnoni, Reference Compagnoni1974; Borghi et al. Reference Borghi, Compagnoni and Sandrone1996; Brouwer et al. Reference Brouwer, Vissers and Lamb2002; Le Bayon and Ballèvre, Reference Le Bayon and Ballèvre2006; Gasco et al. Reference Gasco, Gattiglio and Borghi2011; Figure 1), are deep-seated stacks of basement nappes that represent windows into the deeper continental crust involved in Alpine orogeny. Their basement largely consists of Palaeozoic continental crust reworked during the Alpine orogenic cycle. Classically they were regarded as having lost most of their former Permo–Mesozoic covers during Alpine subduction. Their early detached Carboniferous and Permo–Mesozoic cover was thought to have been fully incorporated into the more external and separate Briançonnais nappe stack (Briançonnais s.l. units of Figure 1; Schmid et al. Reference Schmid, Fügenschuh, Kissling and Schuster2004; Ballèvre et al. Reference Ballèvre, Camonin, Manzotti and Poujol2020; Michard et al. Reference Michard, Schmid, Lahfid, Ballèvre, Manzotti, Chopin, Iaccarino and Dana2022). However, some remnants of such cover sequences remained in place and potentially provide rare insights into the palaeogeographic and tectono-metamorphic evolution of the ICM (Michard, Reference Michard1967; Sturani, Reference Sturani1973, Reference Sturani1975). Additionally, slices of cover sequences pinched between basement rocks have frequently been used to trace the boundaries between distinct basement ‘units’ that in fact may delineate nappes (Henry et al. Reference Henry, Michard and Chopin1993; Michard et al. Reference Michard, Henry and Chopin1993, Reference Michard, Schmid, Lahfid, Ballèvre, Manzotti, Chopin, Iaccarino and Dana2022).
Tectonic sketch of the Western Alps, modified from Dana (Reference Dana2024). Abbreviations: DM = Dora-Maira, GP = Gran Paradiso, MR = Monte Rosa, PFT = Penninic Frontal Thrust, PFS = Periadriatic Fault System. Red box represents the study area of Figure 2.

Figure 1. Long description
A tectonic sketch of the Western Alps, modified from Dana (2024). The map includes several geological units such as Southern Alps Units, Salassic Units, Piemonte-Ligurian Units, Briançonnais Units, Valais-Subbriançonnais Units, and Helvetic-Dauphinois Units. Each unit is color-coded and labeled with abbreviations like DM for Dora-Maira, GP for Gran Paradiso, MR for Monte Rosa, PFT for Penninic Frontal Thrust, and PFS for Periadriatic Fault System. The map also highlights specific locations like Grenoble, Chamonix, Aosta, Torino, and Barcelonnette. A red box indicates the study area of Figure 2.
In the Dora-Maira Massif (Figure 1), remnants of the cover sequence occur in three different positions: (i) preserved close to tectonic contacts with the overlying ocean-derived Piemonte-Ligurian units (Caron, Reference Caron1977; Marthaler et al. Reference Marthaler, Fudral, Deville and Rampnoux1986); (ii) lenses or boudins pinched within large-scale fold structures (Wheeler, Reference Wheeler1991); and (iii) highly sheared slices between different basement units (Henry, Reference Henry1990; Henry et al. Reference Henry, Michard and Chopin1993). In the northern Dora-Maira Massif, discontinuous but clearly identifiable remnants of cover sequences are preserved at the top of the nappe stack, directly underlying the Piemonte-Ligurian oceanic units (Franchi, Reference Franchi1898; Vialon, Reference Vialon1966; Sturani, Reference Sturani1975; Marthaler et al. Reference Marthaler, Fudral, Deville and Rampnoux1986). In the Susa Valley, the metasedimentary covers have been mapped since the dawn of Alpine geology (Gastaldi, Reference Gastaldi1878; Franchi, Reference Franchi1898; Marthaler et al. Reference Marthaler, Fudral, Deville and Rampnoux1986; Fudral, Reference Fudral1998), and recent work has demonstrated their detachment from the underlying basement (Fudral, Reference Fudral1998; Balestro et al. Reference Balestro, Gattiglio, Roà and Festa2025, Reference Balestro, Roà, Bertok, Gattiglio, Ghignone, Groppo, van Schijndel and Festa2026).
South of the Susa valley, between the Chisone, Germanasca and Pellice valleys (Figure 2a), disrupted cover sequences crop out (Caron, Reference Caron1977; Nosenzo et al. Reference Nosenzo, Manzotti, Krona, Ballèvre and Poujol2024). Their deformation history and structural relationships with the basement remain poorly constrained. Nosenzo et al. (Reference Nosenzo, Manzotti, Krona, Ballèvre and Poujol2024) suggested that part of these remnants represents a distinct tectonic unit, the Serre Unit mainly consisting of monocyclic Permian orthogneiss and Permo–Mesozoic cover (labelled ‘SE’ in Figure 2a, located west of Roreto). The metamorphic peak of this Permo–Mesozoic sequence reaches ultra-high-pressure (UHP) conditions (Manzotti et al. Reference Manzotti, Schiavi, Ballèvre and Nosenzo2025b). Hence, this UHP imprint mirrors that recorded by basement-dominated units of the Dora-Maira Massif in the nearby areas (Manzotti et al. Reference Manzotti, Schiavi, Nosenzo, Pitra and Ballèvre2022, Reference Manzotti, Schiavi, Ballèvre and Nosenzo2025b ). In the Pellice Valley (southern area of Figure 2a), the same cover sequences are intensely folded and deformed together with the basement, challenging the view that these covers are completely detached from the polymetamorphic basement (Wheeler, Reference Wheeler1991; Dana et al. Reference Dana, De Cesari, Iaccarino, Montomoli, Corno, Rubatto and Carosi2026). Despite their importance regarding palaeogeographic reconstructions, the use of these monocyclic cover sequences for reconstructing the overall architecture of the Dora-Maira Massif requires critical re-evaluation.
(a) Simplified geological map of the study area (Western border of the Dora-Maira Massif between the Pellice and Chisone valleys), based on original field mapping for the Geological Map of Italy, Sheet “172 Pinerolo” and this work. The dashed lines indicate the tectonic contacts between the Serre, Muret and Chasteiran units as proposed by Nosenzo et al. (Reference Nosenzo, Manzotti, Krona, Ballèvre and Poujol2024) and re-interpreted in this work. Note that previous authors did not map cover rocks (i.e. their Serre Unit) in the Salza di Pinerolo area, and their Serre Unit terminates at Villa di Prali. La Fracho Shear Zone (LFSZ) of Nosenzo et al. (Reference Nosenzo, Manzotti, Krona, Ballèvre and Poujol2024) is drawn as a fault left of Col Clapier locality because, according to this study, this structure is a late fault (see main text). Red lines indicate nappe boundary as proposed in this study and partly in Nosenzo et al. (Reference Nosenzo, Manzotti, Krona, Ballèvre and Poujol2024). (b) Tentative reconstruction of the Permo–Mesozoic cover sequence, integrating our new field observations with those of Caron (Reference Caron1977), Marthaler et al. (Reference Marthaler, Fudral, Deville and Rampnoux1986) and Nosenzo et al. (Reference Nosenzo, Manzotti, Krona, Ballèvre and Poujol2024).

This study provides new structural observations (from mapping to the microtectonic scale), as well as petrological and geochronological data that prompt a re-evaluation of the architecture of the central–northern Dora-Maira Massif. Our results provide depositional age constraints on the cover sequences exposed between the upper Pellice and Chisone valleys. In addition, we reconstruct their structural evolution with particular emphasis on cover–basement relationships, and characterize the Alpine metamorphic evolution of three representative monocyclic micaschist samples. By integrating these results with existing literature datasets, we aim to: (i) refine the tectono-metamorphic evolution of the cover sequences and their associated basement, (ii) constrain the depositional ages of the garnet-chloritoid-bearing micaschist associated to the Mesozoic carbonate cover and (iii) offer a new interpretation of the overall architecture of the Dora-Maira Massif.
2. Geological setting
Palaeogeographically, the Dora-Maira Massif of the Western Alps (Figure 1) derives from the Briançonnais microcontinent, detached from the European margin, and it is cropping out below the remnants of the Piemonte-Ligurian Ocean (Dal Piaz et al. Reference Dal Piaz, Bistacchi and Massironi2003; Dal Piaz, Reference Dal Piaz2010; Schmid et al. Reference Schmid, Fügenschuh, Kissling and Schuster2004, Reference Schmid, Kissling, Dichl, van Hinsbergen and Molli2017; Lardeaux et al. Reference Lardeaux, Schwartz, Tricart, Paul, Guillot, Béthoux and Masson2006; Michard et al. Reference Michard, Schmid, Lahfid, Ballèvre, Manzotti, Chopin, Iaccarino and Dana2022). This so-called ‘massif’ mainly consists of a Pre-Permian Palaeozoic basement with remnants of a Permo–Mesozoic cover (Vialon, Reference Vialon1966; Michard, Reference Michard1967; Sandrone et al. Reference Sandrone, Cadoppi, Sacchi, Vialon, von Raumer and Neubauer1993; Gasco et al. Reference Gasco, Gattiglio and Borghi2011; Ballèvre et al. Reference Ballèvre, Camonin, Manzotti and Poujol2020) that form a complicated stack of tectonic units that are traditionally defined based on lithological composition and/or petrological estimates regarding Alpine peak P–T conditions.
The structurally lowest Pinerolo-Sanfront Unit (Figure 2a) is made up of mainly Silurian to Permian graphite-rich meta-sediments and Upper Carboniferous metaconglomerate (Novarese, Reference Novarese1895, Reference Novarese1896, Reference Novarese1898; Borghi et al. Reference Borghi, Cadoppi, Porro, Sacchi and Sandrone1984; Manzotti et al. Reference Manzotti, Ballèvre and Poujol2016; Carosi et al. Reference Carosi, Montomoli, Iaccarino, Dana, Corno, De Cesari and Spina2025), commonly correlated with sediments of the Zone Houllière (Vialon, Reference Vialon1966), deposited on a pre-Carboniferous basement (De Cesari et al. Reference De Cesari, Dana, Iaccarino, Montomoli, Corno, Rubatto and Carosi2026) and intruded by Permian meta-intrusive rocks (Bussy and Cadoppi, Reference Bussy and Cadoppi1996; Nosenzo et al. Reference Nosenzo, Manzotti, Krona, Ballèvre and Poujol2024; Dana et al. Reference Dana, De Cesari, Montomoli, Iaccarino, Corno, Rubatto and Carosi2025). The Alpine peak P–T conditions in this unit have been estimated at 1.4–1.6 GPa and 400–500°C (Avigad et al. Reference Avigad, Chopin and Le Bayon2003), 2.0–2.3 GPa and 500–515°C (Groppo et al. Reference Groppo, Ferrando, Gilio, Botta, Nosenzo, Balestro, Festa and Rolfo2019), 1.8–2.2 GPa and 500–520°C (Nerone et al. Reference Nerone, Petroccia, Caso, Dana and Maffeis2024) and 1.9–2.0 GPa and 500°C (Manzotti et al. Reference Manzotti, Schiavi, Piccoli, Westin and Ballèvre2026).
Tectonically above the Pinerolo-Sanfront Unit, there are several tectonic units, distinguished mainly on a petrological and/or lithological basis. Collectively they are often referred as ‘Basement Complex’ units, although they also contain slivers of monocyclic Permo–Mesozoic rocks (e.g. Chopin et al. Reference Chopin, Henry and Michard1991; Michard et al. Reference Michard, Henry and Chopin1993, Reference Michard, Henry, Chopin, Coleman and Wang1995; Bonnet et al. Reference Bonnet, Chopin, Locatelli, Kylander-Clark and Hacker2022). In the northern-central Dora-Maira the units above the Pinerolo-Sanfront Unit are the Chasteiran, Muret and Serre Units (Nosenzo et al. Reference Nosenzo, Manzotti, Krona, Ballèvre and Poujol2024 and references therein; Figure 2a). The Chasteiran unit is made of garnet-chloritoid-bearing micaschist (Manzotti et al. Reference Manzotti, Millonig, Gerdes, Whitehouse, Jeon, Poujol and Ballèvre2025a ), whereas the Muret Unit is dominated by albite-garnet-bearing paragneiss, garnet-chloritoid-bearing micaschist, minor metabasite, marble and orthogneiss with different protolith ages, from the Ediacaran to Permian (Sandrone et al. Reference Sandrone, Cordola and Fontan1986, Reference Sandrone, Cadoppi, Sacchi, Vialon, von Raumer and Neubauer1993; Bussy and Cadoppi, Reference Bussy and Cadoppi1996; Nosenzo et al. Reference Nosenzo, Manzotti, Poujol, Ballèvre and Langlade2022, Reference Nosenzo, Manzotti, Krona, Ballèvre and Poujol2024; Dana et al. Reference Dana, De Cesari, Montomoli, Iaccarino, Corno, Rubatto and Carosi2025). The Serre Unit was introduced as an independent tectonic unit by Manzotti et al. (Reference Manzotti, Schiavi, Nosenzo, Pitra and Ballèvre2022) and Nosenzo et al. (Reference Nosenzo, Manzotti, Krona, Ballèvre and Poujol2024). They proposed to redefine what was formerly interpreted as the Permo–Mesozoic cover sequence of the Muret Unit in terms of a separate unit. The sequence of the Serre Unit comprises Permian orthogneiss, garnet-chloritoid micaschist, as well as marble and calcschist that are remnants of the Mesozoic cover, and it structurally forms the top of the northern–central Dora-Maira Massif tectonic stack (Vialon, Reference Vialon1966; Caron, Reference Caron1977; Borghi et al. Reference Borghi, Cadoppi, Porro, Sacchi and Sandrone1984). The interpretation of Nosenzo et al. (Reference Nosenzo, Manzotti, Krona, Ballèvre and Poujol2024), i.e. the tectonic separation of the Serre Unit from the Muret Unit, is based on the identification of a brittle shear zone separating basement and cover in the Germanasca Valley.
In the southern part of the Dora-Maira Massif (south of the area of Figure 2a), the so-called ‘Basement Complex’, tectonically above the Pinerolo-Sanfront Unit and below the Dronero Unit, was subdivided according to a different scheme. There, a stack of five tectonic units was defined that are, from base to top, the San Chiaffredo, Brossasco-Isasca, Rocca Solei, Grimbassa and Ricordone Unit (Chopin et al. Reference Chopin, Henry and Michard1991; Henry et al. Reference Henry, Michard and Chopin1993; Michard et al. Reference Michard, Henry and Chopin1993; Compagnoni et al. Reference Compagnoni, Rolfo, Groppo, Hirajima and Turello2012; Groppo et al. Reference Groppo, Ferrando, Gilio, Botta, Nosenzo, Balestro, Festa and Rolfo2019, Reference Groppo, Ferrando, Tursi and Rolfo2025; Bonnet et al. Reference Bonnet, Chopin, Locatelli, Kylander-Clark and Hacker2022). Only the topmost Ricordone Unit can be directly correlated with the Muret Unit that is part of the stack of units shown in Figure 2a (Manzotti et al. Reference Manzotti, Schiavi, Nosenzo, Pitra and Ballèvre2022, Reference Manzotti, Schiavi, Ballèvre and Nosenzo2025b ). The different schemes of subdivisions and the lack of clear correlation criteria at the scale of the entire massif are confusing and consequently are highly debated issues (Petroccia et al. Reference Petroccia, Nerone, Maffeis, Caso, Boero, Ghignone and Groppo2025). Alpine metamorphism in most of the ‘Basement Complex’ units (Chasteiran, Muret, Serre, Ricordone and Rocca Solei Unit) reached coesite-chloritoid eclogite-facies conditions (Manzotti et al. Reference Manzotti, Schiavi, Nosenzo, Pitra and Ballèvre2022, Reference Manzotti, Schiavi, Ballèvre and Nosenzo2025b; Groppo et al. Reference Groppo, Ferrando, Tursi and Rolfo2025; Petroccia et al. Reference Petroccia, Nerone, Maffeis, Caso, Boero, Ghignone and Groppo2025), whereas coesite-kyanite conditions are documented in the Brossasco-Isasca Unit (Chopin et al. Reference Chopin, Henry and Michard1991; Compagnoni et al. Reference Compagnoni, Rolfo, Groppo, Hirajima and Turello2012; Groppo et al. Reference Groppo, Ferrando, Gilio, Botta, Nosenzo, Balestro, Festa and Rolfo2019; Bonnet et al. Reference Bonnet, Chopin, Locatelli, Kylander-Clark and Hacker2022).
3. Materials and methods
3.a. Fieldwork, structural analysis and microstructures
Field work and geological-structural mapping was carried out in the framework of the Geological Map of Italy ‘CARG’ project in an area comprised among the Chisone, Germanasca and Pellice valleys (Figure 2a), along the boundary between the Dora-Maira Massif and the overlying ocean-derived units. Lithological and structural data have been reported on the topographic map at the scale 1: 5000. Approximately 100 samples were collected and analysed in thin sections under the optical microscope. Ten representative samples were selected for the detailed analysis presented in this contribution (Table 1). Foliations and porphyroblast microstructures were classified following Passchier and Trouw (Reference Passchier and Trouw2005), whereas quartz microstructures were interpreted according to Stipp et al. (Reference Stipp, Stünitz, Heilbronner and Schmid2002 a, b). Mineral abbreviations follow Whitney and Evans (Reference Whitney and Evans2010), except Wm = white mica.
Summary of representative samples selected for this study

Table 1. Long description
A table detailing geological samples, their lithology, analyses, mineral phases, and localities. The table has 10 rows and 4 columns. Column headers are Sample, Lithology, Analyses, Mineral phases, and Locality. Row 1: Sample: 23PIN43, Lithology: Fontane micaschist, Analyses: Detrital geochronology, P-T modelling, RSCM, Mineral phases: Observed: Qz/Coe, Wm, Pg, Grt, Cld, Chl, Rt, Ilm, Tnt, Gr ± Ank Pseudomorph: Amp, Lws(?), Locality: 44°50′45.97″N 7°04′07.04″E. Row 2: Sample: DD20, Lithology: Fontane micaschist, Analyses: P-T modelling, RSCM, Mineral phases: Observed: Qz, Wm, Pg, Grt, Cld, Chl, Rt, Ilm, Tnt, Gr ± Ank Pseudomorph: Lws(?), Locality: 44°59′28.60″N 7°06′04.06″E. Row 3: Sample: SD5, Lithology: Calcschist, Analyses: RSCM, Mineral phases: Observed: Wm, Qz, Cal, Pg, Rt, Ilm, Gr, Locality: 44°48′52.76″N 7°05′37.82″E. Row 4: Sample: SC50, Lithology: Calcschist, Analyses: RSCM, Mineral phases: Observed: Wm, Qz, Cal, Pg, Rt, Ilm, Gr, Locality: 44°49′16.39″N 7°06′52.99″E. Row 5: Sample: SC52, Lithology: Calcschist, Analyses: RSCM, Mineral phases: Observed: Wm, Qz, Cal, Pg, Rt, Ilm, Gr, Locality: 44°50′23.60″N 7°07′00.29″E. Row 6: Sample: FONT2, Lithology: Fontane micaschist, Analyses: Detrital geochronology, THERMOCALC ave P-T, RSCM, Mineral phases: Observed: Qz/Coe, Wm, Pg, Grt, Cld, Chl, Rt, Ilm, Tnt, Gr ± Ank Pseudomorph: Amp, Lws(?), Locality: 44°55′46.44″N 7°03′39.92″E. Row 7: Sample: DD156, Lithology: Marble, Analyses: RSCM, Mineral phases: Observed: Cal, Wm, Qz, Rt, Gr, Locality: 44°56′37.81″N 7°04′01.15″E. Row 8: Sample: DD14X, Lithology: Marble, Analyses: RSCM, Mineral phases: Observed: Cal, Wm, Qz, Rt, Gr, Locality: 44°58′22.22″N 7°05′10.81″E. Row 9: Sample: DD22X, Lithology: Calcschist, Analyses: RSCM, Mineral phases: Observed: Wm, Qz, Cal, Pg, Rt, Ilm, Gr, Locality: 45°00′08.45″N 7°06′05.55″E. Row 10: Sample: DD46, Lithology: Dolomitic marble, Analyses: RSCM, Mineral phases: Observed: Wm, Qz, Cal/Dol, Pg, Rt, Ilm, Gr, Locality: 44°55′22.9″N 7°03′30.2″E. Row 11: Sample: DD97, Lithology: Garnet-chloritoid-bearing micaschist (from the basement), Analyses: Detrital geochronology, Mineral phases: Observed: Qz Wm, Pg, Grt, Cld, Chl, Rt, Ilm, Tnt Pseudomorph: Amp, Locality: 44°56′50.39″N 7°03′46.38″E.
3.b. Bulk rock, mineral chemistry, garnet and white mica zoning
The samples selected after optical microscopy observation (Table 1) were investigated using a JEOL JSM-IT300LV Scanning Electron Microscope (SEM), equipped with an energy-dispersive spectrometer (EDS) Energy 200 System and an SSD X-Act3 detector (Oxford Inca Energy), hosted at the Department of Earth Sciences, University of Torino. X-ray compositional maps of selected areas were acquired to estimate phase abundances. Operating conditions for EDS mapping were 15 kV accelerating voltage, specimen current of 100 nA, 30 ms dwell time and a pixel size of 7 μm. Mineral chemistry and X-ray maps of garnet and white mica were obtained using a JEOL 8200 Super Probe Electron Microprobe Analyzer (EPMA) equipped with five wavelength-dispersive spectrometers (WDS) hosted at the Department of Earth Sciences ‘A. Desio’, University of Milano. The analytical protocol consisted of (i) acquisition of X-ray compositional maps of garnet and white mica and (ii) quantitative point analyses. Elemental maps of garnet and white mica were acquired at 15 kV accelerating voltage, 100 nA beam current and 20 ms dwell time. Point analyses were performed at 15 kV and 20 nA. Quantitative mineral chemical analyses were recalculated through the software CalcMin (Brandelik, Reference Brandelik2009) to structural formulae and cation proportions. Structural formulas have been calculated based on 24 oxygens for garnet, 11 for white mica, 12 for chloritoid, 8 for plagioclase, 12.5 for epidote, 11 for biotite and 16 for chlorite. X-ray maps of representative thin-section areas and of garnet and white mica were processed using XMapTools v.4 (Lanari et al. Reference Lanari, Vidal, De Andrade, Dubacq, Lewin, Grosch and Schwartz2014, Reference Lanari, Vho, Bovay, Airaghi and Centrella2019). The obtained mineral modes were subsequently combined with mineral chemical data to estimate bulk-rock compositions using RockMaker (Büttner, Reference Büttner2012).
3.c. Raman spectroscopy
Raman microspectroscopy was used to identify coesite relics in the studied samples. Analyses were performed using a Horiba Jobin Yvon LabRam HRVIS Raman system at the Department of Earth Sciences, University of Torino. Before each measurement session, the spectrometer was calibrated using the 520.5 cm−1 peaks of a silicon standard. Spectra were acquired by a beam spot of approximately 1 μm diameter with a green Nd 532.06 nm laser source at 80 mW, corresponding to 2–4 mW at the sample surface, with a 100×magnification.
3.d. P–T estimates, thermodynamic modelling and TRSCM
To reconstruct the P–T history of two selected samples (23PIN43 and DD20), equilibrium assemblage diagrams were computed with PERPLE_X (Connolly, Reference Connolly2005) over 0.5–3.0 GPa and 350–650°C, in the MnNKCFMASHT (SiO2–TiO2–Al2O3–MgO–MnO–FeO–CaO–Na2O–K2O–H2O) system. The thermodynamic dataset of Holland and Powell (Reference Holland and Powell1998, updated 2002) for minerals and H2O (model CORK: Holland and Powell, Reference Holland and Powell1991) was used for all calculations. Solid solution models and excluded end-member phases are listed in Table S2 of Supplementary Material 1. Fe2O3 was neglected given the absence of magnetite and hematite, the presence of graphite and rutile/ilmenite and negligible Fe3+ contents in silicates from EPMA analyses. For each sample, three diagrams were computed to account for garnet core, mantle and rim fractionation of the effective bulk composition (Section 2.3) and contoured with smoothed isopleths of garnet composition, XMg in chloritoid and Si4+ in potassic white mica. Because FONT2 shares the same mapped lithology, mineral assemblage and petrography as 23PIN43, comparable metamorphic conditions can be inferred for both samples. Peak P–T estimates for FONT2 were obtained with the THERMOCALC average P–T routine (Powell and Holland, Reference Powell and Holland1994, Reference Powell and Holland2008), using the same thermodynamic database and mineral end-member activities calculated with A-X (downloaded from Tim Holland webpage). Independent peak temperature estimates were obtained by Raman spectroscopy on carbonaceous material (RSCM; Beyssac et al. Reference Beyssac, Goffé, Chopin and Rouzaud2002 a, b) on nine samples using the instrument described in Section 2.4. For each sample, at least 10 spectra were acquired (15–40 s acquisition time, three repetitions), and peak position, band area and FWHM were fitted with Fityk 1.3.1 following Beyssac et al. (Reference Beyssac, Goffé, Chopin and Rouzaud2002a). Temperatures were derived from the calibration of Aoya et al. (Reference Aoya, Kouketsu, Endo, Shimizu, Mizukami, Nakamura and Wallis2010), appropriate for the 532.06 nm laser used.
3.e. U-Pb zircon geochronology
Zircon grains were separated with heavy liquids, handpicked and mounted on a one-inch epoxy resin puck, subsequently polished. Cathodoluminescence imaging was carried out with a ZEISS EVO50 hosted at the Institute for Geology at the University of Bern (Switzerland). U-Pb geochronology of zircon was performed with a Resonetics RESOlutionSE 193 nm excimer laser system coupled to an Agilent 7900 quadrupole Inductively Coupled Plasma Mass Spectrometer (ICP-MS) at the University of Bern. The ICP-MS was tuned for low oxide production (ThO/Th < 0.2%) and a Th/U ratio close to unity (Th/U > 97%). Analyses were performed with a 25 μm spot size with pre-ablation at 30 µm, at a repetition rate of 2.5 Hz and an energy density on the sample of 5 J/cm2. Temora zircon (Black et al. Reference Black, Kamo, Allen, Aleinikoff, Davis, Korsch and Foudoulis2003) was used as a primary reference and yielded a Concordia age of 416.1 ± 1.2 Ma (95% c.i.; mean squared weighted deviation (MSWD) of concordance + equivalence = 0.57; n = 34). The Plešovice (Sláma et al. Reference Sláma, Košler, Condon, Crowley, Gerdes, Hanchar and Whitehouse2008) and 91 500 zircon (Wiedenbeck et al. Reference Wiedenbeck, Alle, Corfu, Griffin, Meier, Oberli and Spiegel1995) were used as secondary reference materials and yielded Concordia ages of 344.6 ± 1.1 Ma (MSWD = 1.2; n = 20) and 1061.9 ± 3.3 Ma (MSWD = 0.56; n = 21), respectively. The accuracy of the Plešovice result limits the precision of the geochronology in this session to 2.1%, an uncertainty that is propagated to the samples final age. Raw data were processed using the software Iolite v4 (Paton et al. Reference Paton, Woodhead, Hellstrom, Hergt, Greig and Maas2010, Reference Paton, Hellstrom, Paul, Woodhead and Hergt2011) running the DRS VizualAge_UcomPbine (Chew et al. Reference Chew, Petrus and Kamber2014). No common Pb correction was applied to the data of either reference materials or samples. Only dates that are ≥90% concordant were used for plotting and age calculations. Concordia ages, diagrams and kernel density estimate (KDE) plots were generated with IsoplotR (Vermeesch, Reference Vermeesch2018). KDEs were plotted using a combination of 207Pb/206Pb and 206Pb/238U dates with a threshold of 1000 Ma (assessed on 206Pb/238U). MSWDs are given for concordance plus equivalence, and absolute uncertainties are given as 2σ.
4. Field geology of the study area
The study area, located along the western edge of the Dora-Maira Massif, extends from the Pellice (to the South) to the Chisone valley (to the North), including the Germanasca valley in between (Figure 2a). In this area, a belt of Permian–Mesozoic rocks crops out discontinuously (Figure 2b).
4.a. The basement and the cover sequence
The polycyclic basement of the Dora-Maira ‘Basement Complex’, with the exception of the meta-intrusive bodies, is interpreted as deriving from a pelitic to psammitic metasedimentary sequence spanning from Precambrian to Devonian (e.g. Nosenzo et al. Reference Nosenzo, Manzotti, Krona, Ballèvre and Poujol2024; Carosi et al. Reference Carosi, Montomoli, Iaccarino, Dana, Corno, De Cesari and Spina2025; Dana et al. Reference Dana, De Cesari, Montomoli, Iaccarino, Corno, Rubatto and Carosi2025), which was metamorphosed into garnet-and chloritoid-bearing micaschist and paragneiss. Minor carbonate and organic rich-siliceous sedimentary intercalations are preserved as polycyclic marble (Cadoppi et al. Reference Cadoppi, Camanni, Balestro and Perrone2016; Vola et al. Reference Vola, Ardit, Frijia, Cavallo, Natali, Mion, Lugli and Primavori2022) and black-quartzite. Notably, garnets in some micaschist and meta-mafic rocks of the polycyclic basement has recorded more than one orogenic cycle (Sandrone and Borghi, Reference Sandrone and Borghi1992, Nosenzo et al. Reference Nosenzo, Manzotti, Poujol, Ballèvre and Langlade2022, Reference Nosenzo, Manzotti and Robyr2023). The metasedimentary monocyclic cover overlying the basement in the study area (Figure 2b) is intensely deformed and highly dismembered, showing clear evidence of superposed folding and multiple levels of décollement along weak horizons.
This monocyclic sequence was described in detail by Caron (Reference Caron1977), who referred to it as the Séries de Sellerie–Fontane after the two-type localities (Figure 2a). Notably, calcschists and impure marbles cropping out in the Subiasco–Pellice Valley (Figure 2a) were previously attributed to the Piemonte-Ligurian units by some authors (e.g. Deville et al. Reference Deville, Fudral, Lagabrielle, Marthaler and Sartori1992; Angiboust and Glodny, Reference Angiboust and Glodny2020). However, our observations support the interpretation originally proposed by Wheeler (Reference Wheeler1991), namely that these rocks belong to the Mesozoic cover of the Dora-Maira Massif. Unlike the calcschists of the Piemonte-Ligurian units, they are neither associated with meta-ophiolitic rocks nor contain ophiolitic-derived detritus. Instead, the calcschists are characterized by continental-derived detritus, including quartz and rare dolostone pebbles. Where associated with marbles, the latter contain detrital components and display lithological features comparable to the Upper Jurassic Briançonnais marbles (Lemoine, Reference Lemoine1961; Lemoine et al. Reference Bourbon, de Graciansky, Rudkiewicz, Megard-Galli, Lemoine, Bas, Arnaud-Vanneau, Arnaud, Dumont, Gidon and Tricart1986; Gidon et al. Reference Gidon, Kerckhove, Michard, Tricart, Gotteland, Gout, Leblanc, Lefèvre, Le Gernic, Mégard-Galli and Michel-Noël1994; Michard and Henry, Reference Michard and Henry1988). Altogether, these lithological characteristics indicate a Briançonnais affinity and support their attribution to the Mesozoic cover of the Dora-Maira Massif rather than to the Piemonte-Ligurian units. This interpretation is further supported by comparison with the calcschists exposed in the mixed Cima Lubin Shear Zone of the southern Dora-Maira, which are intimately associated with mafic and ophiolitic rocks (Michard et al. Reference Michard, Schmid, Lahfid, Ballèvre, Manzotti, Chopin, Iaccarino and Dana2022; Dana et al. Reference Dana, De Cesari, Montomoli, Iaccarino, Corno, Rubatto and Carosi2025; Figure 2a). Due to the strong deformation, reconstructing the original thicknesses and true lithostratigraphic relationships among the various lithologies is challenging. Nevertheless, by comparison with similar sequences in the neighbouring valleys, the following tentative, lithostratigraphic succession can be proposed, from the bottom to the top (Figure 2b):
-
(i) The felsic Luserna orthogneiss (dated as Permian in the area around Col Clapier by Nosenzo et al. Reference Nosenzo, Manzotti, Krona, Ballèvre and Poujol2024; at Colle Giulian by Dana et al. Reference Dana, De Cesari, Montomoli, Iaccarino, Corno, Rubatto and Carosi2025 and in the Susa Valley by Balestro et al. Reference Balestro, Roà, Bertok, Gattiglio, Ghignone, Groppo, van Schijndel and Festa2026) is usually the first rock-type occurring at the top of the polycyclic basement. Based on their frequent association with metasediments and distinctive structural position, they have been interpreted as the metamorphosed and deformed remnants of an original volcanic and/or sub-volcanic sequence associated with very shallow intrusions (Vialon, Reference Vialon1966; Wheeler, Reference Wheeler1991; Nosenzo et al. Reference Nosenzo, Manzotti, Krona, Ballèvre and Poujol2024; Dana et al. Reference Dana, De Cesari, Montomoli, Iaccarino, Corno, Rubatto and Carosi2025). They are associated with quartz-phengite-bearing micaschist (‘silvery micaschist’; Bussy and Cadoppi, Reference Bussy and Cadoppi1996) interpreted as the product of shearing and metasomatism of the orthogneiss (Cadoppi, Reference Cadoppi1990; Compagnoni et al. Reference Compagnoni, Crisci and Sandrone1983) or as original sedimentary levels (Vialon, Reference Vialon1966).
-
(ii) Quartzite: they are rare, generally thin (<5 m) and have been sporadically observed only in a few localities (e.g. Col Clapier). Quartzite usually overlies the Luserna orthogneiss.
-
(iii) Micaschist with sigmoidal lenses, rich in chloritoid, white mica and ±garnet (and commonly associated with intercalated layers and pods of ankerite), here referred to as Fontane micaschist. It frequently occurs in spatial association with the Luserna orthogneiss and calcschist. However, the stratigraphic position of this lithology relative to the Luserna orthogneiss remains uncertain (Figure 3a–c).
Figure 3.(a) Fontane micaschist (sample DD20), characterized by sigmoidal lenses composed of chloritoid ± white mica and ankerite pods. (b) Detail of a Fontane micaschist with small orange ankerite pods. (c) Association between Fontane micaschist and Luserna orthogneiss; garnet-chloritoid-bearing micaschist are folded together with the orthogneiss in thin, centimetre-scale layers. (d) Typical meta-dolostone showing alternating whitish and bluish layers. (e) Grey-blue sandy marble containing deformed blue clasts (arrows) within a meta-calcarenitic matrix, wrapped by the main foliation. (f) Folded and deformed cover sequence in the Subiasco area (Pellice Valley area), preserved as a lens pinched within the core of a synformal structure. (g) Omission of Triassic–Jurassic carbonate-bearing rocks, with calcschist directly in contact with Fontane micaschist.

Figure 3. Long description
Panel A: A photo of a rock formation labeled Fontane micaschist with sigmoidal lenses composed of chloritoid and white mica, and ankerite pods. Panel B: A close-up photo of Fontane micaschist showing small orange ankerite pods. Panel C: A photo showing the association between Fontane micaschist and Luserna orthogneiss, with garnet-chloritoid-bearing micaschist folded together with the orthogneiss in thin, centimeter-scale layers. Panel D: A photo of typical meta-dolostone displaying alternating whitish and bluish layers. Panel E: A photo of grey-blue sandy marble containing deformed blue clasts within a meta-calcarenitic matrix, wrapped by the main foliation. Panel F: A photo of a folded and deformed cover sequence in the Subiasco area, preserved as a lens pinched within the core of a synformal structure. Panel G: A photo showing the omission of Triassic-Jurassic carbonate-bearing rocks, with calcschist directly in contact with Fontane micaschist.
-
(iv) Meta-dolostone and dolomitic marble: they commonly exhibit a banding of whitish and blueish layers (Figure 3d), with variable proportions of dolomite and calcite (Vialon, Reference Vialon1966; Nosenzo et al. Reference Nosenzo, Manzotti, Krona, Ballèvre and Poujol2024). Their thickness can be up to 15–20 m where in contact with quartzite or Fontane micaschist. The equivalent of these rocks in the Susa Valley (northern Dora-Maira) has been dated by Franchi (Reference Franchi1911) to the Middle-Upper Triassic on the basis of its fossils content.
-
(v) Grey-blue sandy marble (up to 20–30 m thick): this lithotype is characterized by a lower portion containing centimetre-scale bluish dolomite lenses and deformed clasts within a meta-calcarenitic matrix with detrital quartz grains, all wrapped by the main foliation (Figure 3e). It can be tentatively attributed to the Middle–Late Jurassic based on correlation with similar rocks from the Briançonnais units (Lemoine, Reference Lemoine1967; Dana et al. Reference Dana, Iaccarino, Schmid, Petroccia and Michard2023; Pantet et al. Reference Pantet, Epard, Masson, Baumgartner-Mora, Baumgartner and Baumgartner2023; Nosenzo et al. Reference Nosenzo, Manzotti, Krona, Ballèvre and Poujol2024).
-
(vi) Calcschist and grey impure marble: these rocks are generally richer in siliciclastic components and may contain meta-dolostone clasts. They occur in contact with all the previously described lithologies, whereas marble and meta-dolostone progressively thin southwards and disappear towards the Pellice Valley, except for a few metre-thick slices. In the Susa Valley, equivalent lithologies were dated to the Upper Cretaceous by Marthaler et al. (Reference Marthaler, Fudral, Deville and Rampnoux1986) based on foraminifera, whereas palynological data from our study area indicate a Lower Cretaceous (Aptian–Albian) to Upper Cretaceous age (Spina A., pers. comm.).

The Permo–Mesozoic sequence is deformed and dismembered (Figure 3f, g), due to multiple décollement levels (Figure 2b) and/or an original unconformity between younger (calcschists) and older rocks. In some localities, carbonate-bearing formations are partially or entirely absent (Figure 3g). Because the age of the Fontane micaschist from the cover sequence of the Dora-Maira Massif remains unconstrained, two samples (23PIN43, FONT2; Figure 2a) were selected for detrital zircon geochronology. In addition, one garnet-chloritoid-bearing micaschist sample from the basement (DD97) was analysed for comparison. Two samples of Fontane micaschist (23PIN43, DD20) were selected for thermodynamic modelling using PERPLE_X, whereas one sample (FONT2) was used to estimate average P–T conditions with THERMOCALC. Finally, six calcschist and marble samples (Table 1) from the cover sequence were collected for RSCM analyses following the approach of Beyssac et al. (Reference Beyssac, Goffé, Chopin and Rouzaud2002 a, b).
4.b. Structural analysis
Deformation in poly-and monocyclic rocks is strongly heterogeneous, and different fabrics are preserved in different areas depending on lithology and structural level. Overall, four distinct deformation phases have been recognized affecting both the basement and the cover. The earliest Alpine deformation event (D1) is represented by relics of a continuous S1 foliation, locally preserved within microlithons of the S2 foliation in garnet-chloritoid-bearing micaschist (Section 5) and orthogneiss of both the basement and cover. The D2 deformation phase is associated with strong strain partitioning. In some domains, D2 produced E-W-trending tight to isoclinal folds (F2), generally parallel to the stretching lineation. These folds affecting both cover and basement rocks are only locally preserved (Figure 4a) and are associated with the development of a spaced S2 foliation. In other domains, D2 is characterized by the development of a mylonitic fabric associated with the S2 foliation and characterized by a dominant top-to-the-SW sense of shear (in present day orientation). This mylonitic fabric is well developed in garnet-chloritoid-bearing micaschist (including both the Fontane micaschist and lithologically similar, ankerite-free, basement micaschist), orthogneiss and locally in marble (Figure 4b). A third deformation phase (D3) generated open to isoclinal NW-SE-trending folds (Figure 4c, d). D3 is associated with the development of an S3 crenulation cleavage, accompanied by recrystallization of chlorite, muscovite and albite. In most of the micaschist and paragneiss of the basement, as well as in impure marble and calcschist, S3 commonly represents the dominant penetrative fabric (Figure 4c). Type III interference patterns (Ramsay, Reference Ramsay1967) resulting from superposed D2 and D3 folding are commonly observed. D3 structures were subsequently overprinted by a fourth deformation phase (D4), interpreted as a doming event. D4 produced open, upright N-S-trending F4 folds at scales ranging from centimetric to hectometric. This late event caused progressive steepening and bending of the main foliation towards the tectonic contact separating the Dora-Maira Massif from the overlying Piemonte-Ligurian units.
Meso-scale structures in the study area. (a) F2 fold affecting the contact between Fontane micaschist and dolomitic marble (S1), with S2 as axial planar foliation. (b) Top-to-the-SW, σ-type rotated porphyroclast associated with the S2 main foliation in a mylonitic sandy marble of the cover sequence. (c) F3 folds in impure marble; a local S3 crenulation cleavage is visible. (d) Decameter-scale F3 folds affecting the Luserna orthogneiss and adjacent calcschists in the Subiasco area (Pellice valley in Figure 2a). (e) Cargneules/tectonic breccia layer underlying the Triassic marble sequence. (f) Basement–cover (represented by Luserna orthogneiss and calcschist) interface in the Subiasco Valley, a tributary of the Pellice river, transposed towards parallelism to S2/S3.

Figure 4. Long description
Panel A: A photo showing a geological formation with layers of Fontane micaschist and meta-dolostone. A hammer is placed for scale. Panel B: A photo displaying a mylonitic sandy marble with top-to-the-SW sigma-type rotated porphyroclasts. Panel C: A close-up photo of F3 folds in impure marble, with a local S3 crenulation cleavage visible. Panel D: A landscape photo showing decameter-scale F3 folds affecting the Luserna orthogneiss and adjacent calcschists in the Subiasco area. Panel E: A photo of a cargneules/tectonic breccia layer underlying the Triassic marble sequence. Panel F: A photo of the basement-cover interface in the Subiasco Valley, with Luserna orthogneiss and calcschist transposed towards parallelism to S2/S3.
4.c. Basement–cover relationships
The Permo–Mesozoic cover of the Dora-Maira Massif is commonly detached from the underlying polycyclic basement and are therefore regarded as ‘para-autochthonous’ (Borghi et al. Reference Borghi, Cadoppi, Porro, Sacchi and Sandrone1984; Fudral, Reference Fudral1998; Nosenzo et al. Reference Nosenzo, Manzotti, Krona, Ballèvre and Poujol2024; Balestro et al. Reference Balestro, Gattiglio, Roà and Festa2025). In the Germanasca and Chisone valleys, the basement–cover interface is locally marked by high-strain zones formed under ductile-to-brittle transition conditions, or by levels of cargneules and tectonic breccias (Figure 4e). Where exposed, this contact appears as a relatively young shear zone that acted as a detachment level after D3 folding, as it cross-cuts pre-existing D3 structures. However, available data do not allow us to precisely constrain the magnitude of displacement along this interface, nor to determine whether it represents a late disharmonic feature or the reactivation of an older shear zone that originally accommodated significant earlier movements. Within this framework, Nosenzo et al. (Reference Nosenzo, Manzotti, Krona, Ballèvre and Poujol2024) identified what they referred to as ‘La Fracho Shear Zone’, a ductile-to-brittle top-NW shear zone interpreted as the basal tectonic contact separating the Permo–Mesozoic cover (their Serre Unit) from the basement (Muret Unit) in the Germanasca valley (Figure 2a). Our field mapping (Figure 2a), however, significantly differs from previous studies because cover rocks occur both in the footwall and in the hangingwall of this structure (Salza di Pinerolo area, Figure 2a). Moreover, our observations show that the cover rocks found in the Serre Unit of Nosenzo et al. (Reference Nosenzo, Manzotti, Krona, Ballèvre and Poujol2024) also crop out within the Muret Unit in the area further south. Nosenzo et al. (Reference Nosenzo, Manzotti, Krona, Ballèvre and Poujol2024) extended their mapping of the Serre Unit only as far as Villa di Prali (Figure 2a), but sequences of Permo–Mesozoic cover rocks are present also further south, where no such clear tectonic contact as the ‘La Fracho Shear Zone’ between cover and basement is observed. These observations suggest that La Fracho Shear Zone only locally coincides with the basement–cover interface, implying that it represents a relatively late structure that cross-cuts a pre-existing tectonic pile that even includes the Piemonte-Ligurian units according to our observation. Therefore, it does not represent a nappe divider between a Muret and Serre Unit.
In the southern part of the study area (Pellice valley, southern part of Figure 2a), remnants of the meta-sedimentary cover, mainly calcschist, marble and Fontane micaschist, are tightly folded together with polycyclic basement lithologies attributed to the Muret Unit, into which the Permo–Mesozoic sequence is folded by D2 and D3 structures (Figures 2a, 3f, 4d). In this southern area, the basement–cover interface is parallel to the S2 foliation (Figure 4f) and shows no evidence of significant strain localization, excluding any substantial late reactivation of the contact. This S2 foliation is folded by metric to decametric F3 folds-oriented NW-SE, representing the dominant structural style of the area (Figure 4d). Therefore, as the main planar elements seen in this southern area of the basement–cover interface (i.e., both S2 and S3 foliations) are recognized in basement and cover without any discontinuity of fabric, the study area records a polyphase Alpine deformation history of both basement and cover, with local detachment occurring only during very late ductile-to-brittle stages such as observed in the north by Nosenzo et al. (Reference Nosenzo, Manzotti, Krona, Ballèvre and Poujol2024).
5. Microstructures and petrography of the studied samples
The studied metapelites (23PIN43, DD20, FONT2) are part of the Fontane micaschist and display broadly similar modal proportions of minerals. Chloritoid typically occurs in amounts of ∼3–4 vol%, whereas garnet is more abundant, reaching ∼7–10 vol%. Sample FONT2 shows petrographic and microstructural features comparable with those observed in sample 23PIN43 and is therefore not described in detail. In contrast, sample DD20 differs from the other two in that pseudomorphs after amphibole are completely absent. Mineral growth–metamorphism relationship diagrams are presented in Figure S1 of Supplementary Material 1.
5.a. Sample 23PIN43 (Colle Giulian, Germanasca valley)
In sample 23PIN43 (Table 1; Figure 5a; modal proportions in Supplementary Material 1), two distinct foliations are recognized. An early S1 foliation defined by quartz, rutile, chloritoid (Cld 1) and white mica (Wm 1) is locally preserved within microlithons (Figure 5b) of the main S2 foliation. Chloritoid occurring within the microlithons locally contains inclusions of graphite, rutile and white mica, suggesting growth during the early deformation stages.
Mineral phases and petrography of sample 23PIN43. (a) Processed X-ray map showing the mineral assemblage (h/G = hole/graphite). (b) Relict of S1 foliation in a microlithon of the S2 foliation defined by white mica (Wm 1) (XPL = Crossed Polarized Light). (c) Aggregate of chloritoid (Cld 2) and white mica (Wm 2) defining the main S2 foliation, wrapping around S1 chloritoid (Cld 1) (PPL= Plane Polarized Light). (d) Particular growth zoning in garnet highlighted by inclusions. (e) Aggregates of chlorite and albite, interpreted as pseudomorph after sodic-amphibole (PPL).

Figure 5. Long description
Panel A: Processed X-ray map displaying various mineral phases including garnet, quartz, plagioclase, albite, chlorite, chloritoid, rutile, ilmenite, titanite, and holes/graphite. Panel B: Microlithon showing relict S1 foliation defined by white mica under cross-polarized light. Panel C: Aggregate of chloritoid and white mica defining the main S2 foliation, wrapping around S1 chloritoid under plane polarized light. Panel D: Garnet with particular growth zoning highlighted by inclusions. Panel E: Aggregates of chlorite and albite, interpreted as pseudomorph after sodic-amphibole under plane polarized light.
The S2 foliation is a mylonitic fabric defined by millimetre-thick layers of either chloritoid (Cld 2) + rutile + white mica (Wm 2) or white mica (Wm 2) + paragonite + rutile + graphite, which are parallel to stretched quartz-rich lenses (Figure 5a, c). The S2 foliation wraps around garnet porphyroblasts. Microstructural relationships indicate that only the outer rims of the garnet are syn-kinematic with respect to D2 and grew contemporaneously with the development of the S2 foliation, whereas the inner portions predate D2. Garnet porphyroblasts range from 0.5 to 5 mm in diameter (Figure 5a). Inclusions consist of quartz, coesite, rutile, zircon, chloritoid, paragonite ± epidote (possibly replacing lawsonite) and white mica. Their spatial distribution within garnet records a protracted growth history (Figure 5d). The garnet cores (Grt 1a) represent the earliest growth stage and contain mainly quartz, paragonite (possibly replacing lawsonite) and white mica inclusions, indicating growth under prograde metamorphic conditions during the initial stages of D1. Mantle domains (Grt 1b) are characterized by the occurrence of coesite, white mica, rutile and rare chloritoid inclusions, recording continued garnet growth during D1 and the attainment of peak UHP conditions. In contrast, the outer rims (Grt 2) mainly containing quartz and white mica are interpreted to have formed during D2, syn-kinematically with the development of the S2 foliation. Accordingly, coesite inclusions are preferentially restricted to the Grt 1b mantle domains (see also below), whereas quartz, white mica, rutile and zircon occur across multiple garnet domains, reflecting their stability or recrystallization during different stages of the metamorphic evolution. Rutile occurs both in the matrix and as inclusions in garnet and chloritoid. Rutile grains in the matrix can display ilmenite coronas, suggesting partial retrograde re-equilibration. Quartz is recrystallized by grain–boundary migration overprinted by late bulgingReference Stipp, Stünitz, Heilbronner and Schmid.
Post-D2 mineral growth is associated predominantly to static mineral replacement and to brittle deformation. Chlorite and albite locally replace the rim of the garnet porphyroblasts, whose fractures are locally filled by chlorite ± white mica. Chlorite commonly grows statically overprinting the S2 foliation. Rhomboidal domains, composed of post-D2 fine-grained chlorite and albite aggregates, are interpreted as pseudomorphs replacing sodic amphibole that grew along the S2 foliation (Figure 5e). Some of the albite may also derive from the replacement of primary Na-rich clinopyroxene during decompression and subsequent retrograde metamorphism. Although Na-rich clinopyroxene is not preserved in the studied sample, its absence is not unexpected, as this phase is rarely preserved in high-pressure metapelites despite being commonly predicted by phase equilibria modelling (see Manzotti et al. Reference Manzotti, Millonig, Gerdes, Whitehouse, Jeon, Poujol and Ballèvre2025 a). In this sample, a well-developed S3 foliation does not occur.
5.b. Sample DD20 (Serre, Chisone valley)
In sample DD20 (Table 1; Figure 6a; modal proportions in Supplementary Material 1), two distinct foliations can be identified. The S1 foliation, defined by chloritoid (Cld 1) and white mica (Wm 1), is again locally observed within microlithons of the main S2 foliation (Figure 6b). The D2 is associated with the development of the main mylonitic foliation (S2) defined by the shape preferred orientation of chloritoid (Cld 2), white mica (Wm 2), paragonite and millimetre-thick layers of either chloritoid + graphite + rutile or white mica + rutile + graphite, parallel to stretched quartz-rich lenses (Figure 6d). As in the previous sample, S2 wraps around garnet porphyroblasts with strain shadows containing mainly quartz (Figure 6e). Garnet inclusions consist of quartz, white mica, paragonite, zircon and rutile. Paragonite ± epidote inclusions, possibly replacing former lawsonite, are preferentially observed in the garnet core (Grt 1a). In contrast, zircon, rutile and white mica inclusions are distributed throughout the garnet domains. Quartz inclusions show a more heterogeneous distribution as they are particularly concentrated at the onset of the mantle domain (Grt 1b), where they form interconnected clusters along a network of fractures (former coesite?). Chloritoid ranges from 0.1 to 1 mm in size. Most chloritoid crystals are zoned, with a lighter-blue core and a darker-blue rim, suggesting a Mg-richer core (Cld 1) and a Mg-poorer rim (Cld 2). Inclusions in chloritoid consist of quartz, white mica, rutile and graphite. Quartz is recrystallized by grain–boundary migration overprinted by late bulgingReference Stipp, Stünitz, Heilbronner and Schmid. Post-D2 mineral growth is characterized by predominantly static mineral replacement by chlorite and albite. As in sample 23PIN43, albite may also derive from the breakdown of Na-rich clinopyroxene during decompression and retrograde evolution, although this phase is not preserved in the studied sample. Chloritoid crystals occur often as fractured and partly dissolved at rims. Fractures in chloritoid are locally filled by chlorite ± white mica. Garnet porphyroblasts are replaced by chlorite along their outer edges and (together with quartz) along fractures. Rutile in the matrix displays dark ilmenite coronas.
Mineral phases and petrography of sample DD20A. (a) Processed X-ray map showing the mineral assemblage (h/G = hole or graphite). (b) Relict of S1 foliation within a microlithon of the S2 foliation (XPL). (c) Relicts of chloritoid (Cld 1) and white mica (Wm 1) defining the S1 foliation, in a microlithon of the S2 foliation (PPL). (d) Aggregates of chloritoid (Cld 2) and white mica (Wm 2), defining the main S2 foliation in a quartz-rich domain (PPL). (e) Garnet wrapped by the S2 main foliation, with strain shadows mainly made of quartz (PPL).

6. Mineral chemistry and garnet zoning
6.a. Sample 23PIN43 (Colle Giulian, Germanasca valley)
Garnet in this sample is compositionally zoned (Figure 7), with distinct core (Grt 1a), mantle (Grt 1b) and rim (Grt 2) domains. From core to mantle, garnet shows a slight increase in XPrp (0.05–0.06 to 0.07–0.08) and XAlm (0.79 to 0.80–0.83), followed by a decrease in the rim (Figure 7, Table S1 in Supplementary Material 2, Figure S2 in Supplementary Material 1). XGrs decreases slightly from core to mantle (0.10–0.09 to 0.07–0.08) and XSps from 0.05–0.06 to 0.03–0.02, whereas the rim is strongly enriched in grossular (XGrs = 0.12–0.35; Figure 8; Figure S2). White mica also displays clear zoning, particularly evident in X-ray compositional maps (Figure 8a, b). Si4+, Fe and Mg decrease towards the crystal edges (Figure 8a, Table 2), whereas Ti and Na increase (Figure 8b) in the same direction. White mica cores (Wm 1) are characterized by Si4+ a.p.f.u. contents of 3.50–3.65 (Figure 8c). The rims (Wm 2), in equilibrium with the main foliation, have slightly lower Si4+ contents (3.45–3.50 a.p.f.u.). Plagioclase is close to pure albite (XAn = 0.01). Chloritoid aligned along the main S2 foliation (Cld 2) has Mg-rich cores (XMg = 0.19–0.20) and Fe-rich rims (XMg = 0.10–0.17). Monocrystalline inclusions of chloritoid within garnet core (Cld 1) have XMg = 0.19–0.20. Paragonite, frequently associated with chloritoid, has XNa = 0.90–0.95. Chlorite has XMg = 0.34–0.38. It is worth noting that, although white mica and chloritoid occur in different microstructural positions (e.g. related to S1 or S2), their compositional zoning patterns are generally similar. This reflects the fact that many crystals were reoriented during the subsequent deformation event (D2) and continued to grow from the same pre-existing cores. Consequently, minerals associated with S2 commonly preserve inherited D1 cores, while developing thicker syn-D2 rims.
X-ray map (WDS = Wavelength-Dispersive Spectroscopy) of garnet grains from samples 23PIN43, DD20 and FONT2, showing zoning for Fe, Ca, Mn and Mg. The interface between garnet core and rim is regular, suggesting limited or no dissolution of garnet core before the growth of garnet rim. Mineral inclusions are shown with different symbols in the Mg map. Abbreviations: R = Rim (Grt 2), M = Mantle (Grt 1b), C = Core (Grt 1a). Electron Probe Micro-Analyzer (EPMA) spot analyses are reported in Supplementary Material 2.

Figure 7. Long description
Panel 23PIN43: Four X-ray maps display the distribution of Fe, Ca, Mn, and Mg in garnet grains. The Fe map shows a clear distinction between the core and rim regions. The Ca map highlights areas with higher calcium concentration. The Mn map indicates manganese distribution, and the Mg map shows magnesium distribution with mineral inclusions marked by different symbols. Panel DD20: Similar X-ray maps for Fe, Ca, Mn, and Mg in another sample. The Fe map shows a regular interface between the core and rim. The Ca map highlights calcium-rich areas. The Mn map shows manganese distribution, and the Mg map indicates magnesium distribution with marked mineral inclusions. Panel FONT2: X-ray maps for Fe, Ca, Mn, and Mg in the third sample. The Fe map shows a distinct core and rim. The Ca map highlights calcium concentration. The Mn map shows manganese distribution, and the Mg map indicates magnesium distribution with mineral inclusions marked by different symbols.
Mineral chemistry and zoning for white mica in samples 23PIN43, DD20 and FONT2. X-ray map (WDS) showing zoning in white mica for Mg and Na in samples 23PIN43 (a, b), DD20 (d, e) and FONT2 (g, h). White mica compositions for samples 23PIN43 (c), DD20 (f) and FONT2 (i). EPMA spot analyses are reported in Supplementary Material 2.

6.b. Sample DD20A (Serre, Chisone Valley)
Garnet displays growth zoning (Figure 7, Table S2 in Supplementary Material 2) characterized by a slight decrease in XAlm from core (Grt 1a) to rim (Grt 2) (0.76–0.75 to 0.73–0.74) and in XSps (0.12–0.13 to 0.05), accompanied by an increase in XGrs (0.05 to 0.11–0.14) and XPrp (0.08 to 0.09). Grossular content increases markedly at the outer rim, reaching values up to XGrs = 0.15 (Figure 7; Figure S2 in Supplementary Material 1). White mica also exhibits growth zoning (Figure 8d, e), with Fe, Si4+ and Mg decreasing towards the crystal edges, and Ti and Na showing a slight increase (Figure 8d). The crystal core (Wm 1) is characterized by Si4+contents of 3.50–3.65 a.p.f.u. (Table 3), whereas the rims (Wm 2), in equilibrium with the main foliation, have slightly lower Si4+contents (3.45–3.50 a.p.f.u.). Chloritoid has slightly Mg-rich cores (Cld 1, XMg = 0.19–0.20) and more Fe-rich rims (Cld 2, XMg = 0.17–0.18). Paragonite has XNa = 0.90–0.95, and chlorite has XMg = 0.48–0.50.
6.c. Sample FONT2 (Colletto di Fontane, Germanasca Valley)
This sample shows microstructural and petrographic features comparable with those observed in sample 23PIN43. Garnet displays growth zoning (Figure 7, Table S3 in Supplementary Material 2) characterized by a slight decrease in XAlm (0.81–0.73 to 0.71–0.67) and in XSps (0.06–0.05 to 0.03) from core (Grt 1a) to mantle (Grt 1b), accompanied by a slight increase in XGrs (0.06 to 0.11–0.12) and XPrp (0.06 to 0.09). Grossular content increases markedly at the rim (Grt 2), reaching values up to XGrs = 0.23 (Figure S2 in Supplementary Material 1; Table S3 in Supplementary Material 2). White mica also exhibits growth zoning (Figure 8g, h), with Fe, Si4+ and Mg decreasing towards the crystal edges, and Ti and Na showing a slight increase (Figure 8h). The crystal cores (Wm 1) are characterized by Si4+contents of 3.50–3.65 a.p.f.u., whereas the rims (Wm 2), in equilibrium with the main foliation, have slightly lower Si4+contents (3.45–3.50 a.p.f.u.). Chloritoid has slightly Mg-rich cores (Cld 1, XMg = 0.19–0.20) and Fe-rich rims (Cld 2, XMg = 0.17–0.18). Paragonite has XNa = 0.90–0.95, and chlorite has XMg = 0.48–0.50.
7. Raman characterization of coesite
Coesite is found as inclusions within the garnet mantle of samples 23PIN43 and FONT2. It occurs either as single and pristine inclusions (Figure 9a, b), or alternatively, as polycrystalline quartz aggregates commonly surrounded by radial fractures and interpreted as pseudomorphs after coesite (Figure 9c, d). Overall, the development of quartz pseudomorphs preferentially affects the larger coesite inclusions, whereas small, pristine inclusions are the most abundant. Pristine coesite inclusions are entirely enclosed within garnet, show no signs of re-equilibration and display morphologies ranging from sub-rounded to polyhedral. Raman spectra acquired from these inclusions exhibit the diagnostic vibrational modes of coesite (Boyer et al. Reference Boyer, Smith, Chopin and Lasnier1985), although slightly shifted towards higher wavenumbers (Figure 9e) due to residual pressure within the inclusions (e.g. Ghignone et al. Reference Ghignone, Gilio, Borghini, Boero, Bruno and Scaramuzzo2024; Boero et al. Reference Boero, Ghignone, Gilio, Borghini, Scaramuzzo, Gasco and Bruno2025). The principal Raman peak is observed at 523 cm−1 (compared with 521 cm−1 in Boyer et al. Reference Boyer, Smith, Chopin and Lasnier1985), whereas additional bands occur at 427, 272 and 207 cm−1.
Raman characterization of coesite. (a–d) Microphotographs of garnets with pristine coesite inclusions located in the garnet mantle in samples 23PIN43 (a–b) and FONT2 (c–d). (e) Raman spectra of two coesite inclusions. Garnet peak values at 346 and 916 cm−1 are marked with an asterisk. The garnet peak near 1040 cm–1 is shared with coesite.

Figure 9. Long description
Panel A: Microphotograph of a garnet with coesite inclusions from sample 23PIN43. The image shows a garnet with visible cracks and a red box highlighting a specific area. Panel B: Close-up microphotograph of the highlighted area in Panel A, showing coesite (Coe) and quartz (Qz) inclusions within the garnet. Panel C: Microphotograph of a garnet with coesite inclusions from sample FONT2. The image shows a garnet with visible cracks and a red box highlighting a specific area. Panel D: Close-up microphotograph of the highlighted area in Panel C, showing coesite (Coe) and quartz (Qz) inclusions within the garnet. Panel E: Raman spectra of coesite inclusions from samples 23PIN43 and FONT2, with peaks marked for coesite and quartz. The x-axis represents the Raman shift in cm^-1, and the y-axis represents intensity.
8. RSCM temperature
RSCM temperatures were estimated for the three samples selected for P–T modelling (samples 23PIN43, DD20 and FONT2) and on seven additional ones (Figure 2a; Table 2). Results are given in Table S1 and Figure S3 in Supplementary Material 1. The three key samples yielded TRSCM of 505°C ± 15°C (23PIN43), 503°C ± 20°C (DD20) and 504°C ± 24°C (FONT2). The additional samples have similar TRSCM ranging between 486°C ± 22°C and 506°C ± 20°C. Graphite yields rather constant R2 values in the range 0.25–0.38.
9. P–T estimates
9.a. Bulk compositions
The protoliths of samples 23PIN43 and DD20 classify as shale following the bulk chemical classification SandClass3 of Herron (Reference Herron1988), compositionally close to the Worldwide Average Pelite of Forshaw and Pattison (Reference Forshaw and Pattison2023) (Figure S4¸ bulk compositions in Supplementary Material 1, Tables S3 and S4).
9.b. P–T results for metapelite 23PIN43
Three equilibrium assemblage diagrams were calculated for sample 23PIN43 using progressive garnet fractionation of the effective bulk composition. The first diagram (Figure 10a) computed using the whole-rock bulk composition (Bulk I; Table S3 in Supplementary Material 1) is dominated by three-and four-variant fields, with minor two-and five-variant fields. Garnet is stable over most of the P–T space above 480°C. Biotite appears only at high temperatures and pressures below 1.4 GPa. Rutile is the main Ti-bearing phase, with ilmenite becoming stable at T > 500°C and P < 0.7–0.8 GPa. Glaucophane is predicted at T < 550°C and P between 1.6 and 2.0 GPa (Figure S7; Supplementary Material 1). Chloritoid remains stable up to 3.1 GPa at around 550°C. Kyanite appears for T ≥ 550°C at P > 0.7–1.2 GPa. The measured composition of the garnet core (XPrp = 0.06, XSps = 0.06, XAlm = 0.79, XGrs = 0.09) and the corresponding isopleths indicates crystallization at c. 500–550°C and 2.6–2.8 GPa, within the Car–Grt–Cld–Wm–Omp–Lws–Rt–Qz field, consistent with quartz rather than coesite occurring as inclusions in the garnet core. The measured Si4+ content in white mica (3.45–3.50 a.p.f.u.) and the XMg of chloritoid inclusions in the garnet core (0.19–0.20) are consistent with the P–T estimates shown in Figure 10b (black ellipsoid).
(a) Equilibrium assemblage diagram calculated using Bulk I (garnet core composition) for sample 23PIN43. (b) Overlap of selected garnet compositional isopleths (XPrp = 0.06, XSps = 0.06, XAlm = 0.79, XGrs = 0.09), together with XMg in chloritoid and Si4+ (a.p.f.u.) in white mica; the intersection is highlighted by the black ellipse. (c) Overlap of garnet compositional isopleths for the garnet mantle (Bulk II; XPrp = 0.08, XSps = 0.02, XAlm = 0.82, XGrs = 0.08), combined with XMg in chloritoid and Si (a.p.f.u.) in white mica. (d) Overlap of garnet compositional isopleths for the garnet rim (Bulk III; XPrp = 0.03, XSps = 0.02, XAlm = 0.70, XGrs = 0.25) and Si (a.p.f.u.) in white mica. Equilibrium assemblage diagrams calculated using Bulk II and Bulk III are provided in Supplementary Material 1 (Figure S5).

A second diagram (Figure 10c; Figure S5a) was computed using Bulk II (Table S2), obtained by subtracting the garnet core composition from Bulk I. Garnet fractionation shifts the garnet-in line towards higher temperatures by c. 50°C, whereas the overall topology and isopleth positions remain largely unchanged. Mantle crystallization corresponds to P–T conditions of c. 2.7–3.1 GPa and 540–560°C, based on the measured composition of garnet close to coesite inclusions (XPrp = 0.08, XSps = 0.02, XAlm = 0.82, XGrs = 0.08). The modelled Si4+ content of white mica in this field (c. 3.45–3.50 a.p.f.u.) matches the measured values. The XMg of chloritoid rims and inclusions in the outer core of garnet (0.19) is also consistent with the inferred P–T range. Calculated modal abundances for this stage are around ∼4 vol% for chloritoid and ∼4 vol% for garnet, consistent with the estimated modal proportion of garnet core + mantle (Supplementary Material 1; Figure S6). Kyanite is predicted at ∼8 vol% but was not observed, possibly due to later replacement or bulk composition uncertainties (Figure S7). Lawsonite (<0.5 vol%) and carpholite (<2 vol%) are predicted in minor amounts and were not directly observed, whereas omphacite (∼7–8 vol%) was likely replaced during decompression (Figure S6–7 in Supplementary Material 1). Although Na-pyroxene is not preserved in our samples, its predicted stability at peak HP–UHP conditions is consistent with previous thermodynamic modelling of Dora-Maira metapelites. Its complete replacement by albite during decompression likely explains its absence, as suggested by the rare jadeite inclusions in rutile reported by Manzotti et al. (Reference Manzotti, Millonig, Gerdes, Whitehouse, Jeon, Poujol and Ballèvre2025 a). The peak temperature estimated from the modelling is within uncertainties, comparable with the temperature estimated by RSCM (505°C ± 15°C) for this sample.
A third equilibrium assemblage diagram (Figure S5b, Figure 10d) was calculated using Bulk III (removing garnet core + mantle, i.e. Grt 1a and Grt 1b, from Bulk II) to model the garnet rim, which is characterized by a markedly higher grossular content (XGrs = 0.25), implying crystallization at significantly lower pressures. Because decompression may lead to H2O undersaturation (Le Bayon et al. Reference Le Bayon, Pitra, Ballèvre and Bohn2006; Manzotti et al. Reference Manzotti, Rubatto, Zucali, Korh, Cenki-Tok, Ballevre and Engi2018), this equilibrium assemblage diagram was computed with a fixed H2O content corresponding to that stored in the solid phases stable at peak P–T conditions (Bulk III composition; Table S3). The garnet rim composition (XPrp = 0.03, XSps = 0.02, XAlm = 0.70, XGrs = 0.25), plots within the Grt–Cld–Wm–Chl–Pg–Rt–Qtz field at c. 1.6–2.0 GPa and 525–570°C (Figure 10d). The measured Si4+ in white mica rims (3.25–3.35 a.p.f.u.) is consistent with this P–T range. Glaucophane likely grew during early decompression, in association to the S2 foliation, between ∼2.4 and 2.0 GPa, and was later on pseudomorphosed by chlorite + albite aggregates at lower pressure conditions, in agreement with petrographic observations.
9.c. P–T results for metapelite DD20
The equilibrium assemblage diagram for DD20 (Bulk I; Table S4 in Supplementary Material 1; Figure 11a) shows a broadly similar topology to that of 23PIN43. The main differences are that glaucophane is absent and kyanite appears at temperatures as low as 480°C above 2.7 GPa. The measured composition of the garnet core (XPrp = 0.08, XSps = 0.12, XAlm = 0.75, XGrs = 0.05) and the corresponding isopleths indicate crystallization at c. 540–570°C and 2.5–2.7 GPa, within the Car–Grt–Cld–Wm–Omp–Ky–Lws–Rt + Qtz field. The measured Si content in white mica (3.45–3.50 a.p.f.u.) and the XMg of chloritoid inclusions in the garnet core (0.14–0.15) are consistent with the P–T range inferred from garnet composition.
(a) Equilibrium assemblage diagram calculated using Bulk I for sample DD20. (b) Overlap of selected garnet core compositional isopleths (XPrp = 0.08, XSps = 0.12, XAlm = 0.75, XGrs = 0.05), together with XMg in chloritoid and Si (a.p.f.u.) in white mica; the intersection is highlighted by the black ellipse. (c) Overlap of garnet compositional isopleths for the garnet mantle (Bulk II; XPrp = 0.09, XSps = 0.09, XAlm = 0.75, XGrs = 0.06), combined with XMg in chloritoid and Si (a.p.f.u.) in white mica. (d) Overlap of garnet compositional isopleths for the garnet rim (Bulk III; XPrp = 0.10, XSps = 0.05, XAlm = 0.72, XGrs = 0.13) and Si4+ (a.p.f.u.) in white mica. Equilibrium assemblage diagrams calculated using Bulk II and Bulk III are provided in Supplementary Material 1 (Figure S8).

Figure 11. Long description
Panel A: A phase diagram shows equilibrium assemblage for Bulk I in sample DD20. The x-axis represents temperature in degrees Celsius, and the y-axis represents pressure in gigapascals. Various mineral assemblages are labeled within the diagram. Panel B: A phase diagram overlays selected garnet core compositional isopleths (XPrp=0.08, XSps=0.12, XAlm=0.75, XGrs=0.05) with XMg in chloritoid and Si (a.p.f.u.) in white mica. The intersection is highlighted by a black ellipsoid. The x-axis represents temperature in degrees Celsius, and the y-axis represents pressure in gigapascals. Panel C: A phase diagram overlays garnet compositional isopleths for the garnet mantle (Bulk II; XPrp=0.09, XSps=0.09, XAlm=0.75, XGrs=0.06) with XMg in chloritoid and Si (a.p.f.u.) in white mica. The x-axis represents temperature in degrees Celsius, and the y-axis represents pressure in gigapascals. Panel D: A phase diagram overlays garnet compositional isopleths for the garnet rim (Bulk III; XPrp=0.10, XSps=0.05, XAlm=0.72, XGrs=0.13) and Si4+ (a.p.f.u.) in white mica. The x-axis represents temperature in degrees Celsius, and the y-axis represents pressure in gigapascals.
Mantle crystallization corresponds to P–T conditions of c. 2.7–3.1 GPa and 540–570°C (Figure 11c), based on the measured garnet composition (XPrp = 0.09, XSps = 0.09, XAlm = 0.75, XGrs = 0.06) and Bulk II (Table S4, Figure S8a in Supplementary Material 1). The modelled Si content of white mica in this field (c. 3.45–3.50 a.p.f.u.) matches the measured values. The XMg of chloritoid rims and inclusions in the outer core of garnet (0.17–0.19) is also consistent with the inferred P–T range in the Car–Grt–Cld–Wm–Omp–Ky–Lws–Rt + Coe field. No coesite relics were identified, likely due to the abundance of fractures in garnet crystals limiting inclusion preservation. Moreover, most quartz inclusions in the garnet mantle are not barometrically isolated, leaving open the possibility that some originally represented coesite. Calculated modal abundances (∼6 vol% garnet and chloritoid, ∼1.5 vol% lawsonite) are consistent with petrographic observations (Figure S9 in Supplementary Material 1). Kyanite is predicted at ∼10 vol% but is not observed in thin section, either due to replacement during decompression or a slight overestimation of bulk Al2O3; a T–X(Al2O3) pseudosection at 2.7 GPa confirms that a variation of ∼2 wt% is sufficient to suppress kyanite stability (Figure S10; Supplementary Material 1). Omphacite and carpholite (∼7 and ∼10 vol%, respectively) were likely replaced during decompression, as discussed for the previous sample. The peak temperature estimated from the equilibrium assemblage diagrams is, within uncertainties, consistent with the RSCM temperature of 503°C ± 23°C.
The third diagram (Bulk III; Table S4; Figure S8b in Supplementary Material 1) constrains garnet rim crystallization to c. 1.2–1.6 GPa and 550–560°C (Figure 11d), based on the rim composition (XPrp = 0.10, XSps = 0.05, XAlm = 0.72, XGrs = 0.13). At these conditions kyanite is no longer stable and paragonite is instead predicted, consistent with petrographic observations. Unlike 23PIN43, amphibole is not predicted for DD20, in agreement with petrographic observations (Section 5.b.).
9.d. P–T results for metapelite FONT2
THERMOCALC average P–T calculations were performed for sample FONT2 using two different sets of mineral compositions (Table S3 in Supplementary Material 2). These calculations indicate peak metamorphic conditions of 507°C ± 14°C and 2.9 ± 0.3 GPa (σ fit = 1.08) and 501°C ± 13°C and 2.7°C ± 0.3 GPa (σ fit = 0.90), respectively (Figure S11 in Supplementary Material 1). The temperatures estimated with THERMOCALC are consistent with those obtained using the RSCM method (504°C ± 24°C). The calculated pressures are consistent with the occurrence of coesite relics in this sample and with the peak P–T conditions inferred from the PERPLE_X thermodynamic modelling of the other two samples. The mineral assemblages observed are comparable to those predicted under similar P–T conditions by equilibrium assemblage diagrams calculated for an average metapelitic bulk composition (Smye et al. Reference Smye, Greenwood and Holland2010; Manzotti et al. Reference Manzotti, Schiavi, Ballèvre and Nosenzo2025 b).
10. Detrital zircon geochronology
Samples FONT2 and 23PIN43 from the Permo–Mesozoic cover sequence of the Dora-Maira Massif and one micaschist sample attributed to the polycyclic basement (DD97) were selected for zircon geochronology to constrain their depositional ages. Samples FONT2 and 23PIN43 (Table 1; Figure 2a) are garnet-chloritoid (±ankerite)-bearing micaschists (Fontane micaschist) collected near the Colletta di Fontane and Colle Giulian, respectively (Germanasca Valley). Sample DD97 is a garnet-bearing micaschist collected near Salza di Pinerolo (Figure 2a).
Zircon grains extracted from the three samples show broadly comparable morphological features and are therefore described together. Crystals range from 40 to 180 μm in length and vary in shape from rounded and weakly elongated to highly elongated and subhedral (Figure 12). The cathodoluminescence images reveal complex internal textures, including oscillatory zoning and homogeneous domains, with cross-cutting relationships. Many grains with predominantly oscillatory zoning exhibit typical features of magmatic growth, whereas others have younger overgrowths surrounding partially resorbed cores. Most zircon crystals have a thin (<5 μm) patchy-zoned rim, which was avoided during U-Pb analysis. Zircon in all samples shows a wide range of U contents (23PIN43: 58–4900 μg/g; DD97: 59–3930 μg/g; FONT2: 216–6900 μg/g) and Th/U ratios (23PIN43: 0.013–2.20; DD97: 0.01–1.87; FONT2: 0.01–0.68), consistent with mixed magmatic and metamorphic origins (Hoskin and Schaltegger, Reference Hoskin and Schaltegger2003; Teipel et al. Reference Teipel, Eichhorn, Loth, Rohrmüller, Höll and Kennedy2004; Supplementary Material 3). As expected for a detrital zircon population, no systematic correlation between measured dates and Th/U ratio is observed.
Detrital zircon geochronology. Cathodoluminescence images of representative zircon crystals and kernel density plots of 206Pb/238U ages (<1 Ga) and 207Pb/206Pb ages (>1 Ga) for metasediments 23PIN43 (a, b), FONT2 (c, d) and DD97 (e, g). In the cathodoluminescence images (a, c and e) circles indicate the location of the analyses and numbers are dates with absolute uncertainty (Ma ± 2 sigma). Diagrams show data filtered at ≥90% concordance. (f) Concordia plot of youngest zircon analyses from samples 23PIN43 and FONT2. The detrital zircon age populations from the northern Dora-Maira basement (Nosenzo et al. Reference Nosenzo, Manzotti, Krona, Ballèvre and Poujol2024), Pinerolo-Sanfront and Zone Houillère (Manzotti et al. Reference Manzotti, Ballèvre and Poujol2016) and the northern Gondwana mainland (Siegesmund et al. Reference Siegesmund, Oriolo, Schulz, Heinrichs, Basei and Lammerer2021) are shown for comparison in the lowest part of the figure.

In micaschist 23PIN43, 67 concordant dates (>90% concordant) were obtained from 83 measurements (Figure 12b). The dates scatter from late Archean to Permian with significant peaks at ∼2 Ga, 730, 620, 480 and 300 Ma. The three youngest concordant dates measured on zircon cores with oscillatory zoning yielded a mean Permian age of 279 ± 8 Ma, whereas a younger date of 232 ± 9 Ma was measured on a rim.
In micaschist FONT2, 35 of the 70 analyses yield concordant dates (Figure 12e), with a distribution comparable with sample 23PIN43. The Permian peak is younger (∼ 260 Ma) than in sample 23PIN43 and includes six analyses with a mean age of 263 ± 6 Ma (±2 Ma internal uncertainty only), some of which were measured in zircon centres far from the potentially metamorphic rim (Figure 12c). The youngest concordant Permian date of 261 ± 6 Ma was measured on a zircon core with Th/U of 0.19.
In sample DD97, 83 concordant dates range in date from late Archean to ∼430 Ma (Figure 12g). The largest cluster of concordant dates is around 610 Ma and belongs to a broader age distribution ranging from ∼1 Ga to ∼550 Ma. The youngest date cluster is defined by four analyses with a mean age of 430 ± 20 Ma. Therefore, a Silurian–Devonian maximum depositional age is inferred for this sample.
11. Discussion
11.a. Geochronology and tectono-stratigraphic evolution of cover sequence
The Silurian–Devonian maximum depositional age of sample DD97 inferred from detrital zircon geochronology supports its attribution to the basement. In contrast, the Fontane micaschist samples associated with the cover (23PIN43, FONT2) yield concordant zircon dates between ∼300 and 260 Ma. For some of these grains, a magmatic origin is supported by their relatively high Th/U ratios and internal textures, whereas others display Th/U ratios more typical of metamorphic zircon. This raises the question of whether the metamorphic grains were reworked and transported prior to, or after, their metamorphic overprint. These zircon domains have Th/U <0.15 and could therefore be interpreted as metamorphic according to standard Th/U-based classifications (Rubatto, Reference Rubatto2017). Nonetheless, recent studies (Nosenzo et al, Reference Nosenzo, Manzotti, Poujol, Ballèvre and Langlade2022, Reference Nosenzo, Manzotti, Krona, Ballèvre and Poujol2024; Dana et al. Reference Dana, De Cesari, Montomoli, Iaccarino, Corno, Rubatto and Carosi2025) have shown that several meta-intrusive rocks of the Dora-Maira Massif contain magmatic zircon with low Th/U due to the presence of allanite and such meta-intrusive could be the source of these detrital zircon grains. This hypothesis is supported by the oscillatory zoning texture observed in most of the zircon crystals. These observations support the interpretation that both samples are part of a monometamorphic sequence. This is further evident from the absence of polymetamorphic textures and garnet zoning, which indicate a single metamorphic cycle. The Fontane micaschist is also consistently associated with ankerite pods, a mineral typical of Permo-Triassic metasediments (Michard, Reference Michard1967; Henry, Reference Henry1990). They are also spatially associated with other Permian lithologies, such as the Luserna orthogneiss (Nosenzo et al. Reference Nosenzo, Manzotti, Krona, Ballèvre and Poujol2024; Dana et al. Reference Dana, De Cesari, Montomoli, Iaccarino, Corno, Rubatto and Carosi2025), as well as with Mesozoic cover rocks, including quartzite, marble and calcschist (Figure 2b, Figure 3). The Fontane micaschist contains magmatic zircons with ages overlapping those of the associated Luserna orthogneiss (265–267 Ma; Nosenzo et al. Reference Nosenzo, Manzotti, Krona, Ballèvre and Poujol2024; Dana et al. Reference Dana, De Cesari, Montomoli, Iaccarino, Corno, Rubatto and Carosi2025), suggesting that the sediments may have been deposited shortly after emplacement of the orthogneiss protolith. Taken together, geological, petrological and geochronological evidences suggest that both samples 23PIN43 and FONT2 likely share a common Permian depositional age.
The Fontane micaschist documented within the Dora-Maira cover sequence may correspond to the Permian–Lower Triassic pelitic sediments described in several internal Briançonnais units (Debelmas and Lemoine, Reference Debelmas and Lemoine1966; Lefèvre and Michard, Reference Lefèvre and Michard1976; Lefèvre, Reference Lefèvre1984; Michard and Henry, Reference Michard and Henry1988; Dana et al. Reference Dana, Iaccarino, Schmid, Petroccia and Michard2023). The occurrence of Permian metasediments within the ‘Basement Complex’ units has been previously proposed (Henry, Reference Henry1990; Cadoppi and Tallone, Reference Cadoppi and Tallone1992; Sacchi et al. Reference Sacchi, Balestro, Cadoppi, Carraro, Delle Piane, Di Martino, Enrietti, Gallarà, Gattiglio, Martinotti and Perello2004), largely based on the presence of monocyclic garnet-chloritoid micaschist locally associated with ankerite-bearing layers. However, not all garnet-chloritoid-bearing micaschist can be systematically considered Permian in age, as Variscan relicts might have been completely absent or overprinted during Alpine metamorphism. This is supported by monocyclic micaschist documented away from the cover sequences (Chasteiran locality; Manzotti et al. Reference Manzotti, Schiavi, Nosenzo, Pitra and Ballèvre2022, Reference Manzotti, Millonig, Gerdes, Whitehouse, Jeon, Poujol and Ballèvre2025 a), with evidence for Silurian depositional ages (Manzotti et al. Reference Manzotti, Millonig, Gerdes, Whitehouse, Jeon, Poujol and Ballèvre2025 a; Carosi et al. Reference Carosi, Montomoli, Iaccarino, Dana, Corno, De Cesari and Spina2025), and by the occurrence in some micaschist of pseudomorphs of chloritoid + paragonite after probable Variscan staurolite (the ‘micaschistes amygdalaires’ of Henry, Reference Henry1990; Chopin et al. Reference Chopin, Henry and Michard1991).
The uppermost portion of the cover sequence (Figure 2b) preserves a clear change in depositional environments, from a shallow, stable carbonate platform (marble and metadolostone) in the Middle–Late Triassic to a deeper basin dominated by detrital input (calcschist and sandy marble). Deposition of these more distal sediments likely began in the Middle Jurassic and continued until the Coniacian–Maastrichtian as documented by the microfossils found in the northern Dora-Maira (Marthaler et al. Reference Marthaler, Fudral, Deville and Rampnoux1986; Fudral, Reference Fudral1998). In our study area, there is no evidence for Lower Jurassic syn-rift sequences preserved in the Dora-Maira cover, in contrast to the typical syn-rift succession that includes continental clastic sediments and carbonate platform breccias, documented in the Pre-Piemonte units (i.e. units palaeogeographically located between the Briançonnais s.s. and the Piemonte-Ligurian domains; Michard, Reference Michard1967; Dumont, Reference Dumont1984; Michard et al. Reference Michard, Schmid, Lahfid, Ballèvre, Manzotti, Chopin, Iaccarino and Dana2022; Figure 13a). This observation suggests that syn-rift sequences either were not deposited, implying that at least some portion of the Dora-Maira may have represented a structural high during the Early Jurassic, similar to the Briançonnais s.s. units (Michard and Henry, Reference Michard and Henry1988; Michard et al. Reference Michard, Schmid, Lahfid, Ballèvre, Manzotti, Chopin, Iaccarino and Dana2022; Dana et al. Reference Dana, Iaccarino, Schmid, Petroccia and Michard2023), or alternatively syn-rift sediments were subsequently removed by Alpine tectonics or erosion. The depositional history proposed for the cover sequence agrees with most palaeogeographic reconstructions, which place the Dora-Maira Massif in a distal position along the Briançonnais margin, even beyond the palaeogeographic location of the Pre-Piemonte units during the Late Cretaceous (Figure 13a; Ballèvre et al. Reference Ballèvre, Camonin, Manzotti and Poujol2020; Michard et al. Reference Michard, Schmid, Lahfid, Ballèvre, Manzotti, Chopin, Iaccarino and Dana2022; Dana et al. Reference Dana, Iaccarino, Schmid, Petroccia and Michard2023), a period when subduction of Piemonte-Liguria ocean was probably ongoing (Skora et al. Reference Skora, Lapen, Baumgartner, Johnson, Hellebrand and Mahlen2009; Rebay et al. Reference Rebay, Zanoni, Langone, Luoni, Tiepolo and Spalla2018).
Palaeogeographic and tectonic evolution of the Dora-Maira Massif. (a) Late Cretaceous configuration of the Briançonnais microcontinent, with the Dora-Maira forming a distal crustal high located beyond the pre-Piemonte palaeogeographic domain (based on Pantet et al. Reference Pantet, Epard and Masson2020; Michard et al. Reference Michard, Schmid, Lahfid, Ballèvre, Manzotti, Chopin, Iaccarino and Dana2022 and Agard, Reference Agard2021). Syn-rift oceanic sediments have been omitted for clarity. (b) Continental subduction during the Middle–Late Eocene, slicing and incorporation of basement–cover successions into the subduction channel, and burial to UHP conditions in the Dora-Maira units (modified from Dana et al. Reference Dana, Iaccarino, Schmid, Petroccia and Michard2023 and Agard, Reference Agard2021). (c) Latest Eocene to Early Oligocene crustal stacking and beginning of exhumation, with pinching of subduction channel slices (modified from Michard et al. Reference Michard, Avigad, Goffé and Chopin2004; Dana et al. Reference Dana, Iaccarino, Schmid, Petroccia and Michard2023; Agard, Reference Agard2021). Upper plate oceanic units represent fragments of the Piemonte-Ligurian Ocean that escaped deep subduction and during the convergence remained at shallow crustal levels or within the overriding upper plate (see Schmid et al. Reference Schmid, Fügenschuh, Kissling and Schuster2004, Reference Schmid, Kissling, Dichl, van Hinsbergen and Molli2017). (d) From c. 35 Ma to the present, continued plate convergence and the westward indentation of the Ivrea mantle wedge (Schmid et al. Reference Schmid, Kissling, Dichl, van Hinsbergen and Molli2017) induced large-scale retro-vergent deformation throughout the Western Alps. The internal portion of the nappe stack, including the Dora-Maira Massif, was progressively transported eastwards, leading to the development of the large regional backfolds and backthrusts. The Piemonte–Ligurian oceanic units, originally located structurally above and east of the Briançonnais continental units during subduction, were subsequently carried over and folded around the Dora-Maira, reaching their present-day position. Units that formed part of the upper plate during subduction are no longer exposed in this portion of the Western Alps and were probably largely eroded, with the exception of the Chenaillet klippe. Modified after Molli et al. (Reference Molli, Crispini, Malusà, Mosca, Piana and Federico2010), Schwartz et al. (Reference Schwartz, Tricart, Lardeaux, Guillot and Vidal2009), Lardeaux et al. (Reference Lardeaux, Schwartz, Tricart, Paul, Guillot, Béthoux and Masson2006) and Schmid et al. (Reference Schmid, Kissling, Dichl, van Hinsbergen and Molli2017).

Figure 13. Long description
Panel A: A cross-sectional diagram showing the Late Cretaceous configuration of the Briançonnais microcontinent, with the Dora-Maira forming a distal crustal high. The diagram includes labels for different geological units such as lithospheric mantle, pre-rift sequence, syn-rift sediments, post-rift sediments, and oceanic crust. Panel B: A cross-sectional diagram depicting continental subduction during the Middle to Late Eocene, showing the slicing and incorporation of basement-cover successions into the subduction channel. Key elements include the fore bulge, Helminthoid Flysch, and various geological units like continental crust, subduction channel, and meta-ophiolites. Panel C: A cross-sectional diagram illustrating the Latest Eocene to Early Oligocene crustal stacking and beginning of exhumation, with the formation of the Dora-Maira Massif nappe stack. It shows the pinching of subduction channel slices and the presence of oceanic metasediments and metaophiolite. Panel D: A cross-sectional diagram showing the late Oligocene to present day backfolding and doming of the Dora-Maira Massif, including the development of large-scale retro-vergent deformation throughout the Western Alps.
11.b. P–T–d path of the study area
Field mapping, meso-to micro-structural analyses, mineral chemistry and P–T data of three Fontane micaschist samples from the Permo–Mesozoic cover of the Dora-Maira Massif (23PIN43, DD20, FONT2) show evidence for multiple metamorphic stages during Alpine collision (Figure 14).
-
1. The D1 phase is preserved as a continuous foliation (S1), defined by chloritoid (Cld 1), high-Si4+ white mica (Wm 1) and rutile within microlithons of the S2 foliation. Garnet porphyroblast growth initiated during the D1 phase. Microstructural observations indicate that D1 correlates with the earliest segment of the P–T path (Figure 14). The garnet core (Grt 1a) records an early prograde stage, as indicated by the preservation of quartz inclusions. In contrast, the garnet mantle (Grt 1b) records peak-pressure conditions at prograde to peak-pressure (UHP) conditions of c. 540–560°C and 2.7–2.9 GPa in both samples, as indicated by the presence of coesite inclusions. Although these two garnet domains document distinct steps along the prograde P–T path, they are regarded as part of the same D1 phase, along a prograde burial path crossing the quartz-coesite transition. Peak metamorphic conditions are within the coesite-(chloritoid)-eclogite-facies, consistent with the presence of UHP coesite relics and the TRSCM results. These findings agree with previous P–T estimates (c. 510–550°C and 2.7–3.0 GPa) reported for micaschist of the Serre and Muret Units in adjacent areas (Manzotti et al. Reference Manzotti, Schiavi, Ballèvre and Nosenzo2025b) and for the Chasteiran Unit (Manzotti et al. Reference Manzotti, Schiavi, Nosenzo, Pitra and Ballèvre2022). Minor differences (e.g. the presence or absence of carpholite at peak conditions) with respect to the modelling of Manzotti et al. (Reference Manzotti, Schiavi, Nosenzo, Pitra and Ballèvre2022, Reference Manzotti, Millonig, Gerdes, Whitehouse, Jeon, Poujol and Ballèvre2025 a, b) are mainly attributable to the use of different thermodynamic databases and solid-solution models. We highlight that the metamorphic temperatures predicted by thermodynamic modelling using PERPLE_X are slightly higher than those estimated by THERMOCALC and RSCM thermometry. This discrepancy is probably related to limitations or uncertainties in the a–x models used and should be further investigated in dedicated studies. In addition, the highest Si contents measured in white mica (3.60–3.65 a.p.f.u.) are not reproduced by the available white mica a–x models in the modelled P–T range, highlighting a limitation in the current thermodynamic datasets when dealing with extreme natural compositions. Nevertheless, these compositions provide qualitative evidence for very high-pressure conditions and support the occurrence of a UHP metamorphic evolution. D1 therefore developed during continental subduction and corresponds to the progressive burial of the Briançonnais passive margin (Figure 13b) after the closure of Piemonte-Liguria ocean (Skora et al. Reference Skora, Lapen, Baumgartner, Johnson, Hellebrand and Mahlen2009; Rebay et al. Reference Rebay, Zanoni, Langone, Luoni, Tiepolo and Spalla2018).
-
2. Thermodynamic modelling reveals an additional metamorphic stage highlighted in all samples by high-Ca rims in garnet (Grt 2), at c. 1.2–1.6 GPa and 550–560°C (Figure 14). White mica with decreasing Si contents towards the rims is consistent with recrystallization of this mineral during decompression. D2 marks the formation of the mylonitic S2 foliation, associated with lower-Si white mica (Wm 2), garnet rims (Grt 2) and rutile/ilmenite. In the studied micaschist, the garnet mode increases slightly during early decompression (Supplementary Material 1), in agreement with Manzotti et al. (Reference Manzotti, Schiavi, Nosenzo, Pitra and Ballèvre2022, Reference Manzotti, Millonig, Gerdes, Whitehouse, Jeon, Poujol and Ballèvre2025 a, b). Overall, D2 deformation initiated after the peak-pressure conditions and continued through early decompression (Figure 14). Nappe stacking (Figure 13c), linked to non-coaxial shearing, probably occurred during this deformation phase and was later affected by D3 deformation. During nappe stacking, slices of the subduction channel consisting of both oceanic and continental material were likely tectonically interleaved between continental basement units (Figure 13c). This mixed zone later transformed into shear zones (Valmala, San Damiano and Cima Lubin-Roccenie, Michard et al. Reference Michard, Schmid, Lahfid, Ballèvre, Manzotti, Chopin, Iaccarino and Dana2022), which now separate tectonic units of the Cottian Alps (Henry et al. Reference Henry, Michard and Chopin1993; Michard et al. Reference Michard, Schmid, Lahfid, Ballèvre, Manzotti, Chopin, Iaccarino and Dana2022). Alternative interpretations consider these zones as remnants of small oceanic or exhumed mantle basins (Balestro et al. Reference Balestro, Festa, Cadoppi, Groppo and Roà2022, Reference Balestro, Roà, Bertok, Gattiglio, Ghignone, Groppo, van Schijndel and Festa2026; Bonnet et al. Reference Bonnet, Chopin, Locatelli, Kylander-Clark and Hacker2022), although continental-derived rocks clearly dominate over ophiolites (Henry, Reference Henry1990; Mondino, Reference Mondino2005; Balestro et al. Reference Balestro, Nosenzo, Cadoppi, Fioraso, Groppo and Festa2020; Michard et al. Reference Michard, Schmid, Lahfid, Ballèvre, Manzotti, Chopin, Iaccarino and Dana2022).
-
3. The D3 deformation phase is associated with a S3 greenschist-facies crenulation cleavage in most lithologies (Dana et al. Reference Dana, De Cesari, Iaccarino, Montomoli, Corno, Rubatto and Carosi2026). However, in our selected micaschist S3 is missing, and re-equilibration is rather manifested in post-kinematic (with respect to S2) growth of chlorite and albite, and the widespread chloritization of garnet (Figure 14). Although precise P–T constraints cannot be obtained for this stage (with our samples), the mineral assemblage of the studies samples (including nearly pure albite) indicates decompression and retrograde re-equilibration under greenschist-facies conditions. These conditions are consistent with the well-documented retrogression affecting the entire Dora-Maira Massif, typically at 500–600°C and 0.5–0.9 GPa (i.e. amphibolite-to greenschist-facies conditions; Borghi et al. Reference Borghi, Cadoppi, Porro and Sacchi1985; Sandrone and Borghi, Reference Sandrone and Borghi1992; Chopin et al. Reference Chopin, Henry and Michard1991; Avigad et al. Reference Avigad, Chopin and Le Bayon2003; Bonnet et al. Reference Bonnet, Chopin, Locatelli, Kylander-Clark and Hacker2022; Nosenzo et al. Reference Nosenzo, Manzotti and Robyr2023; Dana et al. Reference Dana, De Cesari, Iaccarino, Montomoli, Corno, Rubatto and Carosi2026). At the geodynamic scale, D3 represents the regional phase of Alpine backfolding and backthrusting associated with the late stages of continental collision (Bucher et al. 2003, Michard et al. Reference Michard, Schmid, Lahfid, Ballèvre, Manzotti, Chopin, Iaccarino and Dana2022; Dana et al. Reference Dana, Iaccarino, Schmid, Petroccia and Michard2023). From c. 35 Ma onwards, continued convergence between Adria and Europe, coupled with the WNW-directed indentation of the Ivrea mantle wedge (Schmid et al. Reference Schmid, Kissling, Dichl, van Hinsbergen and Molli2017), induced large-scale retro-vergent deformation throughout the Western Alps. As the rigid Ivrea mantle wedge indented the Alpine orogenic wedge, the internal portion of the nappe stack, including the Dora-Maira Massif, was progressively transported eastwards, producing the large regional backfolds that have long been recognized as one of the defining structural features of the Western Alps (e.g. Argand, Reference Argand1916). Structural cross-sections (e.g. Michard et al. Reference Michard, Schmid, Lahfid, Ballèvre, Manzotti, Chopin, Iaccarino and Dana2022) show that the Dora-Maira Massif forms the core of a major backfold, whose eastern limb is now buried beneath the sediments of the Po Plain. As a consequence of this large-scale rotation and retro-vergent deformation, the Piemonte-Ligurian oceanic units, originally located structurally above and east of the Briançonnais continental units during subduction and exhumation, were displaced to their present-day position on the western side of the Dora-Maira Massif.
-
4. A final D4 event corresponds to late doming and steepening of the foliation in the study area. At the geodynamic scale, this stage represents the continuation of the Alpine backfolding event and produced the characteristic final dome-shaped architecture of the Dora-Maira Massif. Quartz deformation mechanisms (bulging) indicate T of deformation <400°C, thus low-grade metamorphic conditions during the final stages of exhumation. During the D4 event, brittle–ductile shear zones developed, cross-cutting earlier structures, such as the ‘La Fracho Shear Zone’ described by Nosenzo et al. (Reference Nosenzo, Manzotti, Krona, Ballèvre and Poujol2024).
P–T–d path and related microstructures for the studied samples compared with those path proposed by Manzotti et al. (Reference Manzotti, Schiavi, Nosenzo, Pitra and Ballèvre2022, Reference Manzotti, Schiavi, Ballèvre and Nosenzo2025 b).

11.c. Tectonic implications for the structural architecture of the Dora-Maira Massif
The Dora-Maira Massif has been classically subdivided into three main tectonic units, from bottom to top: the Pinerolo-Sanfront Unit, the ‘Basement Complex’ and the Dronero Unit (Chopin et al. Reference Chopin, Henry and Michard1991; Henry et al. Reference Henry, Michard and Chopin1993; Michard et al. Reference Michard, Henry and Chopin1993; Bonnet et al. Reference Bonnet, Chopin, Locatelli, Kylander-Clark and Hacker2022). Following the discovery of coesite by Chopin (Reference Chopin1984), the ‘Basement Complex’ has been progressively subdivided into several smaller units, primarily on the basis of differences in peak metamorphic conditions. The resulting nomenclature, summarized in Table S1 of Supplementary Material 4, has grown considerably over the decades and varies between the southern, central–northern and northernmost sectors of the massif (Figure 15). Here we argue that many of these subdivisions are no longer justified in the light of recent petrological and structural evidence, and we propose a simplified tectonic framework.
Tectonic map of the Dora-Maira Massif showing the newly proposed structural subdivisions and compiled peak P–T conditions from this and previous study. The map was compiled after Dana et al. (Reference Dana, De Cesari, Montomoli, Iaccarino, Corno, Rubatto and Carosi2025), incorporating data from Henry (Reference Henry1990), Servizio Geologico d’Italia (Reference Geologico d’Italia2002) and Michard et al. (Reference Michard, Schmid, Lahfid, Ballèvre, Manzotti, Chopin, Iaccarino and Dana2022). P–T data derive from Pognante and Sandrone Reference Pognante and Sandrone(1989), Hermann (Reference Hermann2003), Gasco et al. (Reference Gasco, Gattiglio and Borghi2011), Groppo et al. (Reference Groppo, Ferrando, Gilio, Botta, Nosenzo, Balestro, Festa and Rolfo2019, Reference Groppo, Ferrando, Tursi and Rolfo2025), Manzotti et al. (Reference Manzotti, Schiavi, Nosenzo, Pitra and Ballèvre2022, Reference Manzotti, Schiavi, Ballèvre and Nosenzo2025 b, Reference Manzotti, Schiavi, Piccoli, Westin and Ballèvre2026), Nosenzo et al. (Reference Nosenzo, Manzotti and Robyr2023), Nerone et al. (Reference Nerone, Petroccia, Caso, Dana and Maffeis2024) and Petroccia et al. (Reference Petroccia, Nerone, Maffeis, Caso, Boero, Ghignone and Groppo2025). The small San Chiaffredo Unit of Compagnoni et al. (Reference Compagnoni, Rolfo, Groppo, Hirajima and Turello2012) is here mapped as part of the Brossasco-Isasca Unit following Michard et al. (Reference Michard, Schmid, Lahfid, Ballèvre, Manzotti, Chopin, Iaccarino and Dana2022). Abbreviations (uppercase bold for tectonic nappes, lowercase bold for units defined solely on the basis of P–T estimates but not constrained by nappe boundaries): MV = Monviso, SOR = Susa-Orsiera-Rocciavrè Unit, LA = Lanzo, CLSZ = Cima Lubin Shear Zone, VG = Valle Grana Unit, VMS = Val Maira-Sampeyre Unit, DU = Dronero Unit, VSZ = Valmala Shear Zone, VS = Varaita-Susa Unit (se = Serre Unit, mru = Muret-Ricordone Unit, cu = Chasteiran Unit), RS = Rocca Solei Unit (gu = Grimbassa Unit; rs = Rocca Solei Unit), BIU = Brossasco-Isasca Unit (sc = San Chiaffredo Unit), PSU = Pinerolo-Sanfront Unit.

In the southern Dora-Maira, the ‘Basement Complex’ comprises, from bottom to top, the Brossasco-Isasca Unit (UHP peak at ∼700°C and 4.0 GPa; Hermann et al. 2003; Ferrando et al. Reference Ferrando, Groppo, Frezzotti, Castelli and Proyer2017), bounded above and below by shear zones (Henry, Reference Henry1990; Henry et al. Reference Henry, Michard and Chopin1993) and two overlying units originally defined by the absence of UHP indicators: the Ricordone and Rocca-Solei units (Chopin et al. Reference Chopin, Henry and Michard1991; Compagnoni et al. Reference Compagnoni, Rolfo, Groppo, Hirajima and Turello2012). Recent high-resolution analyses have, however, documented coesite relics and microstructural evidence of former coesite in both units (Groppo et al. Reference Groppo, Ferrando, Tursi and Rolfo2025; Petroccia et al. Reference Petroccia, Nerone, Maffeis, Caso, Boero, Ghignone and Groppo2025). This indicates that they too reached UHP conditions, but within the coesite-chloritoid stability field, i.e. at lower temperatures and pressures than the Brossasco-Isasca Unit. Groppo et al. (Reference Groppo, Ferrando, Tursi and Rolfo2025) further propose to subdivide the Rocca-Solei Unit into a UHP domain and a lower-pressure Grimbassa Unit. In the central–northern Dora-Maira, the tectonic architecture was initially described as comprising the ‘Basement Complex’ (Muret Unit of Nosenzo et al. Reference Nosenzo, Manzotti, Poujol, Ballèvre and Langlade2022) with its Permo–Mesozoic cover and the underlying Pinerolo-Sanfront Unit (Borghi et al. Reference Borghi, Cadoppi, Porro, Sacchi and Sandrone1984). Subsequent work led to the definition of the Chasteiran Unit: based on coesite inclusions in garnet from graphite-rich micaschist (Manzotti et al. Reference Manzotti, Schiavi, Nosenzo, Pitra and Ballèvre2022) and the Serre Unit, comprising cover sequences detached from the ‘Basement Complex’ along a brittle–ductile contact (Nosenzo et al. Reference Nosenzo, Manzotti, Krona, Ballèvre and Poujol2024). Later petrological reappraisal documented coesite relics in both the Muret and Serre units as well (Manzotti et al. Reference Manzotti, Schiavi, Ballèvre and Nosenzo2025 b), so that the Chasteiran, Muret and Serre units are now recognized as sharing the same UHP metamorphic peak in the coesite-chloritoid stability field (Figure 15).
In the northernmost Dora-Maira (Susa Valley, north of the area of Figure 2; see Figure 1), the polycyclic basement of the Dora-Maira Massif (and its ‘para-autochthonous’ cover) has not been subdivided further and is mapped as a single ‘Upper Unit’ with quartz-bearing eclogite-facies peak conditions (Gasco et al. Reference Gasco, Gattiglio and Borghi2011). Its structural continuity with the units to the south, however, suggests that updated petrological investigations (e.g. Bingo-Antidote; Duesterhoeft and Lanari, Reference Duesterhoeft and Lanari2020; Lanari and Hermann, Reference Lanari and Hermann2021) may reveal coesite-chloritoid conditions also here. When considering the tectonic architecture of the massif (Figure 15), it appears unlikely that the peak metamorphic conditions of the polycyclic basement (and associated cover) would differ significantly between the Chisone Valley sector (UHP; Manzotti et al. Reference Manzotti, Schiavi, Nosenzo, Pitra and Ballèvre2022, Reference Manzotti, Schiavi, Ballèvre and Nosenzo2025) and the Susa Valley sector (Gasco et al. Reference Gasco, Gattiglio and Borghi2011). These two areas are structurally continuous beneath the overlying Susa-Orsiera-Rocciavrè Unit belonging to the Piemonte-Ligurian units, which forms a klippe-like unit resting on top of the Dora-Maira Massif (Figure 15).
Because of the proliferation of different names given for all the units, two fundamental issues cast doubts regarding the tectonic significance of much of this confusing terminology. The first issue concerns the identification of the unit-bounding contacts. In many cases, boundaries have been inferred primarily based on purely petrological contrasts and interpolation between scattered samples, rather than from field evidence in terms of structural data. This is largely due to generally poor exposure conditions across the massif. Recent studies show that many of these supposed P–T contrasts are not laterally consistent (Groppo et al. Reference Groppo, Ferrando, Tursi and Rolfo2025; Manzotti et al. Reference Manzotti, Schiavi, Nosenzo, Pitra and Ballèvre2022, Reference Manzotti, Schiavi, Ballèvre and Nosenzo2025b ; Petroccia et al. Reference Petroccia, Nerone, Maffeis, Caso, Boero, Ghignone and Groppo2025), undermining a solid basis for the inferred boundaries. From a lithostratigraphic perspective, moreover, all these units belong to the same continental crust intruded by igneous bodies of variable age and composition (Sandrone et al. Reference Sandrone, Cordola and Fontan1986, Reference Sandrone, Cadoppi, Sacchi, Vialon, von Raumer and Neubauer1993; Nosenzo et al. Reference Nosenzo, Manzotti, Krona, Ballèvre and Poujol2024; Dana et al. Reference Dana, De Cesari, Montomoli, Iaccarino, Corno, Rubatto and Carosi2025). Graphite-rich layers associated with garnet-chloritoid micaschist, which were previously considered diagnostic markers of the UHP Chasteiran Unit (Manzotti et al. Reference Manzotti, Schiavi, Nosenzo, Pitra and Ballèvre2022; Nosenzo et al. Reference Nosenzo, Manzotti, Krona, Ballèvre and Poujol2024), are in fact more widespread, occurring also within the Muret and Ricordone units (Carosi et al. Reference Carosi, Montomoli, Iaccarino, Dana, Corno, De Cesari and Spina2025).
The second issue concerns the nature of the deformation pattern within the Dora-Maira Massif. Deformation is intense, heterogeneous and partitioned (Wheeler et al. Reference Wheeler1991; Dana et al. Reference Dana, De Cesari, Iaccarino, Montomoli, Corno, Rubatto and Carosi2026), commonly resulting in distributed shearing that transposes and obliterates primary contacts. Discrete nappe-bounding structures in the classical sense cannot be recognized between most of the polycyclic basement units. Instead, deformation partitioning is present where non-coaxial shearing is preferentially accommodated within incompetent lithologies (e.g. S-C fabrics in garnet-chloritoid micaschist) or where it is localized around more competent bodies such as metabasites and orthogneisses. For instance, along the supposed contact between the Muret and Chasteiran units at the base of the Granero orthogneiss (Nosenzo et al. Reference Nosenzo, Manzotti, Krona, Ballèvre and Poujol2024), the associated mylonitic zone disappears where the orthogneiss body pinches out. This demonstrates that deformation reflects competence contrasts rather than a through-going tectonic boundary. Similarly, the basal contact of the Serre Unit is defined only locally by a brittle–ductile low-angle normal fault of limited displacement (La Fracho Shear Zone of Nosenzo et al. Reference Nosenzo, Manzotti, Krona, Ballèvre and Poujol2024; Figure 2), and the same cover rocks assigned to this unit also occur in its footwall, indicating a detachment from the basement only during the very latest stages of Alpine evolution, an observation consistent with the coupled deformation of basement and cover documented in the Pellice Valley.
We therefore propose that tectonic contacts between ‘Basement Complex’ units can be confidently identified only where multiple criteria are simultaneously satisfied: (i) tectonically interleaved Permo–Mesozoic cover slices inexplicable by folding alone; (ii) well-constrained and regionally consistent differences in metamorphic conditions; (iii) clear structural evidence of localized deformation not attributable to competence contrasts alone; and eventually (iv) different age of Alpine metamorphism.
Applying these criteria, and given the coherent lithostratigraphic sequence, nearly identical UHP metamorphic conditions and absence of demonstrable nappe-bounding structures, we propose that the Chasteiran, Muret and Serre units, and their southern/northern equivalents, including the Ricordone Unit, constitute a single tectono-metamorphic entity that we name the Varaita-Susa Unit (Figure 15). The Rocca-Solei Unit (sensu Bonnet et al. Reference Bonnet, Chopin, Locatelli, Kylander-Clark and Hacker2022), however, is retained as a distinct tectonic slice, as it is bounded above by overturned and highly sheared remnants of cover sequences (Henry, Reference Henry1990). Also, the Brossasco-Isasca Unit likewise remains distinct because it records markedly different peak conditions (4.0–4.3 GPa and 700–730°C; Hermann et al. 2003; Ferrando et al. Reference Ferrando, Groppo, Frezzotti, Castelli and Proyer2017; Groppo et al. Reference Groppo, Ferrando, Gilio, Botta, Nosenzo, Balestro, Festa and Rolfo2019; Potočný et al. Reference Potočný, Kośmińska, Majka, Berent, Gilio and Pańczyk2026) and possibly a different palaeogeographic origin (Bonnet et al. Reference Bonnet, Chopin, Locatelli, Kylander-Clark and Hacker2022). The resulting structural architecture of the Dora-Maira Massif, defined primarily on mapping and structural criteria, comprises from top to bottom (Figure 15; Table S1): the Dronero Unit (blueschist-facies), the Varaita-Susa Unit (UHP coesite-chloritoid), the Rocca-Solei Unit (UHP coesite-chloritoid), the Brossasco-Isasca Unit (UHP coesite-kyanite) and the Pinerolo-Sanfront Unit (blueschist to blueschist-eclogite transition). This framework is broadly consistent with the classical scheme of Michard et al. (Reference Michard, Henry and Chopin1993) and Henry et al. (Reference Henry, Michard and Chopin1993), while incorporating recent advances. The status of the so-called San Chiaffredo Unit warrants further consideration. Although in this work we follow the tectonic boundaries proposed by Henry (Reference Henry1990) and Michard et al. (Reference Michard, Schmid, Lahfid, Ballèvre, Manzotti, Chopin, Iaccarino and Dana2022) and therefore regard the San Chiaffredo rocks as part of the Brossasco-Isasca Unit, the available P–T estimates are distinctly lower than those reported from the Brossasco-Isasca Unit s.s. and allow two alternative interpretations: (i) The San Chiaffredo rocks may indeed form part of the Brossasco-Isasca Unit (cf. Henry et al. Reference Henry, Michard and Chopin1993), but petrological evidence for UHP peak conditions may either not yet have been identified or may not have been preserved or (ii) they may represent a portion of the Pinerolo–Sanfront Unit, given that the P–T conditions reported by Groppo et al. (Reference Groppo, Ferrando, Gilio, Botta, Nosenzo, Balestro, Festa and Rolfo2019) are broadly comparable with those documented for the latter. In either case, the tectonic attribution and boundaries of the San Chiaffredo sub-unit warrant reconsideration in the light of additional structural and petrological constraints. Finally, based on our field mapping and structural observations, a mélange-type model for UHP rocks in the Dora-Maira Massif appears unlikely, given the coherent internal structure of the units described above (see discussions in Petroccia et al. Reference Petroccia, Nerone, Maffeis, Caso, Boero, Ghignone and Groppo2025).
11.d. Timing of metamorphism and structural evolution
The subdivision proposed in this contribution requires further validation, particularly to constrain the timing of metamorphism and deformation. For the Brossasco-Isasca Unit, several geochronological methods (e.g. U-Th-Pb of zircon, monazite, titanite and rutile) in different types of rocks (orthogneiss, micaschist, calcsilicate and eclogite) consistently indicate a well-defined age of 34–36 Ma commonly interpreted as dating the UHP metamorphic event (e.g. Tilton et al. Reference Tilton, Schreyer and Schertl1989; Tilton et al. Reference Tilton, Schreyer and Schertl1991; Duchêne et al. Reference Duchêne, Blichert-Toft, Luais, Télouk, Lardeaux and Albarède1997; Gebauer et al. Reference Gebauer, Schertl, Brix and Schreyer1997; Paquette et al. Reference Paquette, Montel and Chopin1999; Rubatto and Hermann, Reference Rubatto and Hermann2001; Di Vincenzo et al. Reference Di Vincenzo, Tonarini, Lombardo, Castelli and Ottolini2006; Chen et al. Reference Chen, Schertl, Zheng, Huang, Zhou and Gong2016, Reference Chen, Zhou, Zheng and Schertl2017; Gauthiez-Putallaz et al. Reference Gauthiez-Putallaz, Rubatto and Hermann2016; Xiong et al. Reference Xiong, Chen, Zhou, Schertl, Zheng and Huang2021; Bonnet et al. Reference Bonnet, Chopin, Locatelli, Kylander-Clark and Hacker2022). This event was subsequently followed by exhumation at 31–33 Ma (Rubatto and Hermann, Reference Rubatto and Hermann2001). On the other hand, geochronological constraints for the study area and the proposed Varaita-Susa Unit remain very limited and, in some cases, are inconsistent. The most recent estimates are provided by U-Pb dating of coesite-bearing garnet in micaschist from the Chasteiran locality by Manzotti et al. (Reference Manzotti, Millonig, Gerdes, Whitehouse, Jeon, Poujol and Ballèvre2025 a). Garnet cores suggest UHP metamorphism at 61 ± 3 Ma, whereas the Ca-rich garnet rims crystallized at 43 ± 9 Ma during decompression to ∼2.0 GPa. According to the same authors, rutile U-Pb geochronology yielded an age of 36.8 ± 4.1 Ma, overlapping with the garnet rim age. Additional constraints on the timing of peak metamorphism come from Ar-Ar geochronology; Scaillet et al. (Reference Scaillet, Féraud, Lagabrielle, Ballèvre and Ruffet1990) reported ages of 40.3 ± 0.6 Ma and 43.7 ± 0.2 Ma from orthogneiss of the Subiasco Valley, interpreted as recording peak metamorphic conditions. Similarly, Angiboust and Glodny (Reference Angiboust and Glodny2020) obtained Rb-Sr ages on white mica of 39.5 ± 0.4 Ma and 35.4 ± 2.3 Ma from the silvery micaschist of the Dora-Maira cover in the Chisone Valley, although these ages are interpreted as likely affected (especially the younger one) by late re-equilibration during exhumation. More recently, Bonnet et al. (Reference Bonnet, Chopin, Locatelli, Kylander-Clark and Hacker2022), based on rutile and titanite geochronology, proposed peak metamorphic ages for the Rocca-Solei and Ricordone units of the southern Dora-Maira Massif. The Ricordone Unit, here included in the Varaita-Susa Unit, yields an age of 40.1 ± 6.9 Ma, whereas the Rocca-Solei Unit records younger ages of 36.3 ± 3.3 Ma and 35.9 ± 3.1 Ma. Therefore, for the units grouped within the Varaita-Susa Unit, the ages of metamorphism overlap within uncertainty and do not provide evidence for distinct subduction timing that would support the existence of different tectonic slices. However, according to Reference Manzotti, Millonig, Gerdes, Whitehouse, Jeon, Poujol and BallèvreManzotti et al. (2025a ), rutile may re-equilibrate during cooling and decompression, implying that such ages could record retrograde conditions rather than the metamorphic peak. Consequently, if the interpretations of Reference Manzotti, Millonig, Gerdes, Whitehouse, Jeon, Poujol and BallèvreManzotti et al. (2025a ) are confirmed by additional data, the timing of metamorphism in the southern portion of the Dora-Maira Massif would need to be re-evaluated. Reference Manzotti, Schiavi, Ballèvre and NosenzoManzotti et al. (2025b ) group the Chasteiran Unit with the Muret Unit (in contrast with their previous subdivision; see Manzotti et al. Reference Manzotti, Schiavi, Nosenzo, Pitra and Ballèvre2022; Nosenzo et al. Reference Nosenzo, Manzotti, Krona, Ballèvre and Poujol2024), making their geochronological dataset directly comparable with previously published ages for the Muret and Ricordone units.
The peak metamorphic ages inferred from U-Pb geochronology of garnet cores are inconsistent with the Ar-Ar data of Scaillet et al. (Reference Scaillet, Féraud, Lagabrielle, Ballèvre and Ruffet1990). Moreover, an age of ∼60 Ma for UHP metamorphism associated with garnet cores is older than the peak metamorphic ages of the Piemonte-Ligurian units overlying the Dora-Maira (e.g. 53–45 Ma for the Monviso Unit; Duchêne et al. Reference Duchêne, Blichert-Toft, Luais, Télouk, Lardeaux and Albarède1997; Rubatto and Hermann, Reference Rubatto and Hermann2003; Rubatto and Angiboust, Reference Rubatto and Angiboust2015; Garber et al. Reference Garber, Smye, Feineman, Kylander-Clark and Matthews2020), which were subducted prior to the Briançonnais distal margin (Michard et al. Reference Michard, Henry and Chopin1993, Reference Michard, Schmid, Lahfid, Ballèvre, Manzotti, Chopin, Iaccarino and Dana2022; Schmid et al. Reference Schmid, Fügenschuh, Kissling and Schuster2004, Reference Schmid, Kissling, Dichl, van Hinsbergen and Molli2017; Ballèvre et al. Reference Ballèvre, Camonin, Manzotti and Poujol2020; Ghignone et al. Reference Ghignone, Sudo, Balestro, Borghi, Gattiglio, Ferrero and Van Schijndel2021; Herviou et al. Reference Herviou, Bonnet, Angiboust, Cambeses and Raimondo2025). This would imply either that the timing of the metamorphism for the Piemonte-Ligurian units is erroneous or that the palaeogeographic position of the Dora-Maira should be revised, two hypotheses that we consider unlikely. Instead, there is a broad overlap, within uncertainties, between Ar-Ar ages, rutile geochronology and garnet rim ages around 40–44 Ma. In our view, this age represents a reasonable approximation for the timing of UHP metamorphism of the Varaita-Susa Unit, also consistent with palaeogeographic reconstructions and available studies (see Michard et al. Reference Michard, Schmid, Lahfid, Ballèvre, Manzotti, Chopin, Iaccarino and Dana2022; Figure 13b). In the Gran Paradiso Massif, peak metamorphism is constrained at c. 42–41 Ma (Manzotti et al. Reference Manzotti, Rubatto, Zucali, Korh, Cenki-Tok, Ballevre and Engi2018) and D3 deformation phase occurred at c. 35–31 Ma (Bucher et al. Reference Bucher, Ulardic, Bousquet, Ceriani, Fügenschuh, Gouffon and Schmid2004; Michard et al. Reference Michard, Schmid, Lahfid, Ballèvre, Manzotti, Chopin, Iaccarino and Dana2022). The D3 timing can be reasonably extrapolated to the Dora-Maira transect, as significant along-strike variations in the timing of this event are unlikely (Michard et al. Reference Michard, Schmid, Lahfid, Ballèvre, Manzotti, Chopin, Iaccarino and Dana2022). Exhumation and cooling below c. 250°C occurred at around 30–27 Ma according to available fission track data (Gebauer et al. Reference Gebauer, Schertl, Brix and Schreyer1997; Sacchi et al. Reference Sacchi, Balestro, Cadoppi, Carraro, Delle Piane, Di Martino, Enrietti, Gallarà, Gattiglio, Martinotti and Perello2004; Beucher et al. Reference Beucher, van der Beek, Braun and Batt2012).
We suggest that future work should focus on high-resolution, methodologically consistent petrochronological studies across the entire massif to test the proposed subdivision and resolve the discrepancies between existing techniques.
11.e. Nappe emplacement and kinematics
Structural observations from the Chisone, Germanasca and Pellice valleys reveal a remarkably consistent kinematic framework that closely matches previous regional interpretations of the southern Dora-Maira Massif. The predominance of a uniform top-to-the-W/SW transport direction across both the HP-related (S2) and greenschist-facies (S3) fabrics (see also Dana et al. Reference Dana, De Cesari, Iaccarino, Montomoli, Corno, Rubatto and Carosi2026) is consistent with the regional shear sense documented throughout the massif by numerous authors (Laurent and Etchecopar, Reference Laurent and Etchecopar1976; Mertz and Siddans, Reference Mertz and Siddans1985; Philippot, Reference Philippot1990; Wheeler, Reference Wheeler1991; Henry et al. Reference Henry, Michard and Chopin1993; Michard et al. Reference Michard, Henry and Chopin1993; Avigad et al. Reference Avigad, Chopin and Le Bayon2003). Overall, the tectonic evolution of the Dora-Maira Massif is characterized by a predominantly non-coaxial flow regime, involving a dominant simple-shear component coupled with a significant pure-shear contribution (Henry et al. Reference Henry, Michard and Chopin1993). This deformation produced a large-scale west-to southwest-directed ductile shear zones that accommodated the progressive juxtaposition and exhumation of the different tectonic units. Although Philippot (Reference Philippot1990) reported local top-to-the-E kinematic indicators, Henry et al. (Reference Henry, Michard and Chopin1993) demonstrated that these structures can be readily explained by the pure-shear component of the regional deformation and therefore do not require opposite large-scale transport directions. Within this regional kinematic framework, deformation was strongly heterogeneous and strain-partitioned across all scales. Strain localization was largely controlled by rheological contrasts between lithologies, allowing the preservation of UHP mineral assemblages and even Variscan magmatic fabrics within relatively low-strain domains surrounded by high-strain mylonitic zones (Nosenzo et al. Reference Nosenzo, Manzotti, Poujol, Ballèvre and Langlade2022; Dana et al. Reference Dana, De Cesari, Iaccarino, Montomoli, Corno, Rubatto and Carosi2026). Likewise, the pervasive greenschist-facies re-equilibration observed along the contact between the Pinerolo Unit and the overlying Varaita–Susa Unit in parts of the Chisone Valley (Cadoppi, Reference Cadoppi1990; Wheeler, Reference Wheeler1991) indicates that earlier thrust contacts were reworked during late-stage ductile shearing.
Several tectonic models have been proposed to explain the exhumation of the Dora-Maira Massif. Some interpretations (Laurent and Etchecopar, Reference Laurent and Etchecopar1976; Gasco et al. Reference Gasco, Gattiglio and Borghi2011) emphasized a long-lived history of west-directed non-coaxial shearing, where the units remained mechanically coupled within a subduction channel during progressive exhumation from eclogite-to greenschist-facies conditions. Wheeler (Reference Wheeler1991) instead proposed a two-stage evolution involving the buoyant extrusion of eclogitized continental slices followed by extensional thinning of the thickened orogenic wedge. Similarly, Michard et al. (Reference Michard, Henry and Chopin1993) argued that early exhumation from mantle depths required forced return flow or tectonic extrusion, whereas later exhumation within the crust was dominated by gravitational collapse (and extension) of the thickened Penninic wedge. Avigad et al. (Reference Avigad, Chopin and Le Bayon2003) reached a comparable conclusion, but interpreted the late-stage extensional structures as the expression of lateral spreading of the mid-to upper crust towards the foreland rather than classical extrusion wedges.
Unfortunately, most of the tectonic models proposed so far do not take into account the significant syn-to post-Oligocene counterclockwise rotations of the Western Alps (see review of Crouzet et al. Reference Crouzet, Aubourg, Rochette, Collombet, Vandamme, Ménard and Gattacceca2025). The amount of counterclockwise rotation varies from place to place between 25° and 50° along the internal parts of the Alps. Hence the original kinematics probably was rather top NW to NNW in pre-Oligocene times.
Our observations for the D3 deformation phase are consistent with the regional greenschist-facies mylonitic event recognized by Henry et al. (Reference Henry, Michard and Chopin1993) and Michard et al. (Reference Michard, Henry and Chopin1993), during which earlier thrust contacts were progressively reactivated as low-angle extensional shear zones. The present-day architecture of the Dora-Maira Massif was largely controlled by rheological contrasts, which governed strain localization and the progressive transposition of tectonic contacts (Henry et al. Reference Henry, Michard and Chopin1993; Dana et al. Reference Dana, De Cesari, Iaccarino, Montomoli, Corno, Rubatto and Carosi2026). Consequently, many structures previously interpreted as major nappe-bounding discontinuities are more plausibly explained as localized shear zones developed along lithological competence contrasts. Despite this pronounced strain partitioning, the overall kinematic evolution remained remarkably coherent, preserving a persistent top-to-the-W/SW sense of shear from peak metamorphic conditions through greenschist-facies exhumation in present-day coordinates.
12. Conclusions
Our multiscale and multidisciplinary approach allows conclusions related to the origin, the metamorphic evolution, the lithostratigraphic subdivisions and the tectonic assembly of the Dora-Maira Massif.
-
1. Field mapping and detrital zircon geochronology indicate that the Permian–Upper Cretaceous cover of the Dora-Maira Massif records the evolution of the Briançonnais distal margin, from Permian pelites to a thinned Triassic platform and Jurassic–Cretaceous basinal deposits with limited detrital input. The sequence is only locally preserved as folded slices or tectonic slivers along main tectonic contacts.
-
2. The P–T–d evolution of the Permo–Mesozoic cover is indistinguishable from that of the underlying basement. This observation suggests that any detachment of the cover rocks from the polycyclic basement of the Dora-Maira Massif, if it ever occurred, would be very late in the structural history, well after the Alpine metamorphic peak, and it would also postdate the main ductile deformation phases analysed in the area.
-
3. Based on lithostratigraphic continuity, structural relationships and identical UHP Alpine conditions, we propose that the Chasteiran, Muret and Serre units represent a single tectono-metamorphic entity. Previous subdivisions of the so-called ‘Basement Complex’, largely based on discontinuous petrological criteria, are not consistently supported by field evidence and new P–T data.
-
4. A new subdivision (Dronero Unit, the newly defined Varaita-Susa Unit, Rocca Solei Unit, Brossasco-Isasca Unit and Pinerolo-Sanfront Unit) provides the simplest and most coherent explanation for the structural and metamorphic architecture of the Dora-Maira Massif. This interpretation is consistent with the broader extent of UHP metamorphism documented in recent studies and anticipated by petrological-thermomechanical models, although further work is needed in the northernmost sector to fully assess its metamorphic evolution.
Supplementary material
The supplementary material for this article can be found at: https://doi.org/10.1017/S0016756826101083.
Data availability statement
All data generated or analysed during this study are included in this article and its supplementary information files.
Acknowledgements
Thorsten Markmann is thanked for assistance with LA-ICP-MS analyses; Simona Cavagna and Luca Pacchiega are thanked for their support with cathodoluminescence imaging; Stefano Ghignone, Federica Boero and Marco Bruno are thanked for their help with coesite inclusions. Stefan M. Schmid and André Michard are thanked for early discussions about the geology of the Dora-Maira Massif. Stefan is especially thanked for reading an early draft of the manuscript, and Christian Chopin for his careful reading of the final work. Electron microprobe analyses were performed at the EMP facility of the Unitech COSPECT at the University of Milan (Italy). We appreciate the support and assistance of Stefano Poli and Andrea Risplendente during the EMP analyses. We gratefully acknowledge the financial support provided by ISPRA and Regione Piemonte. We sincerely thank Manuel Roda and Guillaume Bonnet for their valuable reviews, which substantially contributed to improving this manuscript. We also thank Olivier Lacombe for his excellent editorial handling. We thank Stefano Dolce, Chiara Scabin, Andrea Bigongiari and Simone Lenci for their support in the field work.
Author’s contributions
Davide Dana: Writing – original draft, Validation, Methodology, Investigation, Formal analysis, Data curation, Conceptualization. Francesco De Cesari: Writing – review & editing, Investigation, Methodology, Formal analysis, Data curation. Salvatore Iaccarino: Writing – review & editing, Writing – original draft, Methodology, Validation, Supervision, Investigation, Formal analysis, Data curation, Conceptualization. Chiara Montomoli: Writing – review & editing, Writing – original draft, Validation, Supervision, Methodology, Investigation, Formal analysis, Conceptualization. Alberto Corno: Writing – review & editing, Methodology, Formal analysis, Data curation. Daniela Rubatto: Writing – review & editing, Methodology, Formal analysis, Data curation. Alessandro Borghi: Writing – review & editing, Formal analysis, Data curation. Rodolfo Carosi: Writing – review & editing, Funding acquisition, Supervision, Investigation, Formal analysis, Conceptualization, Project Administration.
Financial support
This research was supported by funds from the CARG Project – Geological Map of Italy 1:50,000 Sheet “172 - Pinerolo” (Resp. Prof. R. Carosi).
Competing interests
The authors declare that they have no competing interests.


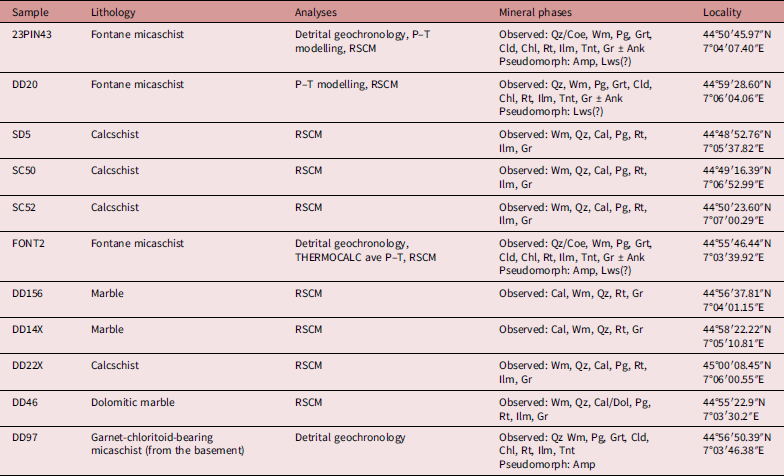


 Open access

