Implications
Titanium dioxide (TiO2) is commonly added as an inert marker to broiler diets to enable diet digestibility to be determined. This study demonstrates that an inductively coupled plasma optical emission spectrophotometer (ICP-OES) assay could replace the commonly used UV-spectroscopy assay for the determination of TiO2 concentration in poultry diets and ileal digesta. This is advantageous because the ICP-OES assay used in this study has comparatively greater detection limits and sensitivity than the UV-spectroscopy assay. In addition, the ICP-OES assay enables TiO2 determination to be incorporated into other mineral concentration analyses.
Introduction
Inert digestibility markers added to broiler diets eliminate the need to evaluate quantitative feed intake and excreta output, and enable nutrient utilisation to be examined along the gastrointestinal tract (Short et al., Reference Short, Gorton and Wiseman1996). Inert markers must maintain digestive transit at the same speed as other dietary nutrients in the tract and be physiologically inactive, as well as being non-toxic, easily analysed, able to be homogenously mixed into a diet, indigestible and non-absorbed (Jagger et al., Reference Jagger, Wiseman, Cole and Craigon1992; Titgemeyer et al., Reference Titgemeyer, Armendariz, Bindel, Greenwood and Löest2001). Titanium dioxide (TiO2) has some advantages over the commonly used chromic oxide (Cr2O3), with studies showing improvements in reproducibility and homogeneity (Jagger et al., Reference Jagger, Wiseman, Cole and Craigon1992). TiO2 is also approved for use as a feed additive by the Food and Drug Administration, unlike Cr2O3 (Titgemeyer et al., Reference Titgemeyer, Armendariz, Bindel, Greenwood and Löest2001). Another commonly used marker is acid-insoluble ash, but it has been suggested that its digestive transit does not accurately reflect that of feed passage (Cheng and Coon, Reference Cheng and Coon1990).
The method most widely used to determine TiO2 concentration is UV-spectroscopy, primarily based around the method of Short et al. (Reference Short, Gorton and Wiseman1996). This method involves the initial hydrolysis of the sample with sulphuric acid (H2SO4) followed by a colour reaction. An intense orange/yellow colour results from the addition of hydrogen peroxide (H2O2) to an acidic titanium (Ti) solution, and the colour intensity can be quantified by UV-spectrometry. This method has been used successfully in several species including poultry (Short et al., Reference Short, Gorton and Wiseman1996), cattle (Titgemeyer et al., Reference Titgemeyer, Armendariz, Bindel, Greenwood and Löest2001) and pigs (Jagger et al., Reference Jagger, Wiseman, Cole and Craigon1992), but some authors reported being unable to achieve reliable results using this process (Myers et al., Reference Myers, Ludden, Nayigihugu and Hess2004).
In poultry research, TiO2 as a dietary marker has been used successfully to determine calcium and phosphorus utilisation (Walk et al., Reference Walk, Bedford and McElroy2012). Mineral digestibility and utilisation in poultry is frequently analysed by inductively coupled plasma optical emission spectrophotometer (ICP-OES) in preference to UV methods as the ICP-OES assay can be used to analyse many elements in one preparation. Ti concentration can be detected by ICP-OES, which suggests that there is potential for TiO2 measurement to be made concurrently with mineral content, thus reducing analysis time and resource use.
A comparison between a UV-spectroscopy assay and ICP-OES assay for determination of TiO2 has previously been investigated by Boguhn et al. (Reference Boguhn, Baumgärtel, Dieckmann and Rodehutscord2009) in turkey diets and digesta. In this paper, it was suggested that there was incomplete recovery of TiO2 for both assays used, and hence values read to be lower than expected. However, detailed inspection of the results of the turkey data presented by Boguhn et al. (Reference Boguhn, Baumgärtel, Dieckmann and Rodehutscord2009) confirms that for some of the samples the readings were higher than expected when the UV-spectroscopy assay was used, and lower than expected when the ICP-OES assay was used. This suggests that potentially neither, or just one, of the assays is producing values that are representative of the TiO2 concentration in the sample. It is possible that the UV-spectroscopy assay is amplifying the value, and the ICP-OES assay is not detecting all the TiO2 in the sample. The conclusion made by Boguhn et al. (Reference Boguhn, Baumgärtel, Dieckmann and Rodehutscord2009) that both assays can be used to determine TiO2 may therefore be questionable. Rodehutscord et al. (Reference Rodehutscord, Dieckmann, Witzig and Shastak2012) have subsequently used ICP-OES to analyse TiO2 concentration in broiler ileal digesta, indicating that the new ICP methodology is an attractive prospect to workers in the field, but highlighting that this is an area that requires further validation. Therefore, the aim of this study was to investigate consistency of TiO2 recovery from an ICP-OES and a UV-spectroscopy assay, and evaluate whether the ICP-OES assay can be used as an alternative to the UV-spectroscopy assay for the determination of TiO2 as a marker in poultry digestibility studies.
Material and methods
Birds and husbandry
For experiment 1, Ross 308 male broilers (n=452) were involved in a series of digestion studies to determine ileal digesta recovery of TiO2 either by UV-spectroscopy by the method of Short et al. (Reference Short, Gorton and Wiseman1996), or by an ICP-OES assay. Birds were fed 1 of 19 experimental diets in mash form, each with TiO2 added at 5 g/kg: 6 semi-synthetic starch dextrose-based diets and 13 more commercial style diets based on cereals including wheat, rapeseed, maize and rye, and soya bean meal. All the 19 diets were analysed for TiO2 concentration. Each diet was fed to a minimum of 20 birds. All birds were from breeder flocks aged 42 to 45 weeks and were obtained from a commercial hatchery on the day of hatch. Chicks were randomised by weight and placed in 0.64 m2 floor pens in groups of four, bedded on clean wood shavings. Birds were allowed ad libitum access to the treatment diets and water for the duration of the trials, which spanned between 2 and 4 weeks. The room was thermostatically controlled to produce an initial temperature of 32°C and reduced to 21°C by day 21. The lighting regimen used was 24 h light on day 1, with darkness increasing by 1 h/day until 6 h of darkness was reached and this was maintained throughout the remainder of the study. Birds were euthanised by cervical dislocation. Digesta sample collection was carried out on a total of 144 14-day-old birds, 144 21-day-old birds and 164 28-day-old birds. At each bird age, digesta was pooled per pen of four birds, and averaged across diet. Digesta content was removed from the intestinal section distal to the Meckel’s diverticulum and proximal to the ileo–ceco–colonic junction of each bird. The digesta samples were then freeze-dried and ground through a 1 mm screen.
For experiment 2, Ross 308 male broilers (n=176) were fed a diet that contained no TiO2 from day 0 to 42. The birds were from a breeder flock aged 43 weeks, and were obtained from a commercial hatchery on the day of hatch. Chick placing, room temperature and lighting regime were as previously described. Birds were allowed ad libitum access to the treatment diets and water for the duration of the trial. Digesta content was removed from the intestinal section distal to the Meckel’s diverticulum and proximal to the ileo–ceco–colonic junction of each bird. The samples were freeze-dried and ground through a 1 mm screen. TiO2 was subsequently added to the digesta samples at 0, 5, 10, 15 and 20 g/kg to encompass the range found in poultry digestibility studies.
All feed and digesta samples from both experiments 1 and 2 were analysed for TiO2 concentration by both the UV-spectroscopy and ICP-OES assays described below.
Calibration standards
About 250 mg TiO2 was dissolved in 100 ml of 7.4 M H2SO4 and diluted to 500 ml with distilled water to produce a standard Ti solution of 0.5 mg/ml. This standard solution was used to prepare the calibration curve for both the UV-spectroscopy and ICP-OES assays. For the ICP-OES assay, the TiO2 standard solution was diluted with ultrapure water in varying increments to produce standards between 0 and 10 ppm. These standards were measured on an ICP-OES (Optima 2100 DV ICP-OES, model PQ Excell VG Elemental; Perkin-Elmer, Shelton, CT, USA) set to detect Ti at wavelength 334.936 nm, and a calibration curve was derived from the readings. For the UV-spectroscopy assay, graded volumes of TiO2 standard solution was pipetted into individual 100 ml volumetric flasks and made up to 10 ml with 7.4 M H2SO4. About 10 ml 30% H2O2 was then added to the solutions and the contents were made up to 100 ml with distilled water before measurement on a spectrophotometer (Unicam Helios, Berkshire, UK) set at 410 nm.
UV-spectroscopy assay
The UV-spectroscopy assay was based on the study by Short et al. (Reference Short, Gorton and Wiseman1996). Briefly, triplicate aliquots (∼0.3 g) of each digesta sample and five replicates of each of the 19 feed samples were ashed in porcelain crucibles for 16 h at 650°C. Once cooled, 10 ml H2SO4 (7.4 M) was added to each crucible and the samples were heated for ∼1 h until completely dissolved. The contents were then transferred quantitatively into 100 ml volumetric flasks via filter papers (Whatman 541) using distilled water. About 10 ml of 30% H2O2 was then added to each flask and the flasks made to volume with distilled water. Solutions were thoroughly mixed before reading on a spectrophotometer set at 410 nm. Sample analysis was repeated if the Z-value between the same samples exceeded 5%.
ICP-OES assay
For the ICP-OES assay, an aqua regia digestion step was carried out according to Association of Official Analytical Chemists 985.01. Briefly, 10 ml of aqua regia (35.5 to 37.5% hydrochloric acid and 68 to 72% nitric acid at a ratio of 3 : 1) was added to 50 ml glass conical flasks containing triplicate aliquots (∼0.5 g) of each digesta sample and five replicates of each feed sample, and left at room temperature (14.4°C±0.15 s.e.m.) for a minimum of 12 h. The samples were then boiled until completely dissolved, for ∼1 h. The contents were then filtered through Whatman 541 filter papers into 50 ml volumetric flasks and made to volume with ultrapure water, before transfering into 15 ml tubes. The samples were assayed on an ICP-OES set to detect Ti at wavelength 334.936. Sample analysis was repeated if the Z-value between the same samples exceeded 5%. Four digesta samples were repeated using a reduced sample size (∼0.2 g) with eight replicates to assess whether smaller quantities of material were viable for the assay.
Statistical analysis
All data were analysed using IBM SPSS statistics version 21. T-tests were conducted to differentiate between means. The relatedness of the readings from each assay was investigated using Pearson product–moment correlation coefficient, and interpretations of the strength of the relationship between the two methods were based on guidelines by Cohen (Reference Cohen1988); weak relationship r=0.10 to 0.29, medium relationship r=0.30 to 0.49 and strong relationship r=0.50 to 1.0. Linear regressions were calculated using the true and measured Ti concentrations. Significance was accepted at P<0.05.
Results and discussion
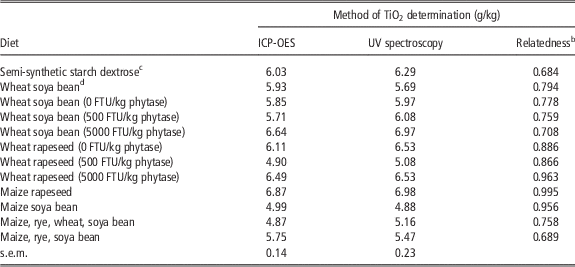
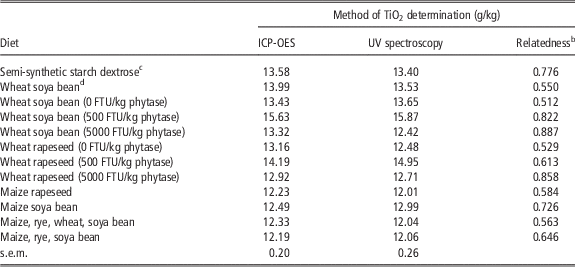
There were no significant differences between any TiO2 concentrations measured by the UV-spectroscopy assay and the ICP-OES assay. There were consistently strong relationships between the two methods for analysis of TiO2 concentration in the diets (Table 1) and ileal digesta (Table 2). This suggests that the ICP-OES assay used in this study is successful at identifying diet and ileal digesta TiO2 concentration, and hence has the potential to replace the widely used UV-spectroscopy assay.
Relatedness of an ICP-OES assay and UV-spectroscopy assay for determination of TiO2 concentration in broiler dietsFootnote a (experiment 1)

ICP-OES=inductively coupled plasma optical emission spectrophotometer; TiO2=titanium dioxide; Ti=titanium.
a The average of a minimum of five replicates per diet, measured as per kg feed.
b Strength of the relationship between the ICP-OES and UV-spectroscopy method for Ti measured in each diet where confidence in the result is P<0.05.
c The average measured TiO2 content of six semi-synthetic starch dextrose-based diets.
d The average measured TiO2 content of three wheat soya bean meal-based diets.
Relatedness of an ICP-OES assay and UV-spectroscopy assay for the determination of TiO2 concentration in broiler ileal digestaFootnote a (experiment 1)
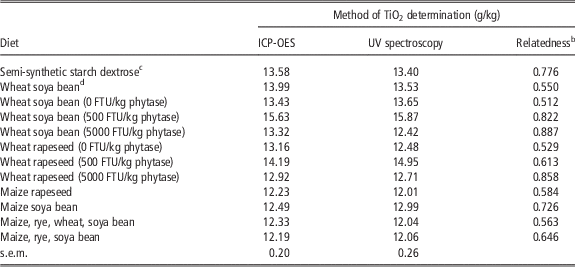
ICP-OES=inductively coupled plasma optical emission spectrophotometer; TiO2=titanium dioxide; Ti=titanium.
a The average response of a minimum of 20 birds per diet, 452 birds in total, with digesta samples collected at age 14, 21 or 28 days post-hatch. Analysis was replicated a minimum of three times per digesta sample.
b Strength of the relationship between the ICP-OES and UV-spectroscopy method for Ti measured in each digesta sample where confidence in the result is P<0.05.
c The average measured TiO2 content of ileal digesta from birds fed one of 6 semi-synthetic starch dextrose-based diets, from 32 birds per diet, 192 birds in total, fed as 8 pens of 4 birds per diet.
d The average measured TiO2 content of ileal digesta from birds fed 1 of 3 wheat soya bean meal-based diets, from 64 birds per diet, 192 birds in total, fed as 16 pens of 4 birds per diet.
The ICP-OES assay had to be modified to analyse ileal digesta samples in experiment 1 as some of the samples contained TiO2 levels that saturated the ICP-OES detector, which compromised the sensitivity of the measurement. When a smaller sample size (0.2 g) was analysed, the samples all read in the optimum necessary range for detection by the ICP-OES, and therefore smaller quantities can be universally used to avoid any need to dilute the samples with ultrapure water. Coefficients of variation for the smaller sample size were <5%.
Relatedness between the two methods in determination of ileal digesta TiO2 was numerically greater when phytase was included in the diets (Table 2). Phytase improves digestibility and therefore increases TiO2 digesta content (Rutherfurd et al., Reference Rutherfurd, Chung, Morel and Moughan2004). The sensitivity of the UV-spectroscopy assay decreases as TiO2 concentration decreases (Boguhn et al., Reference Boguhn, Baumgärtel, Dieckmann and Rodehutscord2009), whereas the sensitivity of the ICP-OES assay is consistent and not dictated by concentration in the sample. This suggests that in the presence of high TiO2 concentration, such as in the digesta samples from birds fed phytase, the two assays were similar in sensitivity; however, in the samples with lower TiO2 concentration, the similarity in sensitivity between the two assays reduced, and the UV-spectroscopy assay was comparatively less reliable. This also potentially explains why observed deviances in TiO2 level in the diet away from the supplemented 5 g/kg were greater when analysed by UV-spectroscopy than by ICP-OES. The observed deviances are likely because dietary TiO2 levels were measured per kg feed.
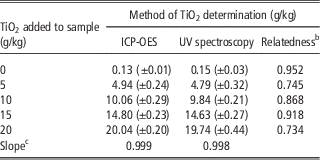
In this study, there were no significant differences between the measured values, or between the calculated slopes determined by the two assays for the analytical recoveries of TiO2, whereas previous research has shown marked differences between the two assays (Boguhn et al., Reference Boguhn, Baumgärtel, Dieckmann and Rodehutscord2009). In addition, Boguhn et al. (Reference Boguhn, Baumgärtel, Dieckmann and Rodehutscord2009) found that the values from the ICP-OES assay were lower than the expected values, which was not the case in this study (Tables 1 and 2). This may be because of the shorter digestion time used (25 min in contrast to 60 min), and therefore there may have been incomplete dissolution of the samples. Further verification of full Ti recovery was made in the second study where known amounts of Ti were added to digesta before quantification analysis via both methods. This found consistently strong relationships between the two methods at the different TiO2 supplementation levels in the digesta samples (Table 3) and that the slopes produced by both methods were almost identical. The observed recovery of supplemented TiO2 was 97.62% by the UV-spectroscopy assay and 98.77% by the ICP-OES assay in this study.
Calculated slopes of linear regressions and relatedness of an ICP-OES assay and UV-spectroscopy assay for the determination of TiO2 recovery at different levels in broiler ileal digestaFootnote a (±s.e.m.) (experiment 2)
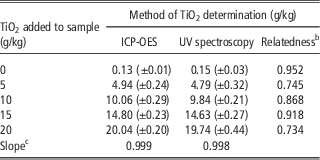
ICP-OES=inductively coupled plasma optical emission spectrophotometer; TiO2=titanium dioxide; Ti=titanium.
a The average response of spiked digesta pooled from 176 birds aged 42 days post-hatch. Analysis was replicated 10 times per sample.
b Strength of the relationship between the ICP-OES and UV-spectroscopy method for Ti measured in each digesta sample where confidence in the result is P<0.05.
c Linear regressions where y was the measured Ti concentration and x was the true Ti concentration.
The main advantage of the ICP-OES assay when compared with the UV-spectroscopy is that the former has been shown to be more sensitive at quantitative analysis with improved detection limits. The ICP-OES assay is also less time-consuming, and the ICP-OES enables several elements to be detected in parallel, which reduces preparation time and the amount of sample, and hence potentially the number of birds required.
There are, however, some advantages to the UV-spectroscopy assay compared with the ICP-OES assay. The ICP-OES assay is more expensive owing to the cost to run the ICP-OES and to maintain the argon gas supplies, although this is mitigated by the potential for concurrent mineral analysis. The ICP-OES assay is also more hazardous as it involves the use of aqua regia, which is moderately more corrosive than H2SO4. Furthermore, the detection range is greater in the UV-spectroscopy method which reduces any potential need for dilution of samples; however, in this study, a reduced sample weight (0.2 g) was shown to overcome any requirement for dilution with the ICP-OES method.
In conclusion, the ICP-OES assay used in this study was successful in determining TiO2 added as an inert marker in broiler digestibility studies and could replace the widely used UV-spectroscopy assay. The ICP-OES assay is more sensitive at quantitatively analysing TiO2 concentration, consumes less time than the UV-spectroscopy assay and allows the TiO2 determination to be carried out concurrently with other mineral analysis by ICP-OES. However, it is essential that the current sample weight (0.2 g digesta) is used for detection.
Acknowledgements
The authors would like to express thanks to Mary Smith for her assistance with the ICP-OES technique, and gratefully acknowledge ABVista Feed Ingredients for funding Natalie Morgan's PhD project.