When a bilingual is reading in one language, does it matter that they know another? Knowledge of another language affects both production (e.g., Ringbom, Reference Ringbom, Cenoz, Hufeisen and Jessner2001) and comprehension (e.g., Marian & Spivey, Reference Marian and Spivey2003), even when this knowledge is not necessary. Termed cross-linguistic influence, this phenomenon has been observed in a variety of languages and situations. In visual word recognition, evidence for cross-linguistic influence comes largely from studies involving cognates, or words that have the same meaning and form across two languages, such as orange in English and French. Compared to words existing in only one language, cognates are consistently processed and produced faster and more accurately in an array of psycholinguistic tasks, such as lexical decision (Dijkstra et al., Reference Dijkstra, Grainger and van Heuven1999; Duyck et al., Reference Duyck, van Assche, Drieghe and Hartsuiker2007; Van Assche et al., Reference Van Assche, Duyck and Brysbaert2013), progressive demasking (Dijkstra et al., Reference Dijkstra, Miwa, Brummelhuis, Sappelli and Baayen2010), sentence reading (Libben & Titone, Reference Libben and Titone2009), and naming (Costa et al., Reference Costa, Caramazza and Sebastian-Galles2000; Kroll & Stewart, Reference Kroll and Stewart1994).
This “cognate effect” and other examples of cross-linguistic influence are taken as evidence that bilinguals’ languages are not stored and activated separately from one another in a bilingual’s mind; instead, they are “co-activated” in a variety of contexts. This phenomenon is not unlimited, however. First, the strength of the effects depends on the degree of similarity between two words. For example, identical cognates are recognized faster than those that are similar in form but not identical, sometimes to a degree out of proportion to the difference in similarity level (Dijkstra et al., Reference Dijkstra, Miwa, Brummelhuis, Sappelli and Baayen2010; Duyck et al., Reference Duyck, van Assche, Drieghe and Hartsuiker2007). Another important aspect is that cross-linguistic influence is largely asymmetrical; effects observed in L2 are often reduced or absent in L1 (Gollan et al., Reference Gollan, Forster and Frost1997; Jiang, Reference Jiang1999; Keatley et al., Reference Keatley, Spinks and De Gelder1994). The Sense Model (Finkbeiner et al., Reference Finkbeiner, Forster, Nicol and Nakamura2004) posits that as more senses are typically known for words in the L1 than in the L2 (at least for unbalanced bilinguals), priming asymmetry can be attributed to the fact that L1 words are mapped to more lexical semantic senses in the mind than L2 words, and thus when an L2 word is presented, it does not co-activate enough of the senses of its L1 counterpart to influence task performance.
Since the effect of cross-linguistic influence is reduced when similarity is low and when reading in the native language, the question arises as to what happens when bilinguals of different-script languages read in the L1. In Japanese and English, for example, cognates (e.g., バナナ /banana/ and banana) do not share orthographic form and vary in degree of phonological and semantic similarity. While cross-linguistic influence has been observed in the L2 across different-script languages (Allen & Conklin, Reference Allen and Conklin2013; Gollan et al., Reference Gollan, Forster and Frost1997; Kim & Davis, Reference Kim and Davis2003; Miwa et al., Reference Miwa, Dijkstra, Bolger and Baayen2014), it is as yet unknown whether and to what extent the L2 affects L1 word recognition. The present study thus investigates (1) whether cross-linguistic influence occurs when different-script bilinguals read in their native language, and if so, (2) whether such effects are similar in both language directions (i.e., from L1 to L2 as well as from L2 to L1).
Cross-linguistic influence in visual word recognition
While early word recognition studies simply divided items into cognate or noncognate categories, evidence is accumulating for orthographic (O), phonological (P), and semantic (S) overlap as three separate factors influencing word recognition and response times (Dijkstra et al., Reference Dijkstra, Grainger and van Heuven1999; Lemhöfer and Dijkstra, Reference Lemhöfer and Dijkstra2004). Furthermore, identical cognates, which overlap on all three of these dimensions, have been observed to produce stronger cognate effects than nonidentical cognates (Dijkstra et al., Reference Dijkstra, Miwa, Brummelhuis, Sappelli and Baayen2010; Duyck et al., Reference Duyck, van Assche, Drieghe and Hartsuiker2007). Effects are also additive across languages; when trilinguals read, cognates shared by three languages are read faster than those shared by just two (Lemhöfer et al., Reference Lemhöfer, Dijkstra and Michel2004). Additionally, effects are different in forward (L1 to L2) and backward (L2 to L1) directions. For example, effects of L1 primes on L2 word recognition are typically greater than effects of L2 primes on L1 recognition (Gollan et al., Reference Gollan, Forster and Frost1997; Jiang Reference Jiang1999; Keatley et al., Reference Keatley, Spinks and De Gelder1994). It may be that some of the asymmetry is due to differences in L1 and L2 proficiency; Davis et al. (Reference Davis, Sánchez-Casas, García-Albea, Guasch, Molero and Ferré2010) found similar cross-linguistic effects in both directions for proficient bilinguals, whereas beginning bilinguals only demonstrated effects of L1 on L2.
While such effects are reduced in the native language, this does not mean that cross-linguistic influence is absent. Recent studies have observed cognate effects in L1 processing, showing that L2 knowledge is activated when reading in a dominant L1. In German lexical decision with German–Dutch bilinguals, for example, Lemhöfer et al. (Reference Lemhöfer, Huestegge and Mulder2018) found that near-cognate Dutch misspellings (e.g., STOCK - stok “stick”) were more difficult to reject than non-cognate nonwords. Such effects are not limited to isolated word reading; van Assche et al. (Reference Van Assche, Duyck, Hartsuiker and Diependaele2009) observed that L1–L2 cognates were read more quickly than non-cognates when Dutch–English bilinguals read L1 sentences. Similarly, English cognate facilitation effects were found by Cop et al. (Reference Cop, Dirix, van Assche and Drieghe2017) in Dutch (L1) novel reading. Cop et al. concluded that despite the semantic restriction presented by reading exclusively in one language, the L2 was active in L1 reading, although context did attenuate the effects. In a meta-review of sentence reading studies, Lauro and Schwartz (Reference Lauro and Schwartz2017) concluded that effects are reduced in sentences with high semantic constraint relative to low constraint sentences, although effects are significant in both contexts. The authors further point out that language (i.e., L1 vs. L2) and the task at hand also modulate this cross-linguistic influence.
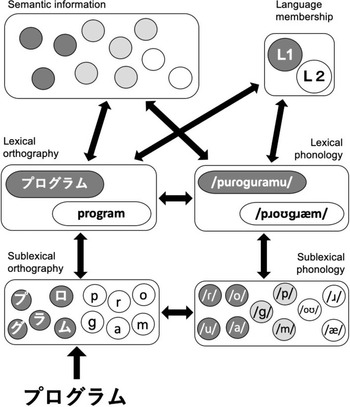
These findings can be explained by the BIA+ model of bilingual visual word recognition (Dijkstra & van Heuven, Reference Dijkstra and van Heuven2002), according to which language co-activation can begin even at the earliest stages of processing. When a word is read, orthographic information is first activated in the mind, followed by its phonology, meaning, and language membership information. Words from both languages a bilingual knows are stored in an integrated mental lexicon, so wherever information is shared across languages, such as form and meaning in the case of cognates, related words from the other language may become co-activated. Figure 1 presents a visualization of this architecture for Japanese–English bilinguals reading a Japanese katakana item from the present study (see also Degani et al., Reference Degani, Prior and Hajajra2018 for visualizations of the architecture for same-script and different-script bilinguals more generally).
An Adaptation of the Word Recognition Subsystem of the BIA+ model (Dijkstra & van Heuven, Reference Dijkstra and van Heuven2002) for Japanese–English cognates used in this study. The dark gray denotes L1 (Japanese) information, white denotes L2 (English) information, and light gray represents information shared across the two languages.

Cross-linguistic influence with different-script languages
An important issue with BIA+ is that this and other recent models of bilingual word recognition (e.g., Multilink; Dijkstra et al., Reference Dijkstra, Wahl, Buytenhuijs, van Halem, Al-Jibouri, de Korte and Rekké2019) were created around and are largely supported by evidence from same-script languages such as Dutch and German. In order to develop truly general word processing models, evidence from different-script languages is needed so that models can be tested and potentially extended (Mishra, Reference Mishra2019). Such studies are also needed to verify earlier findings of cross-linguistic phonological similarity. Dijkstra et al. (Reference Dijkstra, Grainger and van Heuven1999) acknowledge the difficulty of examining phonological similarity without confounding it with orthographic similarity, which is challenging in alphabetic languages as orthography more or less reflects phonology. As the majority of support for phonological similarity effects came from same-script languages, gathering evidence from bilinguals of different-script languages, such as Hebrew and Arabic (which use different alphabets) or English (which uses the Roman alphabet) and Chinese (which is a logographic script), can help confirm that the observed effects are indeed due to shared phonology and not simply shared orthography.
With different-script bilinguals, cross-linguistic influence has been found mainly in priming studies. In L2 lexical decision and semantic categorization, Korean–English bilinguals responded faster when presented with a semantically equivalent L1 prime than with an unrelated one (Kim & Davis, Reference Kim and Davis2003). In a naming task, however, phonological similarity but not semantic similarity influenced performance. The authors explain that different task requirements modulate cross-linguistic priming effects. Similar results have been found with other different-script languages. In a study by Nakayama et al. (Reference Nakayama, Sears, Hino and Lupker2012), phonologically similar L1 primes were facilitatory in L2 lexical decision with Japanese–English bilinguals. Degani et al. (Reference Degani, Prior and Hajajra2018) observed that both L1 phonology and semantic information influenced semantic decisions about L2 targets with Arabic–Hebrew bilinguals. More specifically, cognate primes facilitated semantic decisions, while false cognate primes led to more incorrect responses. In each of these studies, the authors suggest that these priming effects are due to cross-language phonological and/or semantic co-activation which occurs even though the languages in question have different orthographic scripts.
The priming methods used in these different-script studies are generally considered helpful for examining the time course of lexical processing. By presenting an item as a prime before the target word appears, it is assumed that the item is activated (or becoming active) in the mind by the time the target is presented. There are a few drawbacks to priming, however. While it is thought to involve automatic mental processes, it is difficult to attribute priming effects to a single simple mechanism (Forster, Reference Forster1998). Furthermore, Marsolek (Reference Marsolek2008) asserts that processing advantages attributed to priming in visual object identification may be conflated with costs associated with antipriming, or a slowing down of processing after an unrelated word is presented. It is possible that visual representations of word forms are stored and accessed in a similar way to representations of objects, and if so, word recognition studies may also confuse priming benefits with antipriming costs. Indeed, Zhang et al. (Reference Zhang, Fairchild and Li2017) found antipriming effects in Chinese character identification. As the above different-script priming studies did not include a baseline condition (i.e., trials with no prime), it is difficult to determine to what extent positive priming effects are genuinely facilitatory. Converging evidence from different methodologies is needed to clarify the nature of these findings.
Another issue with priming is that it does not occur spontaneously in real-world reading. Therefore, cross-linguistic effects observed in these studies cannot be taken as evidence that bilingual word reading is always nonselective or whether it is a phenomenon that simply occurs in an experimental setting. It is thus important to determine whether cross-linguistic effects also occur in reading without priming being used. A few recent studies have begun to look for such evidence. Without using priming, Allen and Conklin (Reference Allen and Conklin2013) found Japanese–English bilinguals responded more slowly to L2 lexical decision targets that were more similar in meaning to their L1 counterpart, although increased phonological similarity resulted in faster responses. In a similar task, Miwa et al. (Reference Miwa, Dijkstra, Bolger and Baayen2014) observed facilitatory effects of both phonological and semantic similarities as well as L1 word frequency. The authors assert that these are truly bilingual effects as they were not found when English monolinguals completed the experiment.
Using eye movement data, Miwa et al. (Reference Miwa, Dijkstra, Bolger and Baayen2014) observed effects of cross-linguistic phonology emerging early in time, although the direction changed from inhibitory early on to facilitatory later in time. These data give insight into contradictory results from other studies; while some found phonological similarity to speed responses (e.g., Miwa et al., Reference Miwa, Dijkstra, Bolger and Baayen2014), others found it to slow them (e.g., Allen & Conklin, Reference Allen and Conklin2013). It may be that cross-linguistic effects are neither simply inhibitory nor facilitatory; the direction of effects may change in different stages of lexical activation. An additional possibility offered by Peleg et al. (Reference Peleg, Degani, Raziq and Taha2020) is that languages with greater overlap (e.g., those with the same writing system like Dutch and English) will show interference, while less similar languages (such as those with different scripts like Japanese and English) will demonstrate facilitation.
The lack of evidence from different-script bilinguals
Presuming a mature L2 system, BIA+ does not explicitly predict L1 and L2 processing differences. With L1-dominant bilinguals, however, the “temporal delay assumption” of BIA+ proposes that L1 words may become activated more quickly due to higher resting-level activation potentials (i.e., it is more frequently used than the L2). As a result, L2 information may not have time to become activated, in which case cross-linguistic effects would not be observed in L1 reading.
From the perspective of the BIA+ model, there are a few obstacles to cross-linguistic influence occurring in the L1 with this population. First, language-specific orthography provides an unambiguous language membership cue from the earliest stages of processing (i.e., as orthographic representations are activated). While this does not preclude influence from shared phonology or semantics, it may be that the reader is more quickly able to identify the target as the other language is not being co-activated from the start via shared orthography. In this case, we would not see significant cross-linguistic influence on processing. Some evidence (e.g., Allen & Conklin, Reference Allen and Conklin2013; Miwa et al., Reference Miwa, Dijkstra, Bolger and Baayen2014), however, shows that at least in the L2, nontarget information does have time to become activated. Similar effects have yet to be observed in L1 reading, but we see no reason why language-specific orthography alone would prevent co-activation in L1 but not L2.
A second obstacle is that with L1-dominant bilinguals, BIA+ expects a slowing down of L2 relative to L1. The model attributes this to differences in resting-level activation; as unbalanced bilinguals use L1 more often, L1 words have a resting potential closer to the activation point than those in the L2, which are less frequently used. Faster activation of L1 may mean that L2 phonology and semantics do not have time to become co-activated to the extent that processing is affected. Similarly, Lemhöfer and Dijkstra (Reference Lemhöfer and Dijkstra2004) note that there may be a different deadline set for L1 as opposed to L2; in lexical decision, bilinguals may take more time before deciding whether or not an L2 target is a real word than they would an L1 target, which may have a shorter deadline for decision. In this case also, there may not be enough time for L1 processing to be affected by L2 knowledge. Whether a temporal delay is related to differences in resting potential or in decision deadlines, we would not observe significant cross-linguistic influence on L1.
In the event that L2 does have time to become co-activated during L1 reading, previous research suggests that effects may be reduced in L1 relative to L2 (Gollan et al., Reference Gollan, Forster and Frost1997; Jiang Reference Jiang1999; Keatley et al., Reference Keatley, Spinks and De Gelder1994). If cross-linguistic effects are observed in both languages, we expect the effect size to be smaller during L1 reading as L2 is used less often by our participants and therefore has a lower interference potential. Furthermore, the direction of the effects may be different in each language. For example, Miwa et al. (Reference Miwa, Dijkstra, Bolger and Baayen2014) found phonological similarity to initially have an inhibitory effect in L2 lexical decision, although the direction changes to facilitation by the time participants responded. It may be that increased phonological similarity is facilitatory overall in the L2, whereas in the L1 it serves to slow responses as this language is typically read faster. Finally, because of this temporal delay of L2, the point in time at which each factor comes into play may be different in each language, or an effect found during L2 processing (such as semantic similarity, which may arise later in time than phonological similarity effects) may not have time to significantly affect performance in L1.
Aims of the present study
Priming studies have found cross-linguistic influence in L2 with bilinguals of different-script languages. As demonstrated by Allen and Conklin (Reference Allen and Conklin2013) and Miwa et al. (Reference Miwa, Dijkstra, Bolger and Baayen2014), nonselective activation occurs when Japanese–English bilinguals read in English even without first presenting a Japanese prime. From the viewpoint of the BIA+ model, nonselective activation may not be limited to L2. Same-script studies have indeed found that L2 information becomes activated in L1 word recognition, and with different-script bilinguals, Degani et al. (Reference Degani, Prior and Tokowicz2011) found bidirectional semantic influence in semantic similarity ratings of English word pairs. Therefore, it is possible that the cross-linguistic effects found in L2 lexical decision by Allen and Conklin (Reference Allen and Conklin2013) and Miwa et al. (Reference Miwa, Dijkstra, Bolger and Baayen2014) are also influential in L1 word recognition even with different-script languages.
The present study extends the findings of Miwa et al. (Reference Miwa, Dijkstra, Bolger and Baayen2014) to the L1 and examines the time course of word recognition with different-script bilinguals reading in both L1 and L2. We aim to determine: (1) whether the same cross-linguistic effects, namely phonological similarity, semantic similarity, and nontarget word frequency, influence lexical decisions in each language; (2) if so, whether the direction of each effect is the same in L1 and L2 (i.e., whether they facilitate or inhibit processing); and (3) whether these effects arise at the same point in time in both languages.
To do so, we test Japanese–English bilinguals’ performance in Japanese and English lexical decision tasks while recording their eye movements. We check whether the cross-linguistic effects of interest affect performance above and beyond commonly tested lexical, task, and participant variables known to affect lexical decision responses. To directly compare L1 and L2 word recognition processes, the same participants and items (i.e., English–Japanese cognates) are tested in each language.
Method
Participants
Thirty-two Japanese–English late bilinguals were recruited at a national university in Japan. All were native Japanese speakers who had studied English as a foreign language for at least 6 years. While participants had attained at least a low-intermediate English proficiency, they used mainly Japanese in daily life (see the descriptive data in Table 1 for participants’ LexTALE vocabulary size test scores).
Descriptive statistics for lexical, task, and participant predictors included in this study
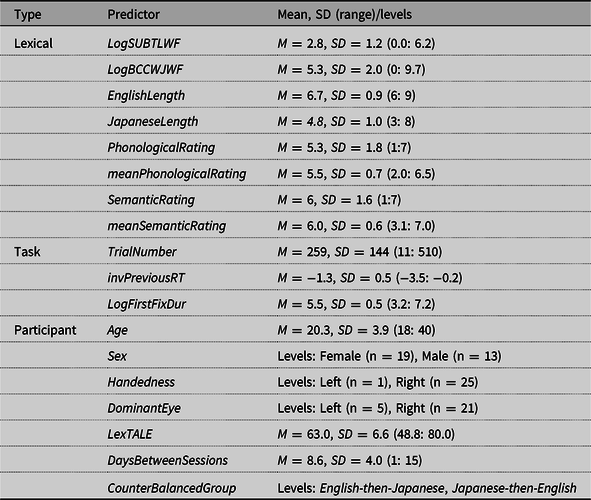
Note. Listed are the original values before standardization procedures were carried out. Log indicates a log-transformed variable, and inv indicates an inversely transformed variable. LogSUBTLWF serves as the TargetWF measure for the English data, and LogBCCWJWF represents the NonTargetWF, while the opposite is true for the Japanese data. EnglishLength and JapaneseLength comprise the TargetLength measure for the English and Japanese data, respectively.
Lexical decision with eye tracking
The most commonly used task in psycholinguistics (Libben & Jarema, Reference Libben and Jarema2002), lexical decision, is useful for examining the impact of an array of factors on the word recognition process. Response times from this task have been found to be significantly correlated with eye movements observed during sentence reading (Schilling et al., Reference Schilling, Rayner and Chumbley1998). However, response times alone do not allow us to examine the underlying time course of lexical activation (Carreiras et al., Reference Carreiras, Armsrtong, Perea and Frost2014). As eye tracking is a sensitive measure allowing us to examine the time course in detail while also avoiding the drawbacks of priming, we tracked participants’ eye movements while they completed lexical decision tasks.
Under the assumption of Just and Carpenter’s (Reference Just and Carpenter1980) eye mind hypothesis, the amount of time a reader takes to recognize a word is reflected in the amount of time they spend looking at it. Eye movement tracking is thus considered helpful for understanding the moment-to-moment nature of naturalistic word reading (Rayner, Reference Rayner1998; Rayner et al., Reference Rayner, Chace, Slattery and Ashby2006). Commonly used with sentence or text reading (e.g., Cop et al., Reference Cop, Dirix, van Assche and Drieghe2017; Libben & Titone, Reference Libben and Titone2009), eye tracking is not as frequently used in isolated word reading studies, which may be due to an assumption that the eye does not move when just one word is read. A few investigations (Hyönä et al., Reference Hyönä, Laine and Niemi1995; Kuperman et al., Reference Kuperman, Schreuder, Bertram and Baayen2009; Miwa et al., Reference Miwa, Dijkstra, Bolger and Baayen2014; Miwa & Dijkstra, Reference Miwa and Dijkstra2017), however, have demonstrated that the eye does indeed move, typically producing multiple fixations that allow us to examine factors influencing different stages of processing.
Two lexical decision studies employing eye tracking have found that eye movements observed early and late in time are, respectively, co-predicted by processes arising during early and late stages of lexical activation. Examining Dutch compound processing, Kuperman et al. (Reference Kuperman, Schreuder, Bertram and Baayen2009) considered first fixation duration and left subgaze duration as early measures of processing, while left subgaze duration and overall subgaze duration represented the later processing measures. They concluded that while properties associated with the early eye movement measures were associated with the left compound, the later measures reflected processes tied to the right compound. Similarly, in English lexical decision, Miwa et al. (Reference Miwa, Dijkstra, Bolger and Baayen2014) found that predictors co-determining overall response times in lexical decision were also the predictors that co-determined eye movements. Specifically, first fixation durations, the earliest predictor in their analysis, was affected by the early effects of word frequency and orthographic neighborhood density, first subgaze durations were influenced by early lexical effects, and last fixations were more influenced by conscious decision processes.
Materials
Modern written Japanese includes a mixture of words written in three scripts, logographic kanji (Chinese), syllabic hiragana, and syllabic katakana. Making up over 6% of printed characters (Chikamatsu et al., Reference Chikamatsu, Yokoyama, Nozaki, Long and Fukuda2000), katakana is used to add emphasis, for onomatopoeia, for scientific terms, and importantly for our study, for Japanese words of foreign origin. For example, バニラ, the Japanese word meaning “vanilla,” is written in the katakana script where the three katakana characters, バ, ニ, and ラ, represent the syllables /ba/, /ni/, and /ɾa/, respectively. We focus on katakana as a large number of English words have katakana script translation equivalents in regular use in Japanese, providing a large body of cognates with varying degrees of phonological and semantic overlap across the two languages.
This study tests reading of 250 English words and their Japanese katakana translation equivalents (cognates), listed in Table A1. The English stimuli included the same 250 nouns used by Miwa et al. (Reference Miwa, Dijkstra, Bolger and Baayen2014). As the study by Miwa and colleagues was conducted in an L2 context (i.e., Canada), the present study partially serves to replicate it in a Japanese context as it is possible that L2 word processing is different for bilinguals primarily using L1 day to day. Originally sampled from the English Lexicon Project Database (Balota et al., Reference Balota, Yap, Cortese, Hutchison, Kessler, Loftis, Neely, Nelson, Simpson and Treiman2007), the items include monomorphemic words between 6 and 9 letters in length with an occurrence of greater than 2,000 in the HAL frequency distribution (Burgess & Livesay, Reference Burgess and Livesay1998).
The Balanced Corpus of Contemporary Written Japanese word list (BCCWJ; Maekawa et al., Reference Maekawa, Yamazaki, Ogiso, Maruyama, Ogura, Kashino, Koiso, Yamaguchi, Tanaka and Den2014) was used to find Japanese katakana translation equivalents for each of the English items. If multiple katakana counterparts were found in the corpus for any one English word (e.g., ネーチャー and ナチュール for nature), the most commonly occurring variant or a variant in its full form was selected (e.g., ダイヤグラム over ダイヤ). Whenever the corpus did not supply a translation equivalent written in katakana script, the English word was transcribed in katakana (i.e., transliteration), referring to an English-to-katakana converter (Ben Bullock, © 1994-Reference Bullock2017, http://www.sljfaq.org/cgi/e2k.cgi) as well as an online dictionary (Goo 辞書, 2017; https://dictionary.goo.ne.jp/), verifying that the transliteration was listed in the dictionary. Resulting katakana items were between three and eight characters in length.
Two hundred and fifty nonwords were also included so that each lexical decision task totaled 500 trials. To generate the nonwords, pseudoword generator Wuggy (Keuleers & Brysbaert, Reference Keuleers and Brysbaert2010) was used to find 250 English-like pseudowords matched to the 250 real words in terms of subsyllabic segments, letter length, and transition frequencies. The overlap ratio between words and nonwords was set to two-thirds. To sample katakana nonwords for the Japanese task, the English nonwords were transcribed into katakana using the same converter used for transcribing the real words. Any time a resulting pseudo-katakana item was an existing word (e.g., streat ストリート), a new English pseudoword candidate was generated in Wuggy. If katakana pseudowords were found in the BCCWJ corpus (e.g., クリース, シュック, チャージ), regardless of meaning, the nonword sampling procedure was repeated until all candidates were confirmed to be nonwords, that is, not listed in BCCWJ.
Apparatus
Lexical decision tasks were conducted using Experiment Builder software (SR Research, Canada). Participants wore an EyeLink II head-mounted eye tracker (SR Research, Canada), and eye movements were tracked (pupil-only mode; sampling rate of 250 Hz). Except for one participant whose left eye was tracked, right eye movements were recorded. The same software in non-eye tracking mode was also used to develop and conduct two cross-linguistic similarity rating tasks (detailed below), which were conducted to gather ratings to serve as the operationalized cognateness effect.
Two-session design
This study was conducted in two sessions. The order of presentation of the lexical decision tasks was counterbalanced; in other words, half of participants completed English lexical decision in session 1 and Japanese lexical decision in session 2, while the order of languages was reversed for the other half of the group. Twenty-seven of the 32 participants completed both sessions, of the remaining five, two completed English only, and three completed Japanese only. Therefore, this study includes English reading data for 29 participants, Japanese reading data for 30, and rating task data for 27. Half of the English task data for one participant was not recorded due to technical error. Participants were paid for their participation at the conclusion of each session.
Session 1
In session 1, participants’ hand and eye dominance were checked and recorded. They answered the Japanese version of the Language Experience and Proficiency Questionnaire (LEAP-Q; Marian et al., Reference Marian, Blumenfeld and Kaushanskaya2007) and were given the opportunity to voluntarily report their most recent TOEFL ITP score. As a measure of proficiency, they completed the LexTALE English vocabulary size test (Lemhöfer & Broersma, Reference Lemhöfer and Broersma2012) on the computer using Experiment Builder software (SR Research, Canada). As none of the items in the LexTALE test overlapped with items in the main lexical decision tasks, they are not expected to have any significant influence on responses or eye movements. After completing LexTALE, participants wore an eye tracker while completing lexical decision in either English or Japanese.
Session 2
In the second testing session, participants completed lexical decision in the other language followed by the phonological similarity and semantic similarity rating tasks.
Procedure
English (L2) lexical decision
In a quiet, dim room, participants sat about 65 cm in front of a 17-inch Dell E773s CRT monitor (refresh rate: 85 Hz; screen resolution: 1024 × 768). Each word or nonword was presented in white on a black background. Items in this English (L2) task were displayed in size 50 Courier New, resulting in a one-letter width of 1.25 cm and a visual angle of 1.1 degrees, which is well within the fluent reading range of print size (Legge & Bigelow, Reference Legge and Bigelow2011).
The task began with 10 practice trials. Before and after the block of practice trials as well as after every 50 trials and after breaks, three-point horizontal calibrations were conducted. In each of the 500 trials, items appeared after participants fixed their eyes on a drift correct point, located at the center of the display. This enabled the device to correct for head movement throughout the experiment. Instructions presented on screen in Japanese asked participants to decide as quickly and accurately as possible whether or not each item was an English word. If they decided yes, they pressed the right back trigger button on a Microsoft SideWinder Plug & Play Game Pad. If they decided no, they pressed the left back trigger button. If no button was pressed within 5000 ms, the trial ended, and the next one began. It took approximately 30 minutes to complete this task.
Japanese (L1) lexical decision
Although the target language was Japanese instead of English, the procedure for L1 lexical decision was identical to that for the English task. Because the median word length for items in the English task was 7 (letters) and that for the Japanese katakana items was 5 (characters), the physical length for a 7-letter English word was matched with a 5-character Japanese word, both of which were 8.5 cm in length. Therefore, in the Japanese (L1) task, katakana items were displayed in 40-point MS Mincho, also a fixed-width font, so that the median lengths for katakana and English words were perceptually similar. One character was 1.7 cm wide (visual angle = 1.5 degrees).
Cross-linguistic similarity rating
Two rating tasks were conducted to obtain cross-linguistic phonological and semantic similarity measures. Pairs of target words from the lexical decision tasks were presented on the computer, an English item on the left and its Japanese katakana counterpart on the right. Words were displayed in black on a light gray background. Participants judged the phonological similarity of the two words and pressed the corresponding button on a Cedrus button box, ranging from 1, labeled “異なる” (different), to 7, labeled “完全に同じ” (identical). After 10 practice trials, participants made decisions about each of the 250 pairs. In addition to one break in the middle of the task, participants could rest at any time.
After rating phonological similarity, participants completed the same task, except that this time they rated similarity in meaning for each word pair. If they did not know the meaning of a word, they pressed a keyboard spacebar to skip the trial. It took approximately 35 minutes in total for participants to complete these two rating tasks.
Data analysis
As lexical decision response times are influenced by a variety of attributes of the items being tested, the participants, as well as the task itself (Baayen & Milin, Reference Baayen and Milin2010), mixed-effects regression models with subjects and items included as crossed random effects (Baayen, Davidson, & Bates, Reference Baayen, Davidson and Bates2008) are used to examine multiple variables simultaneously with one statistical model. All analyses were carried out using R software for statistical computing, version 3.6.3 (R Development Core Team, 2020).
Response and eye movement data from the lexical decision tasks were combined into one data frame with Language included as a categorical variable (Levels: English, Japanese). Participants’ individual cross-linguistic phonological and semantic similarity ratings as well as the group’s averaged measure were then added as predictor variables.
Dependent variables
This paper examines four different dependent variables: response times, first fixation duration, late fixation duration, and fixation counts. Lexical decision response times are examined as an overall measure of word recognition. Fixations occurring early and late in time during lexical decision have been taken to correspond to early and late stages of word processing, respectively (Kuperman et al., Reference Kuperman, Schreuder, Bertram and Baayen2009; Miwa et al., Reference Miwa, Dijkstra, Bolger and Baayen2014). Therefore, in this study, the duration of bilinguals’ first fixations on a word is taken as corresponding to early lexical recognition processes, and late fixation duration, or the sum of all fixations after the first until a response button was pressed, is taken to represent the later part of the lexical recognition process. Response times thus correspond to the sum of first fixation duration and late fixation duration. Using eye tracking in this way, we examine whether each variable influencing overall responses comes into play earlier or later in time, providing a more nuanced picture of the lexical activation process. Finally, as readers typically make more fixations when reading more challenging text (Rayner et al., Reference Rayner, Chace, Slattery and Ashby2006), fixation count, or the total number of fixations a participant makes on a word, is examined as a further measure of processing difficulty.
Predictor variables
Lexical, task, and participant variables are displayed in Table 1 and are introduced below. All numerical variables were standardized before analysis.
Task variables
Task-related variables expected to affect performance include: TrialNumber, the trial number (1-500); PreviousRT, the inversely transformed response time of the previous trial, and FirstFixDur, the log-transformed first fixation duration of the item (used only in the later fixation duration analysis). We predicted response times would be faster and fewer and shorter eye movements will be made as participants adjusted to the task (i.e., as the TrialNumber increases) and after shorter response times in the previous trial (i.e., invPreviousRT). Shorter FirstFixDur was expected to result in longer late fixation durations.
Item variables
TargetWF. Word frequency is one of the greatest contributors to response times; in that, more common words are usually responded to faster (Balota & Chumbley, Reference Balota and Chumbley1984; Brysbaert et al., Reference Brysbaert, Mandera and Keuleers2018; Duyck et al., Reference Duyck, Vanderelst, Desmet and Hartsuiker2008). For English words, the target word frequency measure (TargetWF) is taken from the SUBTLEX-US movie subtitle database (Brysbaert & New, Reference Brysbaert and New2009). For Japanese words, TargetWF was taken from the Balanced Corpus of Contemporary Written Japanese (BCCWJ; Maekawa et al., Reference Maekawa, Yamazaki, Ogiso, Maruyama, Ogura, Kashino, Koiso, Yamaguchi, Tanaka and Den2014). In cases where a katakana word occurred more than once in BCCWJ, the two frequencies were added into one combined measure. TargetWF is expected to have a facilitatory effect on all dependent measures in both languages. In other words, participants will respond faster to and make shorter and fewer eye fixations on more commonly occurring words.
NonTargetWF. The study by Miwa et al. (Reference Miwa, Dijkstra, Bolger and Baayen2014) found Japanese word frequency effects in English word reading, suggesting that L1 knowledge becomes active during L2 processing in this population. As the shared phonological and semantic information of an L2 English word may become active when its Japanese cognate is being read, it is suspected that L2 word frequency may have an effect on processing in the L1 task as well. Therefore, we also test nontarget word frequency (NonTargetWF) in both L1 and L2 tasks.
For the Japanese words, NonTargetWF is the SUBTLEX-US English word frequency, while for the English words it is the BCCWJ Japanese frequency. If processing is similarly nonselective in both L1 and L2, NonTargetWF will likely have a facilitatory effect in both languages.
TargetLength. TargetLength corresponds to the number of letters or katakana characters making up each word. Similar to O’Reagan and Jacobs (Reference O’Reagan and Jacobs1992) and Balota et al. (Reference Balota, Cortese, Sergent-Marshall, Spieler and Yap2004), longer words are expected to be recognized and responded to more slowly than shorter words. They are also expected to result in longer and more numerous fixations.
Cross-linguistic phonological and semantic similarities. Two different measures of phonological and semantic similarity are considered. First, as in past studies (e.g., Dijkstra et al., Reference Dijkstra, Miwa, Brummelhuis, Sappelli and Baayen2010; Allen & Conklin, Reference Allen and Conklin2013), all participant ratings were gathered into one averaged measure for each item (meanPhonologicalRating; meanSemanticRating). In contrast to previous studies, however, individual participants’ ratings (PhonologicalRating; SemanticRating) are also tested. Because the exact same bilinguals completed lexical decision and contributed cross-linguistic similarity ratings, we can compare participants’ unique ratings with the group’s averaged judgment to determine which better predicts performance.
Participant variables
When one paper reports the results of multiple experiments, it is common that the participant groups consist of similar – yet different – individuals recruited from the same general population. As noted by Friesen et al. (Reference Friesen, Whitford, Titone and Jared2020), however, an array of individual differences such as proficiency and cognitive factors can affect word recognition. In this study, we test the exact same group of individuals reading in both languages, allowing us to include reading language (English or Japanese) as a within-participant variable. Testing the same participants and items (i.e., cognate translation equivalents) allows for a more genuine comparison between L1 and L2.
To check whether any memory of the cognates presented in the first session affected performance in the second session, we included DaysBetweenSessions, the number of days between testing sessions, and CounterBalancedGroup, whether the participant first completed lexical decision in English (English-then-Japanese) or Japanese (Japanese-then-English). We also considered participant: Age; Sex; Handedness, whether they were right- or left-handed; DominantEye, whether their dominant eye was right or left; and LexTALE, their score on the LexTALE English vocabulary size test (Lemhöfer & Broersma, Reference Lemhöfer and Broersma2012).
Results
Below, we first discuss overall response times, followed by the three eye movement measures (i.e., first fixation duration, late fixation duration, and fixation count). In each of the four analyses, cross-linguistic phonological and semantic similarity ratings are included as a predictor variable. Individual and averaged measures are both tested, and the best predictor in each analysis is included as a fixed effect in the final models reported below. When individuals’ ratings were compared with the group’s averaged ratings, the two measures demonstrated a moderate correlation (r = 0.43 for PhonologicalRating and meanPhonologicalRating; r = .41 for SemanticRating and meanSemanticRating).
For both response time and eye movement measures, no significant main effects were found for the following individual variables: number of days between testing sessions (DaysBetweenSessions; p = .25), participant Age (p = .38), Handedness (p = .41), DominantEye (p = .89), Sex (p = .60), CounterBalancedGroup (p = .89), or LexTALE score (p = .15). Therefore, they are not included in the final models. While three main effects, namely Language, TargetWF, and meanSemanticRating, were found to be somewhat attenuated by proficiency (i.e., they interacted with LexTALE test score), it is not included in the final models reported here as it is not a main variable of interest in this study (but see Figures A1, A2, and A3 for visualizations of its significant interactions with Language, TargetWF, and meanSemanticRating, respectively).
Response times
The range of response times was checked to verify the accuracy of data recorded. Unsurprisingly, real words were generally responded to more quickly than nonwords. Each participant’s average accuracy (English task: n = 29; Japanese task: n = 30) was calculated for all items (M = 88%; median accuracy = 89%; range: 74% – 99%) and for words only (M = 89%; median = 90%; range = 76.4% – 98.8%). No participant’s data were excluded. Average accuracy for each item was also calculated, and items responded to correctly by less than 60% of participants (6% of items) were removed.
To attenuate skewness in the data, all values were transformed for analysis. Inverse transformation (−1000/RT) was selected to transform response times by using the Box–Cox power transformation technique (Box & Cox, Reference Box and Cox1964). The response time for the previous trial, also inversely transformed, was included as a predictor variable (PreviousRT). Practice trials, nonword trials, those with an incorrect response, and those with theoretically implausible response times of 300 ms or less (less than 1% of the data) were removed, leaving 12,910 data points. Descriptive statistics for response times are listed in Table 2.
English and Japanese lexical decision response results

Unless noted, the linear mixed-effects models (Baayen et al., Reference Baayen, Davidson and Bates2008) reported in this paper are set using a forward-fitting procedure used to determine the random effects structure. While some advocate a maximal random-effects structure (Barr et al., Reference Barr, Levy, Scheepers and Tily2013), we have opted for a more parsimonious model, using likelihood ratio tests to determine which should be included (Bates et al., Reference Bates, Kliegl, Vasishth and Baayen2015; Matuschek et al., Reference Matuschek, Kliegl, Vasishth, Baayen and Bates2017). A backward-fitting procedure was used to select the fixed effects, starting with the most complex model and making use of AIC values and p-values to determine which should be included in the final model. Two-way interactions between lexical, task, and participant variables were also checked.
The final model fitted to response times includes random effects of item (SD = 0.09) and participant (SD = 0.23), and fixed effects are summarized in Table 3.
Fixed effects in the response latency analysis

In both L1 and L2, the slower a participant’s response on the previous trial (PreviousRT), the slower they responded on the following trial. As expected, facilitatory main effects of TrialNumber and target word frequency were found. Participants responded faster as the task progressed, an effect which did not depend on the language being presented. More common words were also responded to faster, although this effect was greater in English than in Japanese. Again as predicted, words with longer TargetLength were generally responded to more slowly than shorter words. This effect was more pronounced in L2 than in L1. Significant main effects and pairwise interactions of the final model are visualized in Figure 2.
Main Effects in the response time analysis. For effects that depended on language (i.e., trial, target word length, target word frequency, phonological similarity, and semantic similarity), the bottom (blue) line shows the effect in L1 (Japanese) and the top (pink) line shows the effect in the L2 (English) task. The nontarget word frequency effect was not dependent on language.

Importantly, all three cross-linguistic effects (visualized in the bottom three plots of Figure 2), namely nontarget word frequency, cross-linguistic phonological similarity, and cross-linguistic semantic similarity, were significant predictors in both L1 and L2 tasks. Nontarget word frequency (i.e., BCCWJ in the English task; SUBTLWF in the Japanese task) was facilitatory above and beyond the effect of target word frequency, an effect that did not depend on language. In other words, words whose cognate was common in the other language were responded to more quickly than words with comparatively rare cognates.
Both types of phonological similarity measures, individuals’ own and the group’s averaged ratings, were tested; while the group’s average was not a significant predictor, individual participants’ own ratings were. Therefore, the final model includes PhonologicalRating, which had a facilitatory effect, particularly in L1 (Japanese). For semantic similarity, both the group’s average and participants’ individual ratings were significant, but individual’s ratings were slightly superior. Thus, SemanticRating (each participant’s own rating) is included in the final model. Similar to phonological similarity, increased semantic similarity facilitated responses in that items rated as more similar in meaning to their cognate were responded to more quickly. This was true in both languages, albeit with somewhat greater effect size in L2 (97 ms in English vs. 89 ms in Japanese). There were no significant interactions between any of the three cross-linguistic variables (i.e., p-values were 0.22 or above).
As found by Miwa et al. (Reference Miwa, Dijkstra, Bolger and Baayen2014), the factors affecting response latencies also influenced eye movements. We investigated whether the influence of each of these factors arose at the earliest processing stages (i.e., first fixation duration) or later in the word recognition process (i.e., late fixation duration), and whether they affected the number of fixations participants made on each item (i.e., fixation count).
Eye movement data
Eye movement data were trimmed in the same manner as response time data, except that trials with blinks (680 data points) and those in which the participant made only one fixation (672 data points) were removed for this analysis. The remaining 12,655 data points were included for the first fixation duration and late fixation duration analyses.
First fixation duration
The first fixation duration measure consisted of the initial eye fixation participants made from the onset of presentation of each item. Trials with first fixations of 100 ms or under (747 data points) were eliminated before analysis. First fixation durations (M = 320.62; SD = 100.1) underwent an inverse-square root transformation to reduce skewness. Simple main effects as well as two-way interactions for lexical, individual, and task predictors were considered.
The final model (summarized in Table 4) includes random intercepts for participant (SD = 0.36) and item (SD = 0.10).
Fixed effects in the first fixation duration analysis

Except for cross-linguistic phonological and semantic similarities, effects found in the response time analysis also significantly affected first fixation durations. However, the direction and magnitude of effects were not the same. The TrialNumber effect, while again not statistically dependent on language, was opposite in direction from that in the response latency analysis. In both languages, participants made longer first fixations as the experiment progressed, suggesting that as participants became increasingly used to the task, they took in more information before moving their eyes. As with the response times, TargetWF was facilitatory; shorter first fixations were made on more common words.
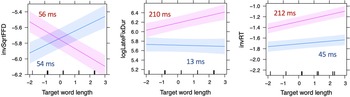
TargetLength (i.e., word length) was also a significant predictor, showing an interesting crossover effect dependent on language, visualized in Figure A4. For longer Japanese targets, first fixations were longer, while for longer English words, first fixations were shorter. In other words, participants were motivated to move on to successive fixations faster in the L2 when they perceived that the word was long.
It is possible that this is due to a greater perceptual span in L1 relative to L2. Participants could have been able to take in more information in the L1, or they may have needed to make more fixations in the L2 to take in enough information to identify the word. It is also possible that this is a function of differences between the two writing systems. Katakana characters represent a larger phonological unit than English letters, so for words of the same physical size, the number of English letters was greater than the number of Japanese katakana characters (English median length: 7 letters; katakana median length: 5 letters).
Notably, NonTargetWF was a significant predictor above and beyond that of target word frequency. This means that participants benefited from their knowledge of the word’s translation equivalent even at the earliest stages of processing. As in the response latency analysis, it was a facilitatory effect; the more frequent a word’s cognate in the other language, the shorter the initial fixation participants made.
Late fixation duration
Late fixation duration was equal to the sum of all fixations after the initial fixation. The late fixation durations (M = 489.2; SD = 359.1) were log-transformed for analysis. In the final model, the random effects structure consists of random intercepts for participants (SD = 0.35) and items (SD = 0.12) as well as by-subject random slopes for TrialNumber (SD = 0.05), TargetLength (SD = 0.07), and TargetWF (SD = 0.03). The results for the final model are summarized in Table 5.
Fixed effects in the late fixation duration analysis

In contrast to our predictions, first fixation duration (FirstFixDur) had a significant effect in that the longer a first fixation the participant made, the longer their later fixations were. While we expected shorter initial fixations would mean relatively less information is taken in initially, requiring more time be spent processing visual information later (i.e., longer late fixation duration), it seems this was not the case; participants spent more time reading at both initial and later fixations for harder to process words.
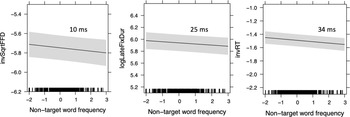
As in the response time analysis, TrialNumber was facilitatory. The TargetLength effect was also similar to the response time results in that longer words resulted in longer late fixations. This was especially true in the L2 (English). This effect is contradictory to the crossover effect seen at the first fixation. Because the effect at response is similar at late fixation but not first fixation, we see that the later stages of processing are what is mainly represented by response latencies. As found with both first fixations and response times, NonTargetWF (visualized in Figure A5) was facilitatory and did not depend on language. In other words, late fixation durations were overall shorter for words with more commonly occurring cognates.
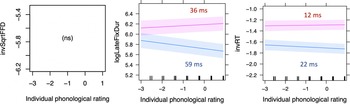
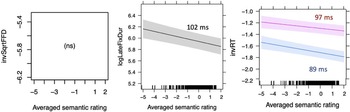
Both phonological similarity and semantic similarity were significant predictors at late fixation duration. The time courses of these effects are visualized in Figures 3 and 4.
The time course of the cross-linguistic phonological similarity effect. The bottom (blue) line shows the effect in L1 (Japanese), while the top (pink) line shows the effect in the L2 (English) task. Left pane = inversely transformed first fixation duration (FirstFixDur); middle pane = log-transformed late fixation duration (LateFixDur); right pane = inversely transformed response time (RT). Displayed effect sizes (in) were computed by subtracting the back-transformed predicted minimum of the fitted model from its predicted maximum value.

While it did not contribute to first fixation durations, individuals’ phonological similarity ratings (PhonologicalRating) were significant and depended on language at late fixation as well as response.
As with phonological similarity, the semantic similarity effect was significant at late fixation and response. In contrast to phonological similarity, however, the group’s averaged ratings of semantic similarity (meanSemanticRating) were superior to individuals’ judgments and did not depend on language at late fixation (although the effect on response times is language-dependent).
Fixation counts
Readers make more fixations when text is difficult (Rayner et al., Reference Rayner, Chace, Slattery and Ashby2006). To determine which factors affected fixation count, we opted for generalized linear mixed-effects models and checked for influence of the same variables examined in the response time analysis. The total fixation count for each trial was added to the trimmed lexical decision data for analysis (12,911 data points). The distribution of trials by fixation count in each language is outlined in Table 6, and the final model is summarized in Table 7.
Percentage of trials by fixation count in each language

Summary of the fixation count final model

Overall, the variables affecting fixation counts were similar to those affecting response times. Fewer fixations were made as the experiment progressed, that is, TrialNumber was facilitatory in both languages, slightly more so in L2 than in L1. Longer TargetLength was inhibitory in both languages, especially in English. Greater word frequency (TargetWF) resulted in fewer fixations in both languages, especially in Japanese. In other words, participants made fewer fixations as the experiments progressed, with shorter words, and with more frequent words, suggesting that processing was easier in these conditions. As in the late fixation duration analysis, the group’s averaged semantic similarity rating was more influential than the individual measure. Interestingly, the group’s averaged phonological rating, not the individual’s own ratings as in the response time and late fixation duration analyses, was the significant predictor for fixation counts. Both meanPhonologicalRating and meanSemanticRating were facilitatory; the higher the group rated the similarity, the fewer fixations they made on the word before pressing a response button. These effects did not depend on language. The frequency of each word’s cognate (NonTargetWF) was not found to be a significant predictor, unlike in the other analyses.
General discussion
This study examined cross-linguistic effects in visual word reading when different-script bilinguals read in the L1 and L2. Eye movements were tracked as participants completed lexical decision in Japanese and in English. We investigated whether visual word recognition is similarly nonselective in L1 as it has been found to be in L2. Specifically, we looked at (1) whether cross-linguistic phonological similarity, semantic similarity, and cognate word frequency influenced performance in both languages; (2) whether such effects are facilitatory or inhibitory; and (3) whether they arise at the same point in the time course of processing in each language. From the perspective of the BIA+ model, it is possible that effects of nonselectivity could arise in both directions. However, with L1-dominant, different-script bilinguals, effects in the L1 may be diminished or arise more slowly relative to those in the L2.
Overall, the pattern of activation was similar in both languages. In lexical decision, recognition was facilitated as the participant adjusted to the task and by words with greater frequency. Shorter word length also facilitated responses, but a crossover effect at first fixation suggests that that early visuospatial processes are somewhat different in Japanese and in English. Notably, the cross-linguistic measures of nontarget word frequency, phonological similarity, and semantic similarity all significantly influenced lexical decision responses in both L1 and L2, suggesting that L1 reading is similarly nonselective as is L2 reading (research question 1).
Examining the time course of recognition via eye movements, both the direction of cross-linguistic effects and the point in time in which they arose in each language (research questions (2) and (3), respectively) were largely comparable. Nontarget word frequency effects appeared as early as the first fixation duration and continued through to response, suggesting information from the other language comes into play early in time. This effect (visualized in Figure A5) was equally robust in Japanese as in English, and it was significant above and beyond that of target word frequency. It is possible that this effect arises early as a function of the language-specific writing systems; it may be that Japanese katakana characters and English letters quickly activate the sublexical phonological units without interference from the other language. Any shared sublexical phonological information then quickly becomes co-activated.
Neither cross-linguistic phonological nor semantic similarities (visualized in Figures 3 and 4, respectively) were significant at the earliest point in time (i.e., at first fixation), but both emerged at late fixation duration and also significantly influenced responses. As the BIA+ model supposes that cross-linguistic influence from phonology and semantics would emerge after orthography is first activated, this is a reasonable result. However, this does somewhat contrast with findings by Miwa et al. (Reference Miwa, Dijkstra, Bolger and Baayen2014), who observed phonological similarity effects emerging at first fixation. This discrepancy may be due to differences in context; while their study was conducted in an L2 environment, the present experiments were conducted in Japan where participants infrequently use English. It is possible that in this setting, L2 phonological information is activated more slowly than for bilinguals who mainly use the second language each day.
The time course of the cross-linguistic semantic similarity effect. The single (gray) line in the middle pane denotes the effect was not dependent on language. In the right pane, the bottom (blue) line shows the effect in L1 (Japanese), while the top (pink) line shows the effect in the L2 (English) task. Left pane = inversely transformed first fixation duration (FirstFixDur); middle pane = log-transformed late fixation duration (LateFixDur); right pane = inversely transformed response time (RT).

Notably, the phonological similarity effect observed in this study does differ in direction between languages. In English, it was inhibitory at late fixation duration, and while it does not become facilitatory in the end (as it did in Miwa et al., Reference Miwa, Dijkstra, Bolger and Baayen2014), its influence flattens out somewhat at response, with an effect size of just 12 ms. In the Japanese data, in contrast, phonological overlap facilitated recognition at late fixation duration and response. This discrepancy indicates that L2 words with more phonologically similar cognates were more difficult to identify, while in the L1, they were more easily recognized.
It is possible that this is due to the discrepancy in participants’ L1/L2 proficiencies, the temporal delay in recognizing L2 words relative to L1 targets, or a combination of these two factors. It may be that in L2 reading, more nontarget candidates become activated as participants likely know more words (and thus more phonological neighbors) in the L1, resulting in longer reading times before the correct word is identified. In L1, in contrast, comparatively fewer L2 candidates may become activated as fewer L2 words are known, leading to a faster selection. It could also be that during L1 reading, the temporal delay of L2 activation does not allow ample time for many related items to become activated before the L1 target is identified.
Increased semantic similarity speeded later eye fixations and responses in both languages, albeit with somewhat greater size in L2 at response (97 ms vs. 89 ms). Echoing the findings of Miwa et al. (Reference Miwa, Dijkstra, Bolger and Baayen2014), this result is fairly straightforward from the perspective of BIA+. As participants in this study were L1-dominant, it is unsurprising that L1 effects on L2 reading would be greater than in the other direction as resting activation levels are likely higher for L1 words. This finding reflects general observations of asymmetry in cross-linguistic influence (e.g., Gollan et al., Reference Gollan, Forster and Frost1997). However, it is interesting that despite the discrepancy in L1 and L2 proficiencies, semantic overlap still played a similar role in L1 processing as it did in L2, reinforcing the findings of bidirectional semantic influence by Degani et al. (Reference Degani, Prior and Tokowicz2011). In both languages, cross-linguistic conceptual information was activated as participants completed lexical decision.
Conclusion
To our knowledge, this is the first study to directly compare the time courses of visual word recognition in L1 and L2 with different-script bilinguals. Without using priming, we found cross-linguistic effects in isolated word reading not only in the L2 but also in the dominant L1. Importantly, the same cross-linguistic effects were found to affect performance in both languages, although to somewhat different degrees, and in the case of phonological similarity, in different directions.
Even for languages with different orthographic scripts, bilinguals’ knowledge of another language affected their reading even when the nontarget language was not necessary and when reading in the dominant L1. Future research is needed to determine whether this would hold true even in context (i.e., when reading sentences or paragraphs) or when the task demands are changed. Additionally, while it was not a main variable of interest in this study, further investigation is needed to determine the extent to which these findings remain true for bilinguals of different L2 proficiencies.
Acknowledgements
The authors would like to thank the editor, two anonymous reviewers, and Remi Murao for insightful and encouraging feedback on earlier drafts and Koji Miwa for his generous help at various stages of this project.
Conflicts of interest
We have no known conflicts of interest to disclose.
Appendix
Target materials used in this study

Note. Target items in this study include the same 250 English words sampled by Miwa et al., Reference Miwa, Dijkstra, Bolger and Baayen2014 (used with permission) and their Japanese katakana equivalents.
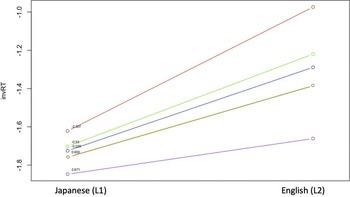
The language by proficiency interaction.
Note. Lines indicate different LexTALE scores, with lines higher along the Y-axis indicating lower LexTALE test scores. Higher values along the Y-axis indicate slower response times. The left side of the graph indicates participants’ response times in Japanese (L1), while the right side shows response times in English (L2).
All participants responded faster in L1 than L2. Participants with greater English proficiency (i.e., higher LexTALE scores indicated by lower lines) responded more quickly in L1 as well as L2 compared to participants with lower proficiency as measured by LexTALE score.

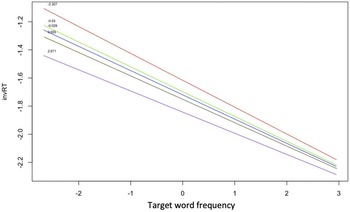
The target word frequency by proficiency interaction.
Note. Lines indicate different LexTALE scores, with lines higher along the Y-axis indicating lower LexTALE test scores. Higher values along the Y-axis indicate slower response times.
All participants responded more quickly as word frequency increased, with those with higher English proficiencies (i.e., higher LexTALE scores) responding more quickly overall than those with lower proficiencies.

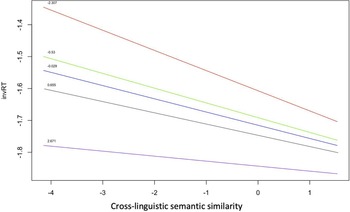
The semantic similarity by proficiency interaction.
Note. Lines indicate different LexTALE scores, with lines higher along the Y-axis indicating lower LexTALE test scores. Higher values along the Y-axis indicate slower response times.
All participants responded more quickly as semantic similarity (i.e., meanSemanticRating) increased, with those with higher English proficiencies (i.e., higher LexTALE scores) responding more quickly overall than those with lower proficiencies.

The time course of the target length effect.
Note. The blue line shows the effect in L1 (Japanese), while the pink line shows the effect in the L2 (English) task. Left pane = inversely transformed first fixation duration (FirstFixDur); middle pane = log-transformed late fixation duration (LateFixDur); right pane = inversely transformed response time (RT).

The time course of the nontarget word frequency effect.
Note. Left pane = inversely transformed first fixation duration (FirstFixDur); middle pane = log-transformed late fixation duration (LateFixDur); right pane = inversely transformed response time (RT).