Introduction
Genetic diversity is a necessary condition to achieve yield stability. It is essential for plant breeders trying to breed improved crop varieties. Genetic diversity analyses can be performed at a phenotypic, biochemical or molecular level. DNA-based molecular markers are more reliable and robust methods for the characterization of genetic diversity. A range of molecular markers have been used on sorghum to determine its genetic diversity, including restriction fragment length polymorphism (Perumal et al., Reference Perumal, Krishnaramanujam, Menz, Katile, Dahlberg, Magill and Rooney2007), amplified fragment length polymorphism (AFLP; Ayana et al., Reference Ayana, Bryngelsson and Bekele2000), simple sequence repeats (SSRs; Manzelli et al., Reference Manzelli, Pileri, Lacerenza, Bendettelli and Vecchio2007; Ganapathy et al., Reference Ganapathy, Gomashe, Rakshit, Prabhakar, Ambekar, Ghorade, Biradar, Saxena and Patil2012), single nucleotide polymorphisms (Morris et al., Reference Morris, Ramu, Deshpande, Hash, Shah, Upadhyaya, Lizarazu, Brown, Acharya, Mitchell, Harriman, Glaubitz, Buckler and Kresovich2013) and diversity array technology markers (Bouchet et al., Reference Bouchet, Pot, Deu, Rami, Billot, Perrier, Rivallan, Gardes, Xia, Wenzl, Kilian and Glaszmann2012).
SSR markers are among the most widely used DNA-based molecular markers. In the case of sorghum, SSR markers have been widely applied for assessment of genetic diversity and characterization of germplasm (Smith et al., Reference Smith, Kresovich, Hopkins, Mitchell, Dean, Woodman, Lee and Poster2000; Geleta et al., Reference Geleta, Labuschagne and Viljoen2006; Perumal et al., Reference Perumal, Krishnaramanujam, Menz, Katile, Dahlberg, Magill and Rooney2007), identification and fingerprinting of genotypes (Menz et al., Reference Menz, Klein, Mullet, Obert, Unruh and Klein2002) and estimation of genetic distances between and within populations (Smith et al., Reference Smith, Kresovich, Hopkins, Mitchell, Dean, Woodman, Lee and Poster2000; Geleta et al., Reference Geleta, Labuschagne and Viljoen2006). These markers are reportedly the marker of choice for genetic diversity analysis due to their ability to provide informative multi-allelic loci and greater genotypic differentiation (Anas and Yoshida, Reference Anas and Yoshida2004).
In Ethiopia, sorghum is the third most important staple cereal crop after teff and maize (CSA, 2012). This crop is grown in almost all regions by subsistence farmers for multiple uses such as food and animal feed and used as the basic ingredient in some local beverages. However, its productivity has remained relatively low, with an estimated national mean yield of < 2 t/ha (CSA, 2012) due to several biotic, abiotic and socio-economic constraints. Sorghum productivity in the regions of Ethiopia could be enhanced through effective breeding programmes using locally adapted and well-characterized germplasm.
An understanding of genetic diversity among inbred lines can be particularly useful in planning crosses and for precise identification of genotypes for strategic breeding and conservation (Geleta et al., Reference Geleta, Labuschagne and Viljoen2006; Perumal et al., Reference Perumal, Krishnaramanujam, Menz, Katile, Dahlberg, Magill and Rooney2007). Typically, in Ethiopia, sorghum breeding programmes establish genetic relationships through phenotypic evaluations, often with no application of molecular methods. To date, few diversity assessments have been made by breeders in Ethiopia. Menkir et al. (Reference Menkir, Goldsbrough and Ejeta1997) applied random amplified polymorphic DNA (RAPD) markers and studied the genetic diversity of sorghum sampled from different parts of Ethiopia. Ayana et al. (Reference Ayana, Bryngelsson and Bekele2000) used the same RAPD markers to determine sorghum diversity collected from the western regions of Ethiopia. Geleta et al. (Reference Geleta, Labuschagne and Viljoen2006) used SSR and AFLP markers for genetic diversity analysis of sorghum collections sampled from the eastern regions of Ethiopia. However, these reports did not cover landraces adapted to the lowland areas of Ethiopia where drought stress and stalk borer damage largely limit the productivity of sorghum.
Thus, further studies that include sorghum landraces evolved and maintained in drought-prone environments are vital for effective breeding. Therefore, this study aimed to systematically assess the genetic diversity and interrelationships among and within genotypes collected from drought-prone lowland areas of north-eastern Ethiopia, using polymorphic SSR markers sampled from ten linkage groups.
Materials and methods
Plant material and sampling
Of a total of 273 sorghum genotypes collected across a wide altitudinal range (900–1540 m above sea level) in Ethiopia, 200 were selected on the basis of their morphological distinctiveness and drought tolerance, in terms of earliness and yield stability, when evaluated across different environments. The selected sorghum germplasm included both SS and grain sorghum genotypes. The genotypes were sampled from three administrative zones (Wag-Hemra, North and South Welo). The zones were represented by selecting seven districts as follows: Ambasel and Kalu from South Welo; Bugina, Gubalafto and Kobo from North Welo; Sekota and Ziquala from Wag-Hemera. A total of 46 landraces were sampled from Ambasel, 54 from Kalu, 12 from Kobo, 14 from Bugina, 44 from Gubalafto, 14 from Ziquala and 16 from Sekota. The proportions of landraces grown, according to the race classifications of Harlan and de Wet (Reference Harlan and de Wet1972) were Bicolor at 4.5%, Caudatum at 24.0%, Durra at 58.0% and Durra–Caudatum at 13.5%. For each genotype, a bulk sample of leaf tips from five seedlings was harvested 4 weeks after germination. The leaf samples were dried using a silica gel protocol (Rogstad, Reference Rogstad2003). The samples were arranged in 3 × 96-well plates and sent to DNA LandMarks Inc., Canada for SSR analysis. Genomic DNA was extracted from the dried leaf samples and the quality of the extracted DNA was evaluated on 1% agarose gel.
DNA extraction and genotyping
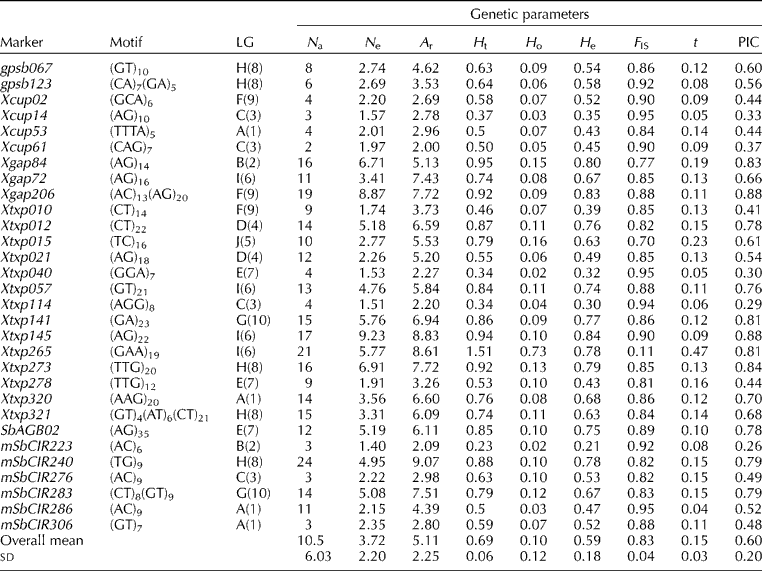
For molecular diversity assessment, a set of 30 microsatellite markers were used. These markers were selected from the SSR diversity kit (Billot et al., Reference Billot, Rivallan, Sall, Fonceka, Deu, Glaszmann, Noyer, Rami, Risterucci, Wincker, Ramu and Hash2012) from all the linkage groups of the sorghum genome (Table 1). These include four markers (Xcup02, Xcup15, Xcup53 and Xcup61) designed from coding regions and 26 markers designed from non-coding regions (Billot et al., Reference Billot, Rivallan, Sall, Fonceka, Deu, Glaszmann, Noyer, Rami, Risterucci, Wincker, Ramu and Hash2012). Different types of SSR motifs were also represented as dinucleotide (56.7%), trinucleotide (30.0%) and compound nucleotide (13.3%) repeats. Genotyping was conducted at the genotyping service laboratory of DNA LandMarks Inc., Canada. For electrophoresis, an M13 forward primer method (5′-CACGACGTTGTAAAACGAC-3′) was used at the 5′ end of each primer. The M13-tailed forward primer was labelled with one of four fluorescence dyes (6FAM, PET, NED or VIC; Applied Biosystems, Foster City, California, USA) for the detection of polymerase chain reaction (PCR) products using the ABI 3730xl Genetic Analyzer (Applied Biosystems, Foster City, California, USA). Multiplex PCRs were carried out in a total reaction volume of 20 μl using a GeneAmp® PCR System 9700 Thermal Cycler (Applied Biosystems, Foster City, California, USA).
Genetic diversity within and among 200 sorghum genotypes based on 30 microsatellite markers

LG, linkage group; N a, total number of alleles per locus; N e, number of effective alleles per locus; A r, allelic richness; H t, total gene diversity; H o, observed gene diversity within genotypes; H e, average gene diversity within genotypes; F IS, inbreeding coefficient; t, outcrossing rate = (1 − F IS)/(1+F IS); PIC, polymorphic information content.
The PCR was carried out in a total reaction volume of 20 μl containing 2 μl (25 ng) genomic DNA, 0.75 μl M13-tailed forward primer (2 pm/μl), 0.75 μl reverse primer (2 pm/μl), 0.8 μl MgCl2 (25 mm), 2 μl of 10 × reaction buffer, 0.4 μl dNTPs (100 mm), 0.1 μl Taq DNA polymerase (10 U/μl) and 13.2 μl double-distilled H2O. The PCR conditions were programmed for an initial denaturation step at 94°C for 5 min, followed by 35 cycles of denaturation at 94°C for 1 min, an annealing step at 61°C for 1 min (temperature reduced by 1°C for each cycle) and a polymerization step at 72°C for 1 min. This step was repeated for 35 cycles of denaturation at 94°C for 1 min, an annealing step at 54°C for 1 min and a polymerization step at 72°C for 1 min, followed by a final polymerization step at 72°C for 10 min, based on their expected amplicon size and the dye. The PCR products were pooled together along with internal size standards (GeneScan™, 500 LIZ®; Applied Biosystems, Foster City, California, USA). The data were generated through capillary electrophoresis (Applied Biosystems, Foster City, California, USA) and then analysed using GeneMapper® Software (Applied Biosystems, Foster City, California, USA). Product size was scored in base pairs based on the relative migration of the internal size standard. Information generated from GeneMapper® Software (Applied Biosystems, Foster City, California, USA) was then used to determine the genetic diversity parameters.
Data analysis
Genetic diversity analysis
Genotypic data were subjected to various measures of the genetic diversity of within and among accessions using FSTAT version 2.9.3 (Goudet, Reference Goudet2001) and GENALEX version 6.5 (Peakall and Smouse, Reference Peakall and Smouse2007). The χ2 test was performed to determine the differences in allele frequencies among the SSR markers. Genetic diversity parameters, such as the total number of alleles per locus (N
a), the number of effective alleles per locus (N
e), allelic richness, observed heterozygosity (H
o), total gene diversity (H
t) and average gene diversity (H
e), were determined using the protocol of Nei and Li (Reference Nei and Li1979). Furthermore, the inbreeding coefficient (F
IS) and the outcrossing rate (t) were calculated as
 $$t = (1 - F _{IS})/(1 + F _{IS}) $$
. The percentage of polymorphic loci was estimated for each predetermined group, based on the districts of collection. Different numbers of landraces were sampled from different districts and races; allelic richness was corrected for sample size differences and estimated by using the rarefaction method implemented in HP-Rare 1.0 (Kalinowski, Reference Kalinowski2005).
Global and pairwise F ST were computed by Weir and Cockerham's Q methods using [Q]FSTAT (Weir and Cockerham, Reference Weir and Cockerham1984). To examine the degree of population differentiation, other parameters such as gene flow, Nei's unbiased genetic distance and identity were estimated using GENALEX. The partitioning of total genetic variation into within and among the districts of collection and races was done with a molecular analysis of variance (AMOVA) procedure using GENALEX.
Cluster analysis
Genetic relationships within and among the genotypes sampled from the seven districts and races were assayed with a neighbour-joining algorithm using the unweighted pair group method in DARwin 5.0 software (Perrier and Jacquemoud-Collet, Reference Perrier and Jacquemoud-Collet2006). A dendrogram was then generated on the dissimilarity matrix. Bootstrap analysis was performed for node construction using 10,000 bootstrap values.
The Bayesian genotypic clustering approach of STRUCTURE 2.3.4 (Pritchard et al., Reference Pritchard, Stephens and Donnelly2000) was used to validate the population structure among the genotypes. An admixture model with independent allele frequencies, without prior population information, was used to simulate the population. This model assumes that the genome of each individual is a mixture of genes originating from K unknown ancestral populations. For joint inference of the population substructure, the model was run for 20 replicate analyses for each K value ranging from 1 to 10, with a burn-in period of 106 and Markov Chain Monte Carlo (MCMC) steps of 106 iterations (Bouchet et al., Reference Bouchet, Pot, Deu, Rami, Billot, Perrier, Rivallan, Gardes, Xia, Wenzl, Kilian and Glaszmann2012). Graphical representation of population assignments from STRUCTURE were produced from the program DISTRUCT (Rosenberg, Reference Rosenberg2002).
Results
Genetic diversity within and among accessions
The 200 sorghum genotypes evaluated in this study were differentiated uniquely, using the 30 SSR markers. The statistics of genetic diversity parameters within and among the genotypes are given in Table 1. The 30 SSR loci were able to generate clear bands within the expected size range. A total of 316 putative alleles (different fragment sizes) were detected among the 200 sorghum genotypes. The difference between the longest and shortest product sizes ranged from 4 to 134 bp. The highest variation in allele size was observed in locus Xgap265 (100–234 bp). The total number of polymorphic alleles amplified per locus over all genotypes ranged from 2 (Xcup61) to 24 (mSbCIR240), while the mean N a for the whole set of genotypes was 10.5. In contrast, the value of N e for 17% of the loci were < 2 and for 27% of the loci were >5, with a mean of 3.7 alleles per locus. The polymorphic information content (PIC) values for SSR loci ranged from 0.26 for mSbCIR223 to 0.88 for Xgap206 and Xtxp145, with a mean value of 0.61. Of the markers used, 63% had a PIC value >0.50. The PIC values of the markers designed from coding regions were lower than the values of those designed from non-coding regions of chromosomes.
The results of the χ2 test showed significant differences in allele frequencies at all loci for all sets of genotypes. The values of H
t ranged from 0.28 (mSbCIR223) to 0.89 (Xtxp145 and Xgap206). Similarly the value of H
e was found to be 0.56, with maximum and minimum values of 0.21 and 0.81 recorded by the microsatellite markers mSbCIR223 and Xgap206, respectively. The mean H
t value was estimated to be 0.69. The value of H
o at each locus ranged from 0.02 (mSbCIR223 and Xtxp040) to 0.79 (Xgap265), with a mean value of 0.11 for all the loci. The F
IS values for all the markers except for Xtxp265 were found to be >0.75. An indirect estimate of the level of gene flow (Nm) between the genotypes was calculated using the formula
 $$Nm = 0.25 (1 - F _{ST})/ F _{ST} $$
following Nei (Reference Nei1987). The level of gene flow was observed to be high for loci Xtxp010, Xgap72 and Xcup14 and low for loci Xtxp021 and Xtxp321, with a mean gene flow rate of 3.7. The mean multilocus outcrossing rate was found to be 0.15, with the maximum outcrossing rate being 12 times (t= 0.47 for locus Xtxp265) higher than the minimum outcrossing rate (t= 0.04 for locus mSbCIR286; Table 1).
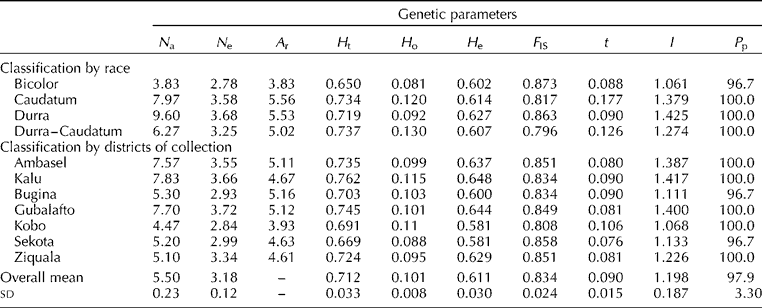
Significant differences were detected in the mean number of observed and effective alleles per locus among the races and collection sites. The mean number of observed alleles per race was found to be higher for Durra (9.60) but lower for Bicolor (3.83) (Table 2). Similarly, the mean N e per race was slightly higher for Durra (3.68) followed by Caudatum (3.58). However, the mean number of effective alleles for Bicolor (2.27) was significantly low. A significant variation was observed for allelic richness both at race and district levels, in which allelic richness for Bicolor (3.38) and genotypes collected from Kobo (3.93) revealed the lowest number, respectively. The mean N a per collection district ranged from 4.47 (genotypes collected from Kobo) to 7.83 (genotypes collected from Kalu).
Genetic diversity within and among the overall sample of 200 sorghum genotypes classified by either race or districts of collection

N a, total number of alleles per locus; N e, number of effective alleles per locus; A r, allelic richness; H t, total gene diversity; H o, observed gene diversity within genotypes; H e, average gene diversity within genotypes; F IS, inbreeding coefficient; t, outcrossing rate = (1 − F IS)/(1+F IS); I, Shannon's information index; P p, percentage of polymorphic loci.
The possibility of two randomly sampled alleles in a given genotype to be different was >61% (H e= 0.61). The highest H t value of 0.762 was recorded for genotypes collected from Kalu and the lowest value of 0.669 was detected for genotypes collected from Sekota. Considering the racial classification, the lowest H t was observed for genotypes collected from Bicolor (H t= 0.650). However, no significant variation was observed in H t among the other races (Table 2). High genetic polymorphism was observed within the genotypes, showing that, on average, 98% of the loci were polymorphic.
The percentage of polymorphic loci were 96.7% for genotypes collected from Bugina and Sekota and 100% for those collected from Ambasel, Kalu, Kobo, Gubalafto and Ziquala. Similarly, Shannon's information index was slightly higher for genotypes collected from Kalu and Gubalafto, whereas those collected from Bugina had low values. The mean estimated outcrossing rate was found to be 0.09 for all the genotypes. However, the highest outcrossing rate was observed in the Durra–Caudatum race (t= 0.114) and the lowest rate in the Bicolor race (t= 0.068). Landraces collected from Kobo had the greater outcrossing rate (t= 0.106), whereas those collected from the rest of the districts showed almost similar outcrossing rates (Table 2).
Distance-based population differentiation
The results of AMOVA for total genetic variation among the sorghum landraces, races and districts of collection showed that genetic differentiation at the district level appeared to be very low. However, of the total genetic variation, 84% was attributed to the variation among the genotypes, while only 16% was due to the variation within the genotypes (data not shown). The F-statistics over the 200 genotypes indicated that for the mean inbreeding coefficient, the value of F IS was found to be 0.83 ± 0.024, implying that landraces collected from different districts were highly homozygous. There were high levels of inbreeding within the landraces, with the mean F IS value being 0.81 ± 0.015. Genetic differentiation among the genotypes was insignificant, with a mean F ST value of 0.06 ± 0.03.
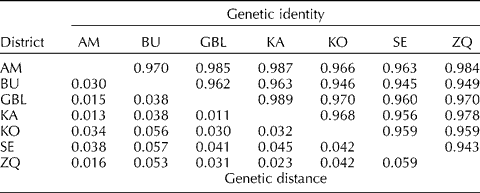
The genetic distance calculated using the 30 SSR markers based on the method of Nei (Reference Nei1987) indicated that the average Nei's unbiased genetic distance calculated among and within the districts of collection was larger (0.053–0.059) among the genotypes collected from Bugina, Kobo, Sekota and Ziquala but smaller among those collected from Gubalafto, Ambasel and Kalu (0.011–0.015; Table 3). The smallest genetic distance was observed between Durra and Durra–Caudatum (0.026) and the longest between Bicolor and Durra–Caudatum (0.16; data not shown). Similarly, genetic identity was greater among the races and districts of collection (0.94–0.99). The narrow genetic distance observed among the districts of collection could be attributed to the racial specificity of most of the local genotypes belonging to the Durra race, combined with the high level of gene flow among the districts of collection.
Nei's unbiased genetic distance and genetic identity among and within 200 sorghum genotypes collected from seven districts

AM, Ambasel; BU, Bugina; GBL, Gubalafto; KA, Kalu; KO, Kobo; SE, Sekota; ZQ, Ziquala.
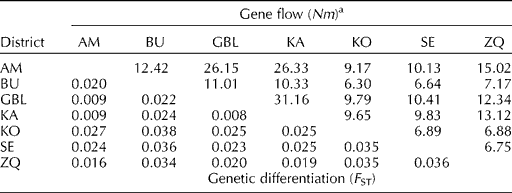
Genetic differentiation, F ST, among the sorghum landraces ranged from 0.01 to 0.04, with an overall mean of 0.03 (Table 4). Population differentiation (F ST= 0.06) was relatively larger among the genotypes collected from Sekota and Ziquala. However, population differentiation among the districts of collection was low and very similar to one another (F ST 0.01–0.027).
Pairwise genetic differentiation and gene flow among and within sorghum genotypes collected from seven districts

AM, Ambasel; BU, Bugina; GBL, Gubalafto; KA, Kalu; KO, Kobo; SE, Sekota; ZQ, Ziquala.
a Nm= 0.25(1 − F ST)/F ST.
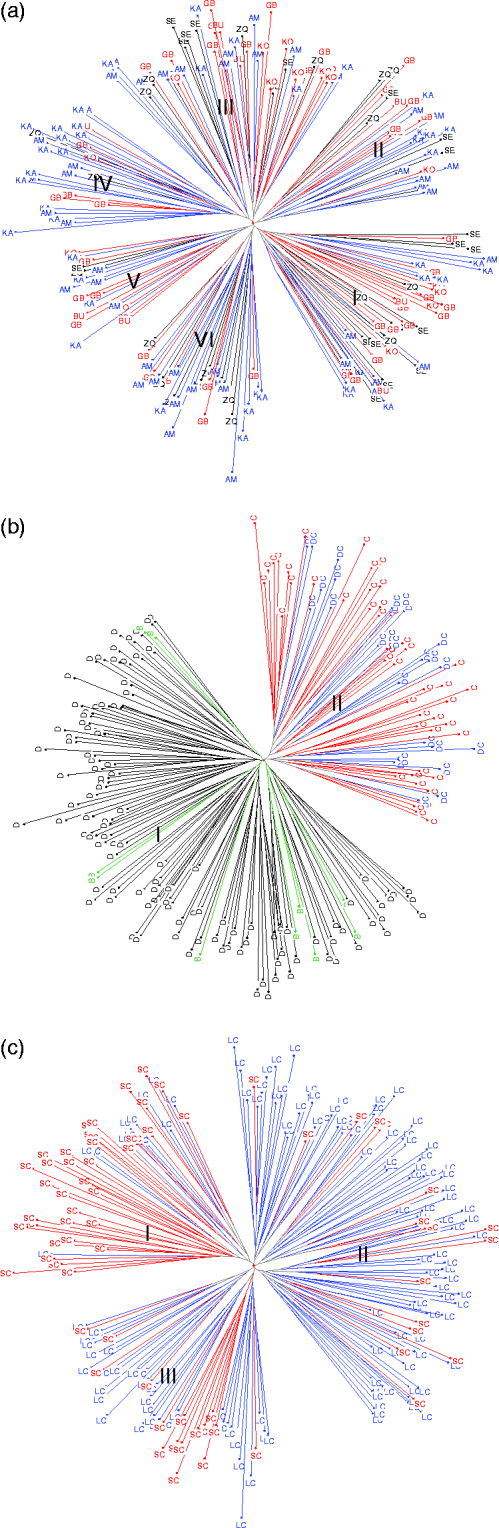
The cluster analysis based on genetic dissimilarity using the neighbour-joining method in DARwin 5.0 classified the 200 sorghum genotypes into two distinct major clusters (Fig. 1(a)). However, the cluster analysis generated using the SSR markers did not correspond to the predefined population structure based on the districts of collection. This could be expected because most of the genotypes were collected from lowland agroecologies of the different districts in north-eastern Ethiopia. Cluster I consisted of 52% of the total genotypes and composed of three subclusters (2, 3 and 4; Fig. 1(a)). Cluster II contained 49% of the total genotypes and also comprised of three subclusters (1, 5 and 6). In cluster I, landraces collected from Bugina (67%), Gubalafto (55%) and Ambasel (54%) were more frequent. However, those collected from Kalu (59%) and Sekota (56%) were more common in cluster II.
Neighbour-joining dendrograms depicting genetic relationship between sorghum genotypes: classification based on (a) districts of collection, (b) races and (c) maturity groups. The different coloured lines represent different districts of collection, races and maturity groups. (a) AM, Ambasel; BU, Bugina; GBL, Gubalafto; KA, Kalu; KO, Kobo; SE, Sekota and ZQ, Ziquala. (b) D, Durra; B, Bicolor; C, Caudatum; DC, Durra–Caudatum. (c) LC, long cycle; SC, short cycle.

SS genotypes included in this study were widely scattered in different subclusters. In the present study, the SS and grain sorghum varieties were not separated from each other and no specific pattern was observed. The SS line AS-27 from South Africa was grouped with the landraces 239192A and 239234 SS sampled from Ethiopia, while the SS line AS-103 from the USA was grouped with the landrace 72583A in subclusters 1 and 4, respectively. Of the SS genotypes (69 286-A, 73 031, 73 041, 73 059 and 200538) sampled from Ethiopia, five were grouped in subcluster 2.
The cluster analysis based on racial classification grouped the 200 sorghum genotypes into two main clusters (Fig. 1(b)). Generally, 58% of the genotypes belonged to the race Durra, 24% to Caudatum, 13.5% to Durra–Caudatum and 4.5% to Bicolor. Cluster I consisted of 125 genotypes and was dominated by Durra, and only 7.2% of the genotypes were from Bicolor. One-third of the total genotypes were grouped in cluster II and composed of 64% Caudatum and 36% Durra–Caudatum. However, the cluster analysis based on maturity group resulted in three distinct clusters (Fig. 1(c)). Cluster I was composed of short-cycle sorghum varieties that mature within a period of 4 months. Cluster II was dominated by long-cycle varieties that take 5–6 months to mature. However, cluster III consisted of varieties from both maturity groups.
Model-based population differentiation and structure
Similar to the NJ cluster analysis, the model-based structure analysis using STRUCTURE confirmed the existence of two distinct sets of genotypes (Fig. 2(a)). However, both the number and list of germplasm in the two analyses were not identical. In the first analysis, the model assumed that individuals may have mixed ancestry and inherited a fraction of their genome from ancestors in K populations. The optimal number of genetic groups was determined by the method proposed by Evanno et al. (Reference Evanno, Regnaut and Goudet2005). At K= 2, the 200 sorghum genotypes were clustered into two discrete subgroups with a moderate level of admixtures. Further increasing the population to K= 3 did not increase separation, but escalated the level of admixtures of the two subgroups. The population structure analysis on the basis of geographic origin did not reveal any meaningful population structure (Fig. 2(b)). This result is congruent with the AMOVA that showed little differentiation among the districts. It is apparent that no further subgrouping in the study materials could be modelled and that the optimum population structure predicted by the software was at K= 2.
Population genetic structure for 200 sorghum landraces from north-eastern Ethiopia at K= 2: classification based on (a) races, (b) districts of collection and (c) maturity groups. (a) D, Durra; B, Bicolor; C, Caudatum; DC, Durra–Caudatum. (b) AM, Ambasel; BU, Bugina; GBL, Gubalafto; KA, Kalu; KO, Kobo; SE, Sekota; ZQ, Ziquala. (c), SC, short cycle; LC, long cycle.

The STRUCTURE analysis also clearly assigned the individuals into subpopulations according to their race and maturity groups at K= 2. The first common group included the races Durra and Bicolor, while the second group had Caudatum and Durra–Caudatum populations (Fig. 2(a)). The first subgroup contained 131 landraces and was dominated by Durra landraces (89%), and the second subgroup consisted of 69 landraces (35%) and was dominated by landraces from Caudatum. Further separation of the two subgroups was impossible, and genetic similarity between the two subpopulations based on race classification was 0.082. This may be due to the small number of markers used (two to four markers) per chromosome. Similar patterns were observed based on maturity groups, where short-cycle sorghum varieties were separated from long-cycle varieties at K= 2 (Fig. 2(c)). The number and list of germplasm in the two subgroupings were not identical.
The AMOVA clearly indicated a significant difference between the two subpopulations (data not shown). The variance among the two populations was significantly higher (14% of the total variation) compared with the variance accounted by geographic domains. The within-landrace and among-landrace differentiation accounted for 16 and 70% of the total variation, respectively. A moderately higher differentiation estimate (F ST= 0.14, P< 0.001) and (F ST= 0.10, P< 0.001) was observed when the genotypes were classified into two subgroups based on race classification and maturity groups.
Discussion
All the microsatellite markers used in this study were highly polymorphic. The present findings suggested that the level of diversity shown by the 30 microsatellite markers across genotypes was lower than that found in the study of Kong et al. (Reference Kong, Dong and Hart2000), reporting a mean diversity index of 0.89. In general, the present results concur with those reported by Smith et al. (Reference Smith, Kresovich, Hopkins, Mitchell, Dean, Woodman, Lee and Poster2000) and Geleta et al. (Reference Geleta, Labuschagne and Viljoen2006), who also showed that markers with moderate PIC values can classify most of the inbred lines and detect the polymorphism rate at a specific locus (Smith et al., Reference Smith, Kresovich, Hopkins, Mitchell, Dean, Woodman, Lee and Poster2000). The PIC values of loci provide an estimate of the discriminatory power of loci, considering the number of alleles and their relative frequencies (Smith et al., Reference Smith, Kresovich, Hopkins, Mitchell, Dean, Woodman, Lee and Poster2000). In this study, 40% of the loci used had PIC values >0.75, indicating that these loci have high discriminatory powers that distinctively classify most of the genotypes. The polymorphism values reported in this study are higher than those reported by earlier studies (Smith et al. (Reference Smith, Kresovich, Hopkins, Mitchell, Dean, Woodman, Lee and Poster2000); Ganapathy et al. (Reference Ganapathy, Gomashe, Rakshit, Prabhakar, Ambekar, Ghorade, Biradar, Saxena and Patil2012)).
The differences observed between total N a and N e were due to the variation observed in the frequency of major alleles among the genotypes. The distribution of allele frequency at a single locus varies among the genotypes. The within-locus variation in fragment size observed in this study was much greater than that reported by Billot et al. (Reference Billot, Rivallan, Sall, Fonceka, Deu, Glaszmann, Noyer, Rami, Risterucci, Wincker, Ramu and Hash2012). The greatest variation in allele size observed in locus Xgap265 (100–234 bp) could have resulted by slip-strand mispairing during DNA replication (Levinson and Gutman, Reference Levinson and Gutman1987), or caused by lower primer binding stringency due to potential mutation on a primer binding site (Dillon et al., Reference Dillon, Lawrence and Henry2005).
The low H o and high F IS values observed for all the germplasm included in this study indicated that the landraces were predominantly homozygous, which was maintained by continued self-fertilization. Genotypes that were collected from extremely dry environments such as Bugina, Kobo, Sekota and Ziquala showed slightly lower mean numbers of observed and effective alleles. This may be due to the successive selection and the continuous use of genotypes that were selected for their superior drought tolerance. The continued selection of these genotypes by farmers would result in narrow genetic diversity and low allelic richness when compared with all the other landraces.
The higher level of allelic diversity of the SSR loci examined in this study was probably associated with the wide range of genetic diversity represented in sorghum germplasm sampled from the lowland areas of Ethiopia. Farmers in Ethiopia practice mass selection, i.e. healthy and big panicles are selected in a field every year, and this seed is used in the following planting season. According to Harlan (Reference Harlan1975), such practices exert a particular balance of selection pressure and allow for genetic variability within populations. Farmers select panicles based on appearance, not considering the genetic purity (Teshome et al., Reference Teshome, Patterson, Asfaw, Torrance and Arnsan2007), which would result in a continuous exchange of alleles among genotypes (Manzelli et al., Reference Manzelli, Pileri, Lacerenza, Bendettelli and Vecchio2007).
The SSR analysis identified weak district and racial genetic differentiation among the tested sorghum landraces. This can be attributed to a high level of gene flow among the districts within the regions of north-eastern Ethiopia. Dje et al. (Reference Dje, Heuertz, Lefèbvre and Vekemans2000) reported an F ST value of 0.68 among the genotypes of cultivated sorghum. In contrast, Ganapathy et al. (Reference Ganapathy, Gomashe, Rakshit, Prabhakar, Ambekar, Ghorade, Biradar, Saxena and Patil2012) reported an F ST value of 0.51 between rainy and post-rainy genotypes. Based on allozyme data, Ayana et al. (Reference Ayana, Bryngelsson and Bekele2001) reported an F ST value of 0.44 for landraces collected from three altitudinal zones of Ethiopia, while Zongo et al. (Reference Zongo, Gouyon, Sarr and Sandmeier2005) measured an F ST value of 0.81 for landraces collected in Burkina Faso. However, the present estimate of F ST is much lower than those reported by these authors.
A low mean F ST value of 0.03 was observed among the different districts of collection in this study. This can be explained by the high level of gene flow, which leads to genetic homogeneity, among the different districts of collection. The high level of gene flow observed among the landraces may be attributed to the fact that farmers in Ethiopia maintained large numbers of varieties on a single plot, based on a range of selection criteria, in order to cope with diverse environmental stresses (Teshome et al., Reference Teshome, Patterson, Asfaw, Torrance and Arnsan2007). This may result in a continuous exchange of genes through pollen flow (Manzelli et al., Reference Manzelli, Pileri, Lacerenza, Bendettelli and Vecchio2007). In addition, the low genetic differentiation observed among the population can be caused by either the frequent occurrence of gene flow or a low genetic drift due to a high effective population size (Dje et al., Reference Dje, Forciolo, Ater, Lefèbvre and Vekemans1999).
Correspondingly, a high level of gene flow (26–31) exists between neighbouring districts such as Ambasel, Kalu and Gubalafto. Some level of gene flow was also observed between Gubalafto, Sekota and Ziquala. Teshome et al. (Reference Teshome, Baum, Fahrig, Torrance, Arnasson and Lambert1997) reported the existence of gene flow among bordering districts. This could be further explained by the movement of farmers for trading and seasonal labour, and informal seed exchange among them. Additionally, farmers exchange seeds through gifts and via markets, to renew old seed stocks or to acquire new varieties. Consequently, there may be a continuous exchange of genes among genotypes. Apart from gene flow, landraces were collected from lowland agroecologies where moisture stress is the major production bottleneck and farmers probably have similar selection preferences in accordance with ecological adaptation. This led to a weak genetic differentiation among the districts of collection.
A weak differentiation of germplasm in this study was also confirmed by the AMOVA, which also revealed that a large proportion of the variation was found among the landraces within the districts of collection. Similar results have been reported from studies based on allozymes (Ayana et al., Reference Ayana, Bryngelsson and Bekele2001), microsatellite markers (Nguni et al., Reference Nguni, Geleta and Bryngelsson2011) and RAPD analysis (Menkir et al., Reference Menkir, Goldsbrough and Ejeta1997). All the authors have pointed out that geographic variation does not make major contributions to genetic differentiation among sorghum genotypes. Aldrich and Doebley (Reference Aldrich and Doebley1992) also reported the weak correlation between genetic and geographic distances in cultivated sorghum. This suggests that sorghum genotypes from different geographic origins can be considered to come from roughly the same gene pool when devising germplasm collection and breeding activities. Additionally, weak differentiation was observed between SS and grain sorghum varieties. Kimberley et al. (Reference Kimberley, Ritter, Lynne, Ian, David and Scott2007) in a study using SSR markers reported weak differentiation between the two types of sorghum (SS and grain sorghum), which could not be significantly separated.
Genetic analysis employed in this study showed good correspondence with the division of the landraces into two subgroups. For example, cluster analysis using the neighbour-joining method grouped the landraces into two groups and three subgroups in each group, based on the districts of collection. Similar clustering of the genotypes based on race classification resulted in two subgroups dominated by Durra and Caudatum, respectively. The STRUCTURE analysis also suggested the existence of two subpopulations within the landraces. Subpopulation I consisted of the races Durra and Bicolor and subpopulation II included the races Caudatum and Durra–Caudatum. Further racial structure was not apparent in the landraces. Using morphological characteristics, two subpopulations at K= 2 were distinguished. The first subpopulation was dominated by Degalet types that have compact heads, long cycles (6 months to mature), and are late maturing and relatively high-yielding landraces. The second subpopulation was mainly composed of Jigurte types that are short-cycle (4 months to mature) and early-maturing and low-yielding landraces.
There are two main cropping seasons in Ethiopia, in general, namely Belg and Meher. The Meher season is the main and long rainy season that spans from June to October, while the Belg season is a short rainy season and extends from March to May. The two seasons merge into one extended growing period with a short period of dry spell. Sorghum is cultivated in both seasons, i.e. planting is done twice per year in April and June. Farmers plant long-cycle and late-maturing sorghum varieties mainly in April and harvest in December. However, during extended dry spells such as during the early cessation of Belg and the delayed onset of rainfall at Meher, farmers are forced to replant their fields with short-cycle sorghum varieties in June.
Traditionally, farmers have some indicators to predict imminent moisture stress. For example, very cold weather with little rain in the months of October and November was taken as a sign of moisture stress to follow in April. In such cases, farmers suspended growing long-cycle, late-maturing and high-yielding sorghum varieties in favour of planting short-cycle, early-maturing and low-yielding varieties from mid-June to mid-July. If they expected sufficient rain in the Belg season, then they planted late long-cycle sorghum varieties. When they anticipated variable levels of moisture, farmers planted a range of sorghum varieties from different maturity groups to increase the probability of a good harvest and/or to avoid a complete crop failure.
The two distinct subgroups may have resulted from farmers' selection for adaptation to specific production niches, cooking values and market orientation. The occurrence of a moderately strong genetic structure (F ST= 0.137) and a low level of gene flow (1.5) between the two populations indicated that the groups are genetically different. This will allow breeders to select and fix unique alleles between populations (Hartl and Clark, Reference Hartl and Clark1997). Among the numerous explanations forwarded as the cause of transgressive segregation in plants, complementary gene action is more popular (Rieseberg et al., Reference Rieseberg, Archer and Wayne1999). Crosses between genetically divergent inbred lineages may result in transgressive segregation. This is because different parental lineages can often fix different sets of alleles with complementary effects. In this particular study, strategic crossing between the two divergent populations may allow breeders to identify transgressive segregants.
In conclusion, the present study showed that there is considerable genetic variability among sorghum landraces found in the drought-prone lowlands of north-eastern Ethiopia. However, this variation was not correlated with the geographic origins of the genotypes. Additionally, low levels of differentiation among the sites of collection and high levels of variation within the sites of collection suggest that a large random collection would capture most of the genetic variation within the sorghum genotypes in the target area. Given the high level of gene flow among the genotypes and the high level of within-population variation, the traditional agricultural production system practised by Ethiopian farmers has played a vital role in maintaining and directing genetic diversity and evolution. Case et al. (Reference Case, Mitchell, Hamblin, Sun, Bowers, Paterson, Aquadro and Kresovich2005) studied the genetic diversity of sorghum using 98 SSR markers and found that local landraces captured 86% of the total variation observed in wild species. Similarly, Deu et al. (Reference Deu, Sagnard, Chantereau, Calatayud, Vigouroux, Pham, Mariac, Kapran, Mamadoo, Gerard, Ndjeunga and Bezancon2010) pointed out the significant role contributed by farmers in the management and preservation of genetic diversity over time. The high genetic variability observed among landraces provides enough genetic plasticity for the crop to adapt to diverse environmental conditions in tropical areas (Manzelli et al., Reference Manzelli, Pileri, Lacerenza, Bendettelli and Vecchio2007), and allow them to circumvent crop failure by reducing vulnerability to environmental stresses. The study of genetic diversity among sorghum landraces could serve as an important source of valuable alleles for drought tolerance in future sorghum improvement programmes.
Acknowledgements
The authors sincerely thank the Alliance for a Green Revolution in Africa (AGRA) for providing financial support. They also highly appreciate the Institute of Biodiversity Conservation (IBC) of Ethiopia for providing seeds of the landraces and their passport data. The authors thank DNA LandMarks Inc., Canada for genotyping services through financial support by the Generation Challenge Program (GCP). They also sincerely thank the University of KwaZulu-Natal (UKZN) for providing a postdoctoral research grant to the first author.