Implications
The response to selection is expected to be different according to the production environment in which the animals of the population are evaluated. Thus, the genotype×production environment interaction should not be neglected in the genetic evaluation of birth and weaning weights in the present population of composite beef cattle. The inclusion of sire×contemporary group interaction in the model is a feasible and plausible alternative to take into account the effects of genotype×environment interaction in the genetic evaluations.
Introduction
Genotype by environment interaction (G×E) is a matter of controversy among breeders. One of the most important implications for genetic evaluations would be the reranking of animals according to the rearing environment of their offspring. As a consequence, no animal exists that is optimal for all environmental conditions. On the other hand, G×E might be seen as a commercial opportunity for breeders and producers as, in fact, there are animals that are more or less adequate to be raised or to produce offspring in specific environments. Therefore, G×E has encouraged a number of studies involving beef cattle worldwide (Bertrand et al., Reference Bertrand, Hough and Benyshek1987; Neser et al., Reference Neser, Konstantinov and Erasmus1996; Burrow, Reference Burrow2012). This is not different in Brazil, whose territory is the fifth largest in the world and is located in the (sub)tropical zone of the planet. The production environment of beef cattle in Brazil is characterized by wide diversity and G×E should therefore be a matter of concern to breeders and producers. However, beef cattle breeding programs have generally neglected the possible effects of sire×environment interaction, a fact that, according to Bertrand et al. (Reference Bertrand, Berger and Willham1985), may cause bias in sire breeding values. The most common manifestations of G×E are sire×herd, sire×season of birth, and sire×contemporary group interactions. In this respect, Bradfield et al. (Reference Bradfield, Graser and Johnston1997) defined favorable and unfavorable production environments based on contemporary groups and demonstrated the importance of including sire×contemporary group interaction in the genetic evaluation of Santa Gertrudis cattle in Australia. Diaz et al. (Reference Diaz I del, Oliveira, Bezerra and Lôbo2011) and Santana et al. (Reference Santana, Eler, Cardoso, Albuquerque, Bignardi and Ferraz2012) observed G×E in beef cattle raised in different parts of Brazil. The impact of this G×E on genetic evaluations in Brazil was, however, not yet quantified. Thus, the objectives of the present study were: (1) to evaluate the importance of genotype×production environment interaction for the evaluation of birth weight (BW) and weaning weight (WW) in a population of composite beef cattle in Brazil, and (2) to investigate the importance of sire×contemporary group interaction (S×CG) to model G×E and improve the accuracy of prediction in routine genetic evaluations of this population.
Material and methods
Data
Data from animals (purebred, crossbred and composite) born between 1995 and 2008 on 47 farms located in the Brazilian states of Goiás, Minas Gerais, Mato Grosso do Sul, Mato Grosso, Pará, Rio Grande do Sul and São Paulo were used. These animals participate in the Montana Tropical Composite Breeding Program, from partners of the CFM-Leachman Pecuária Ltda. In the original program of formation of composite beef cattle, the breeds were pre-grouped according to their genetic similarity and general performance into four large and general biological types, which are identified by the abbreviation NABC: group N (Bos indicus) represented by Zebu breeds, group A (Bos taurus) represented by tropically adapted breeds, group B (B. taurus) represented by European breeds of British origin and group C (B. taurus) represented by European breeds of continental origin (Ferraz et al., Reference Ferraz, Eler and Golden1999). In this population, a composite animal should include at least three different breeds, 12.5% adapted breed to the tropical environment (A) and 25% of Zebu breed (N) plus tropically adapted breeds (A). The maximum acceptable values are 37.5% group N, 87.5% group A, 100% group N plus A, 75% for groups B, C and B plus C. The proportion of genes from each biological type to the breed composition of animals and dams, combination of different biological types, direct and maternal heterozygosity coefficients were computed. The out crossing percentage was defined as
 $h_{_{{ij}} } =\mathop{\sum}\limits_{i\,\ne\,j} {r_{_{i} } r_{_{j} } } $
for ith sire breed and jth dam breed, where r is the proportion of the biological type based on NABC definition. Further information about the present composite beef cattle and distribution of farms throughout Brazil can be found in Santana et al. (Reference Santana, Eler, Cardoso, Albuquerque, Bignardi and Ferraz2012).
The animals were kept on pasture with or without supplements in the dry season. In general, the pastures were composed of Brachiaria brizantha. Especially in the Pantanal (Midwest) and Pampa (Southern Brazil), the native pasture plays an important role in animal feeding. All farms provided mineral supplements and some protein. About 60% of cows were inseminated and 40% were placed in lots with a group of bulls. The cow-to-bull ratio was 30 : 1 or 25 : 1. All calves born between September and December remained with their dams up to 7 months of age.
Records of animals in contemporary groups with fewer than 20 animals, contemporary groups with all progeny of a single sire, sires with fewer than five progeny records, records of animals with unknown sire or dam, and data exceeding 3.5 standard deviations above or below the overall mean of the trait were excluded to estimate variance components. In addition, the data set used for genetic evaluation considered records of animals in contemporary groups with at least five animals. In the latter case, no additional restriction was required for number and distribution of progeny per sire.
Models and definition of production environments
The standard model for BW and WW included the fixed effects of contemporary group (farm, year of birth, management group and sex), and covariates age at weaning only for WW (linear), age of dam at calving (linear and quadratic), individual and maternal breed composition (based on NABC definition), and individual and maternal heterozygosity (linear). The random effects of direct additive genetic, maternal genetic and maternal permanent environmental were also included.
The generalized least square solutions of contemporary group effects for BW and WW were obtained by single-trait analyses using GIBBS2F90 (Misztal et al., Reference Misztal, Tsuruta, Strabel, Auvray, Druet and Lee2002), fitting the standard animal model presented above. As proposed by Bradfield et al. (Reference Bradfield, Graser and Johnston1997), using the least square contemporary group solutions separately for each trait and each farm, those above farm average were assigned to trait 1 (favorable production environment) and those below farm average to trait 2 (unfavorable production environment), respectively. In another definition, those contemporary group solutions above one standard deviation of the farm average were assigned to trait 1 (favorable production environment), those between one standard deviation below and above the farm average to trait 2 (intermediate production environment) and those below one standard deviation of the farm average to trait 3 (unfavorable production environment), respectively.
Analyses
The identification of genotype by production environment interaction was done following the approach of Falconer (Reference Falconer1952), who suggested that a trait in different environments could be considered as a different trait. Robertson (Reference Robertson1959) proposed that G×E has biological importance when the genetic correlation between a trait in different environments was lower than 0.8. To verify the importance of genotype by production environment interaction and S×CG, the following analyses were performed using the animal model presented above: A=single-trait analysis omitting S×CG; B=single-trait analysis including S×CG; C=two-trait analysis omitting S×CG; D=two-trait analysis including S×CG; E=three-trait analysis omitting S×CG; F=three-trait analysis including S×CG. In summary, at this point, 12 analyses were preformed (two traits (BW or WW) – three definitions of production environments (single, two or three environments) – S×CG included or omitted from the model). The S×CG was included as an additional uncorrelated random effect in the model. Because traits were measured on different animals in two or three environments, the residual covariances were set to zero. The (co)variance and structure for random components for a multi-trait analysis (two or three production environments) with S×CG included can be described as
 $${\mathop{\rm var}} \left[ \matrix{ {\rm d} \hfill \cr {\rm m} \hfill \cr P_{{\rm e}} \hfill \cr Scg \hfill \cr {\rm e} \hfill \cr} \right]=\left[ {\matrix{ {G_{\rm d} \,\otimes\,A} & {G_{{\rm dm}} \,\otimes\,A} & 0 & 0 & 0 \cr {G_{{\rm dm}} \,\otimes\,A} & {G_{\rm m} \,\otimes\,A} & 0 & 0 & 0 \cr 0 & 0 & {P_{\rm e} \,\otimes\,I_{c} } & 0 & 0 \cr 0 & 0 & 0 & {Scg\,\otimes\,I_n } & 0 \cr 0 & 0 & 0 & 0 & {R\,\otimes\,I_n } \cr } } \right]$$
where G d and G m are (co)variance matrices of direct additive genetic effects and maternal additive genetic effects, respectively; G dm is a matrix of additive genetic (co)variances between direct and maternal effects; P e is a (co)variance matrix of maternal permanent environmental effects; Scg is a (co)variance matrix of S×CG effects; R is a (co)variance matrix of residual effects; A is the additive relationship matrix among all animals in the pedigree; I is the identity matrix; c is the number of dams of animals with records; and n is the number of animals with records.
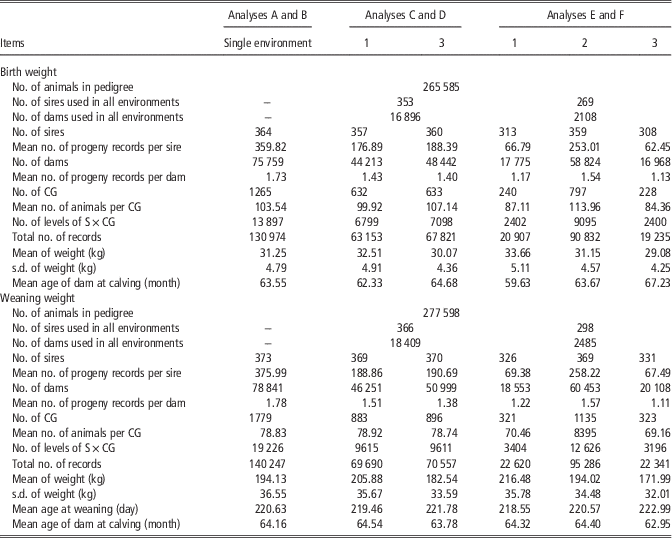
Table 1 shows the summary of the data sets used to estimate genetic parameters. All analyses were performed using Gibbs sampling with GIBBS2F90 (Misztal et al., Reference Misztal, Tsuruta, Strabel, Auvray, Druet and Lee2002). The prior distribution for the (co)variance components was the non-informative Wishart distribution for all random effects. Each analysis consisted of a single chain with a length of 250 000 samples, discarding the first 50 000 samples. A lag period of 25 samples was used. Thus, 8000 samples were used for final inferences.
Summary of the data set used for estimation of variance components of birth weight and weaning weight of composite beef cattle

s.d.=standard deviation; CG=contemporary group; S×CG=sire×contemporary group interaction; A=single-trait analysis with S×CG omitted; B=single-trait analysis with S×CG included; C=two-trait analysis with S×CG omitted; D=two-trait analysis with S×CG included; E=three-trait analysis with S×CG omitted; F=three-trait analysis with S×CG included; 1=favorable environment; 2=intermediate environment; 3=unfavorable environment.
Genetic evaluation and model comparison
The genetic evaluation of this population was carried out using the simpler models: single-trait animal model that omitted or included the S×CG. To evaluate the predictive ability of these models, two additional data sets were considered for each trait as suggested by Bohmanova et al. (Reference Bohmanova, Miglior, Jamrozik, Misztal and Sullivan2008). The first data set included all weight records available until 2004 (DATA04), and the second included all records available until 2008 (DATA08).
The genetic evaluations were carried out by using variance components previously estimated from the variance component data sets. The first evaluation (GE04) used DATA04 and the second (GE08) used DATA08. Thus, it was possible to compare the models by an error of prediction (ERP) of estimated breeding values (EBV) of young bulls (Sullivan et al., Reference Sullivan, Wilton, Schaeffer, Jansen, Robinson and Allen2005):
 $${\rm ERP}=\sqrt {{{\mathop{\sum}\nolimits_{i=1}^n {{({EBV08}_i \,{\minus}\,{PA04}_i )}^2 } } \over n}} $$
where EBV08 was the EBV computed from GE08, PA04 is the average of animal’s parent EBV calculated by GE04, and n is the number of bulls with no progeny records in DATA04 and at least 25 progeny records in DATA08. The differences in average of EBV between the two genetic evaluations were accounted by subtracting the average change in EBV from GE04 to GE08 for a set of bulls whose average EBV was not expected to change. As suggested by Bohmanova et al. (Reference Bohmanova, Miglior, Jamrozik, Misztal and Sullivan2008), the bulls chosen for the adjustment were required to have at least 25 progeny records in GE04, no new progeny record, and no more than 10 new grandsons between DATA04 and DATA08. The ERP was also computed for maternal breeding value.
Percentage of squared bias (PSB) was computed similarly to Ali and Schaeffer (Reference Ali and Schaeffer1987) and Bohmanova et al. (Reference Bohmanova, Miglior, Jamrozik, Misztal and Sullivan2008):
 $${\rm PSB}={{\mathop{\sum}\nolimits_{i=1}^n {{(y_{ij} \,{\minus}\,{\hat{y}}_{ij} )}^2 } } \over {\mathop{\sum}\nolimits_{i=1}^n {{(y_{ij} )}^2 } }}$$
where
 $$y_{ij} $$
was the ith observed record of jth trait,
 $${\hat{y}}_{ij} $$
was the ith predicted record of jth trait, and n was the number of records for BW or WW. The correlation (ROP) between observed weight records in DATA08 with predicted records by GE08 was computed as well as residual variance using DATA08. To take into account the complexity of the model, the deviance information criterion (DIC) proposed by Spiegelhalter et al. (Reference Spiegelhalter, Best, Carlin and van der Linde2002) was applied as a comparison criterion. The DIC is composed of a measure of global fit, posterior mean of the deviance and a penalization for complexity of the model:
 $${\rm DIC}=2\overline{{\rm D}} \,{\minus}\,{\rm D}({\overline{\theta } }_M )=\overline{{\rm D}} {\plus}p_{\rm D} $$
where
 $${\overline{\theta } }_M $$
is the vector of average values for all parameters in a given model (M) at the end of a Markov Chain Monte Carlo sampling process. The complexity of model M as effective number of parameters is given by
 $$p_{\rm D}=\overline{{\rm D}} \,{\minus}\,{\rm D}({\overline{\theta } }_M ) $$
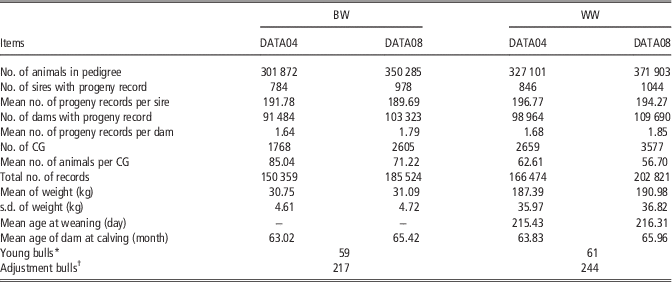
, that is, represents the difference between the posterior mean of the deviance and the deviance based on the posterior mean of the parameters under model M. Smaller values of DIC are indicative of a better-fitting model. The changes in accuracy (BIF, 1986) from both genetic evaluations were also evaluated. The summary of the data sets used for genetic evaluation is shown in Table 2.
Summary of the data sets used for genetic evaluation that omitted or included the sire×contemporary group interaction from the model of birth weight (BW) and weaning weight (WW) of composite beef cattle population

DATA04=data with all weight records available until 2004; DATA08=data with all weight records available until 2008; CG=contemporary group; s.d.=standard deviation.
* Bulls with no progeny record in DATA04 and at least 25 progeny records in DATA08.
† Bulls with at least 25 progeny records in DATA04, no new progeny record, and no more than 10 new grandsons records from DATA04 to DATA08.
Results and discussion
Data structure
On the basis of the definition of environments used in the present study, mean BW and WW and their standard deviations were always higher in more favorable environments (Table 1). Mean age at weaning was slightly lower in favorable environments. In agreement with Bradfield et al. (Reference Bradfield, Graser and Johnston1997), these findings indicate differences in rearing conditions between environments related to feeding and management practices, among other factors. There was no pattern of variation in the age of dam at calving between environments. The percentage of sires used in all production environments was high (>80% for the different analyses). All sires with progeny weight records had offspring in at least two farms, a fact permitting adequate estimation of the genetic correlation between production environments.
Genetic parameters and genotype by production environment interaction
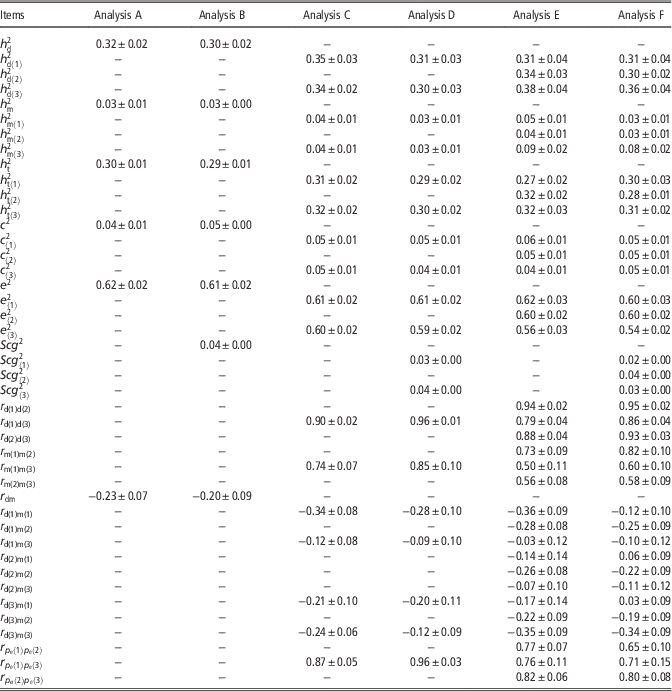
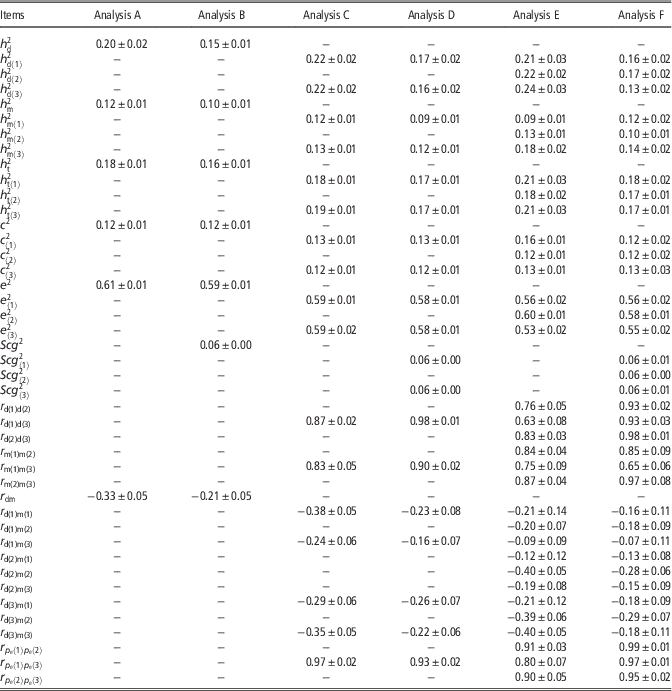
In general, the estimates of direct and maternal heritability and fraction of phenotypic variance due to maternal permanent environmental effects for BW and WW were similar between environments. The largest differences were observed between models that omitted or included S×CG (Tables 3 and 4). These estimates are similar to those reported in other studies involving the present population of composite beef cattle raised in a (sub)tropical environment (Mourão et al., Reference Mourão, Ferraz, Eler, Balieiro, Bueno, Mattos and Figueiredo2007; Santana et al. Reference Santana, Eler, Cardoso, Albuquerque, Bignardi and Ferraz2012). A higher direct heritability was observed for BW, whereas maternal heritability and fraction of phenotypic variance due to maternal permanent environmental effects were higher for WW. The same pattern of genetic parameters has been reported by Albuquerque and Meyer (Reference Albuquerque and Meyer2001) and Santana et al. (Reference Santana, Eler, Cardoso, Albuquerque, Bignardi and Ferraz2012) for the weight of Nelore and composite cattle, respectively. These findings indicate that the traits studied should respond satisfactorily to selection in both favorable and unfavorable environments. The same observation was made by Santana et al. (Reference Santana, Eler, Cardoso, Albuquerque and Ferraz2013) in a study involving the cattle population studied here and using reaction norms to evaluate the effect of G×E.
Posterior means (±s.d.) of genetic parameters for birth weight of composite beef cattle from the analyses that omitted or included the sire×contemporary group interaction (S×CG)

A=single-trait analysis with S×CG omitted; B=single-trait analysis with S×CG included; C=two-trait analysis with S×CG omitted; D=two-trait analysis with S×CG included; E=three-trait analysis with S×CG omitted; F=three-trait analysis with S×CG included;
 $h_{{\rm d}}^{2} $
=direct additive heritability;
 $h_{{\rm m}}^{2} $
=maternal additive heritability;
 $h_{{\rm t}}^{2} $
=total heritability;
 $c^{2} $
=fraction of phenotypic variance due to maternal permanent environmental effects;
 ${\rm Scg}^{2} $
=S×CG variance as proportion of phenotypic variance;
 $r_{{{\rm dm}}} $
=genetic correlation between direct additive and maternal genetic effect;
 $r_{{p_{{\rm e}} }} $
=maternal permanent environmental correlation; 1=favorable environment; 2=intermediate environment; 3=unfavorable environment.
Posterior means (±s.d.) of weaning weight of composite beef cattle from the analyses that omitted or included the sire×contemporary group interaction (S×CG)

A=single-trait analysis with S×CG omitted; B=single-trait analysis with S×CG included; C=two-trait analysis with S×CG omitted; D=two-trait analysis with S×CG included; E=three-trait analysis with S×CG omitted; F=three-trait analysis with S×CG included;
 $h_{{\rm d}}^{2} $
=direct additive heritability;
 $h_{{\rm m}}^{2} $
=maternal additive heritability;
 $h_{{\rm t}}^{2} $
=total heritability;
 $c^{2} $
=fraction of phenotypic variance due to maternal permanent environmental effects;
 ${\rm Scg}^{2} $
=S×CG variance as proportion of phenotypic variance;
 $r_{{{\rm dm}}} $
=genetic correlation between direct additive and maternal genetic effect;
 $r_{{p_{{\rm e}} }} $
=maternal permanent environmental correlation; 1=favorable environment; 2=intermediate environment; 3=unfavorable environment.
Considering the models that omitted S×CG for BW (analyses C and E) and the posterior means of correlations between direct genetic effects, no important genotype×production environment interaction was observed (Table 3). However, when examining the highest posterior-density intervals (HPD95%), the correlation between favorable and unfavorable environments (analysis E) reached a value of 0.70 (data not shown), a fact that may lead to changes in the ranking of sires across environments.
The genotype×production environment interaction was important for WW (Table 4) under the definition of the three production environments (analysis E). The posterior mean of the genetic correlation between direct effects was 0.63 in favorable and unfavorable environments. The HPD95% for this parameter ranged from 0.72 to 0.92 (analysis C) and from 0.63 to 0.83 and 0.44 to 0.77 (analysis E) between favorable and intermediate environments and between favorable and unfavorable environments, respectively. Therefore, the genotype×production environment interaction may be important for genetic evaluations of favorable and other environments. The genetic correlations between direct effects were low as also reported by Bradfield et al. (Reference Bradfield, Graser and Johnston1997) for WW of Australian Santa Gertrudis cattle (0.64), by Lopes et al. (Reference Lopes, Rorato, Weber, Boligon, Comin and Dornelles2008) for the BW and WW of Nelore cattle raised in southern Brazil (−0.04 to 0.79), and by Santana et al. (Reference Santana, Eler, Cardoso, Albuquerque, Bignardi and Ferraz2012) for the BW and WW of composite beef cattle raised in different regions of Brazil (−0.02 to 0.92).
The genetic correlations between maternal effects mainly for BW (Table 3) were low between extreme environments (analyses C and E). Bradfield et al. (Reference Bradfield, Graser and Johnston1997) reported a correlation of 0.38 between maternal genetic effects in extreme environments and concluded that changes in the ranking of animals across production environments can be expected. The correlations between direct and maternal genetic effects for all traits were always low and negative (analyses A, C and E). Similar estimates have been reported by Eler et al. (Reference Eler, Van Vleck, Ferraz and Lobo1995 and Reference Eler, Ferraz, Golden and Pereira2000) for WW (−0.13) and for BW and WW (−0.33 to −0.14) of Nelore cattle, respectively, and by De Mattos et al. (Reference De Mattos, Bertrand and Misztal2000) for WW of Hereford cattle in the United States, Canada and Uruguay (−0.51 to −0.31). According to Maniatis and Pollott (Reference Maniatis and Pollott2003), the negative estimates obtained for the correlation between direct and maternal genetic effects in the present study might be because of the small number of dams with weight records (18% and 19% for BW and WW, respectively). In this respect, some authors suggest to define the covariance between direct and maternal genetic effects as zero (Meyer, Reference Meyer1995). In general, the correlations between maternal permanent environmental effects of WW in different environments were close to unity. The same observation was made by Bradfield et al. (Reference Bradfield, Graser and Johnston1997) who estimated a correlation of 0.99 between maternal permanent environmental effects of WW in Santa Gertrudis cattle.
Sire×contemporary group interaction
Contrasting analyses A and B, C and D, and E and F (Tables 3 and 4), the direct heritability estimates for BW and WW were overestimated on average by 9% and 41%, respectively, when S×CG was not included in the model. Bradfield et al. (Reference Bradfield, Graser and Johnston1997) observed 50% overestimation of direct heritability for WW in Santa Gertrudis cattle when S×CG was omitted. Eler et al. (Reference Eler, Ferraz, Golden and Pereira2000) found that direct heritability estimates for BW and WW of Nelore cattle were overestimated by 76% and 22%, respectively, when sire×herd interaction was not included in the model. In a study on South African Bonsmara cattle, Nephawe et al. (Reference Nephawe, Neser, Roux, Theron, van der Westhuizen and Erasmus1999) reported that the omission of S×CG in the model can overestimate direct heritability for WW by 180%. Maternal heritability estimates were also affected by inclusion of S×CG in the model. Maternal heritability for BW and WW was overestimated on average by 36% and 24%, respectively, when S×CG was omitted. Nephawe et al. (Reference Nephawe, Neser, Roux, Theron, van der Westhuizen and Erasmus1999) reported 30% overestimation of maternal heritability for WW in Bonsmara cattle, corresponding to an average overestimation of total heritability for WW of 34%. In the present study, average overestimation of this parameter was 7% for BW and 13% for WW. Therefore, overestimation of genetic parameters is a problem inherent to the omission of S×CG effects in the model. In addition, the overestimation of genetic parameters can result in the incorrect ranking of animals as reported by Bradfield et al. (Reference Bradfield, Graser and Johnston1997). No important changes in maternal permanent environmental variance as proportion of phenotypic variance were observed when S×CG was included in the model for BW and WW. The same was reported by Neser et al. (Reference Neser, Konstantinov and Erasmus1996).
The S×CG explained 2% to 4% and 6% of the phenotypic variance in BW (Table 3) and WW (Table 4), respectively, indicating that this effect is more marked for WW, but is also important for BW. The greater relative importance of S×CG during the subsequent phase of life of the animal might be explained by cumulative environmental effects on animal performance. These results agree with those reported by Bradfield et al. (Reference Bradfield, Graser and Johnston1997) for WW of Santa Gertrudis cattle (10% to 13%), by Nephawe et al. (Reference Nephawe, Neser, Roux, Theron, van der Westhuizen and Erasmus1999) for WW of Bonsmara cattle (6% to 14%) and by Neser et al. (Reference Neser, Konstantinov and Erasmus1996) for WW of Bonsmara cattle (8%).
Contrasting analyses C and D and E and F, that is, models that omitted or included S×CG in two- or three-trait (production environments) analyses, all direct genetic correlations were close to unity when S×CG was included in the model. The mean increase in these parameters was 6% and 25% for BW and WW, respectively. Thus, in many cases, no important effect of G×E was observed after inclusion of S×CG in the model (analyses D and F). The same trend was observed by Bradfield et al. (Reference Bradfield, Graser and Johnston1997) for WW of Santa Gertrudis cattle in Australia. In that study, the genetic correlation of WW between two production environments was 0.66 when S×CG was omitted and 0.83 when this parameter was included. Nephawe et al. (Reference Nephawe, Neser, Roux, Theron, van der Westhuizen and Erasmus1999) estimated genetic correlations of 0.39 to 0.54 between WW of Bonsmara cattle across different regions of Africa when S×CG was omitted and these correlations ranged from 0.79 to 0.85 when S×CG was included in the model. In a study on Limousin cattle in the United States, Bertrand et al. (Reference Bertrand, Hough and Benyshek1987) observed that the genetic correlations of BW and WW across regions increased when the effect of S×CG and cow×contemporary group interaction was included in the model. Taken together, these findings indicate the need for inclusion of S×CG to model the effect of G×E on BW and WW in the present population in Brazil. The increase in maternal genetic correlations was smaller when S×CG was included in the model, probably because only sire interactions were considered. The mean increase of this parameter was 13% and 2% for BW and WW, respectively.
The posterior means of correlations between direct and maternal genetic effects across environments were close to zero when S×CG was included in the model and even became positive values in some cases (analyses, B, D and F). Nephawe et al. (Reference Nephawe, Neser, Roux, Theron, van der Westhuizen and Erasmus1999) observed consistently negative correlations between direct and maternal genetic effects for BW of Bonsmara cattle raised in four regions of South Africa when S×CG was omitted, whereas the correlations were mainly positive when S×CG was included in the model. Eler et al. (Reference Eler, Ferraz, Golden and Pereira2000) reported genetic correlations between direct and maternal effects for growth traits of Nelore cattle in Brazil that were close to zero or even positive when sire×herd interaction was included in the model, and that were always negative when this parameter was omitted. It therefore seems that the omission of S×CG leads to problems of estimating the correlation between direct and maternal genetic effects. In the present study, the inclusion of S×CG in the model was not sufficient to render all the genetic correlations between direct and maternal effects zero or positive, but contributes to reduce the estimation problem of this parameter when the structure of maternal phenotypic records is poor.
Genetic evaluation and model comparison
Table 5 shows the results of comparison of the genetic evaluation models. The model including S×CG (analysis B) provided a lower ERP for both direct and maternal breeding values of BW and WW than the model omitting S×CG (analysis A). The ERP obtained by analysis B was lower for the prediction of maternal breeding values than direct breeding values. As observed for ERP, the model including S×CG also provided lower PSB and residual variance when compared with the model omitting this effect. The ROP was higher for the model including S×CG and this model can therefore also be considered the best model based on this criterion. As none of these criteria takes into account the parameterization of the model, the DIC was evaluated for each model. No important difference in the goodness-of-fit was observed between the models omitting and including S×CG for BW and WW. Nevertheless, the DIC selected the model including S×CG as the best.
Percentage increase or decrease of error of prediction (ERP), squared bias (PSB), correlation between observed and predicted weights (ROP), residual variance (RV), effective number of parameters (p D), and deviance information criterion (DIC) of the model that included the sire×contemporary group interaction (S×CG) as deviation from the model that omitted the S×CG in the genetic evaluation of composite beef cattle population

BW=birth weight; WW=weaning weight; A=single-trait analysis with S×CG omitted; B=single-trait analysis with S×CG included; d=direct breeding value; m=maternal breeding value.
In general, comparison of the two models cited above showed a reduction in accuracy of direct and maternal breeding values for BW and WW. The mean changes in accuracy for all sires were −4% and +1.4% for direct and maternal EBV of BW, respectively. For WW, the change was −5% and −4% for direct and maternal EBV, respectively. Therefore, in the present population, accuracy estimates might be overestimated when the effect of S×CG is not included in the genetic evaluation model of BW and WW. When the model including S×CG was used, the amplitude of direct and maternal EBV for BW was reduced by 35% and 41% and the amplitude of direct and maternal EBV for WW was reduced by 11% and 4%, respectively. Araújo et al. (Reference Araújo, Torres, Costa, Pereira, Lopes, Euclydes and Torres Filho2001) concluded that omission of sire×herd interaction increases the amplitude of sire EBV because of higher additive genetic variance, which results in lower prediction error variance and consequent overestimation of accuracy. According to Meyer (Reference Meyer1987), genetic evaluations of sires should take into account the effect of sire×environment interaction to reduce the effects of preferential treatment and also to prevent the overestimation of accuracy of sires, particularly those used in a few herds. The inclusion of S×CG in the model is important to account for the distribution of progeny of sires between herds and contemporary groups (Bertrand et al., Reference Bertrand, Berger and Willham1985). The model with S×CG allows the production of only one EBV (excluding G×E) per animal unlike multi-trait model and the reaction norms model used by Santana et al. (Reference Santana, Eler, Cardoso, Albuquerque, Bignardi and Ferraz2012 and Reference Santana, Eler, Cardoso, Albuquerque and Ferraz2013) to this same beef cattle population. This could limit the use of several bulls by the producers. However, the interaction component could be added to the EBV for each CG, thereby allowing the production of specific EBV for each production environment at a low computational cost.
Conclusion
The genotype×production environment interaction should not be neglected in the genetic evaluation of BW and WW in the present population of beef cattle. The model including S×CG contributed to prevent overestimation of the accuracy of breeding values of sires, provided a lower ERP for both direct and maternal breeding values, lower squared bias, residual variance and DIC than the model omitting S×CG. Thus, the inclusion of S×CG in the model is a feasible and plausible alternative to model the effects of G×E in the genetic evaluations.
Acknowledgements
The authors are grateful to CFM-Leachman Pecuária Ltda. for providing the data set.