INTRODUCTION
The loess–paleosol sequences on the Chinese Loess Plateau (CLP) represent one of the most continuous terrestrial records of interglacial–glacial cycles, and the loess–paleosol alternations have been used to infer paleoclimatic change (Liu, Reference Liu1985). Although the provenance of eolian deposits in the CLP has been studied for decades, this issue is still controversial (Lu and Sun, Reference Lu and Sun2000; Sun et al., Reference Sun, Zhang and Liu2001, Reference Sun, Tada, Chen, Liu, Toyoda, Tani, Ji and Isozaki2008, Reference Sun, Ding, Xia, Sun and Windley2018; Sun, Reference Sun2002a, Reference Sun2005; Rao et al., Reference Rao, Yang, Chen and Li2006; Chen et al., Reference Chen, Li, Yang, Rao, Lu, Balsam, Sun and Ji2007; Xiao et al., Reference Xiao, Zong, Li, Hu, Dupont-Nivet, Peng and Zhang2012). It is still unclear whether the provenance of the eolian deposits changed during the glacial–interglacial cycles.
Many approaches have been used to determine the sediment provenance of Chinese loess, for example, isotopic (Sr, Nd, Pb) compositions (Gallet et al., Reference Gallet, Jahn and Torii1996; Sun, Reference Sun2002a, Reference Sun2005; Rao et al., Reference Rao, Yang, Chen and Li2006; Chen et al., Reference Chen, Li, Yang, Rao, Lu, Balsam, Sun and Ji2007; Sun and Zhu, Reference Sun and Zhu2010; Zeng et al., Reference Zeng, Liang, Peng, Yu and Xiang2015), zircon U-Pb ages (Stevens et al., Reference Stevens, Palk, Carter, Lu and Clift2010, Reference Stevens, Carter, Watson, Vermeesch, Andò, Bird, Lu, Garzanti, Cottam and Sevastjanova2013; Che and Li, Reference Che and Li2013; Fenn et al., Reference Fenn, Stevens, Bird, Limonta, Rittner, Vermeesch, Andò, Garzanti, Lu and Zhang2017; Sun et al., Reference Sun, Ding, Xia, Sun and Windley2018), mineralogical methods (Xie and Ding, Reference Xie and Ding2007; Stevens et al., Reference Stevens, Carter, Watson, Vermeesch, Andò, Bird, Lu, Garzanti, Cottam and Sevastjanova2013; Wang et al., Reference Wang, Wu, Tan, Fu, Wen and Li2019), and chemical (major and trace elements) characteristics (Zhang et al., Reference Zhang, Zhang, Zhu, Zhang, An, Chen and Huang1996; Gallet et al., Reference Gallet, Jahn, Lanoë, Dia and Rossello1998; Guan et al., Reference Guan, Pan, Gao, Li, Zhang and Wang2008; Feng et al., Reference Feng, Hu, Ju and Zhu2011).
In addition to the geochemical methods noted, physical parameters can be also used in tracing loess provenance. Recently, luminescence characteristics have been applied to study sedimentary provenance by using either sensitivity or saturation characteristics of quartz grains. Use of luminescence characteristics in sediment tracing or sediment fingerprinting is based on the grain's crystallographic defects, previous sunlight exposure, and irradiation history, all of which are related to sediment movement over time and space (Gray et al., Reference Gray, Jain, Sawakuchi, Mahan and Tucker2019). Previous applications of luminescence as a sediment tracer have been used to study provenance and the relationship between distance and luminescence sensitivity in fluvial sediments (Pietsch et al., Reference Pietsch, Olleya and Nanson2008; Sawakuchi et al., Reference Sawakuchi, Blair, DeWitt, Faleiros, Hyppolito and Guedes2011, Reference Sawakuchi, Jain, Mineli, Nogueira, Bertassoli, Häggi, Sawakuchi, Pupim, Grohmann and Chiessi2018; McGuire and Rhodes, Reference McGuire and Rhodes2015a, Reference McGuire and Rhodes2015b); coastal deposits (Rink, Reference Rink2003; Sawakuchi et al., Reference Sawakuchi, Blair, DeWitt, Faleiros, Hyppolito and Guedes2011, Reference Sawakuchi, Guedes, DeWitt, Giannini, Blair, Nascimento and Faleiros2012; Tsukamoto et al., Reference Tsukamoto, Nagashima, Murray and Tada2011); eolian deposits, including deserts (Zheng et al., Reference Zheng, Zhou and Qin2009; Lü and Sun, Reference Lü and Sun2011; Gong et al., Reference Gong, Sun, Lü and Tian2014, Reference Gong, Sun and Lü2015); and loess (Li and Wintle, Reference Li and Wintle1994; Lai and Wintle, Reference Lai and Wintle2006; Lü and Sun, Reference Lü and Sun2011; Lü et al., Reference Lü, Sun, Li, Gong and Xue2014).
Luminescence sensitivity (the luminescence produced per unit mass per unit dose of radiation) is a useful parameter to distinguish sediments from different source areas (Pietsch et al., Reference Pietsch, Olleya and Nanson2008; Zheng et al., Reference Zheng, Zhou and Qin2009; Lü and Sun, Reference Lü and Sun2011; Sawakuchi et al., Reference Sawakuchi, Blair, DeWitt, Faleiros, Hyppolito and Guedes2011, Reference Sawakuchi, Jain, Mineli, Nogueira, Bertassoli, Häggi, Sawakuchi, Pupim, Grohmann and Chiessi2018; Lü et al., Reference Lü, Sun, Li, Gong and Xue2014). Pietsch et al. (Reference Pietsch, Olleya and Nanson2008) observed an increase in the optically stimulated luminescence (OSL) sensitivity of quartz from the bed of the Castlereagh River in inland New South Wales. Similarly, the OSL sensitivity of fluvial sediments with a short transport distance was lower than that of coastal sands with long sedimentary history (Sawakuchi et al., Reference Sawakuchi, Blair, DeWitt, Faleiros, Hyppolito and Guedes2011). Although Sawakuchi et al. (Reference Sawakuchi, Jain, Mineli, Nogueira, Bertassoli, Häggi, Sawakuchi, Pupim, Grohmann and Chiessi2018) have not observed this phenomenon, their OSL and infrared stimulated luminescence (IRSL) signals still provide much information to reconstruct past drainage configurations within the Amazon basin. OSL sensitivity and thermoluminescence (TL) sensitivity of eolian samples from Chinese (Zheng et al., Reference Zheng, Zhou and Qin2009; Lü and Sun, Reference Lü and Sun2011) and Australian deserts (Fitzsimmons et al., Reference Fitzsimmons, Rhodes and Barrows2010) have been studied. Quartz grains from different regions show different OSL and TL sensitivities that can be used for sediment fingerprinting.
Relevant to this study, the temporal variation of luminescence sensitivity of quartz grains from loess–paleosol sequences of the Luochuan Section in the central CLP has been used as a tracing proxy to infer provenance shifts in glacial and interglacial cycles (Lü et al., Reference Lü, Sun, Li, Gong and Xue2014). However, it is the only section that recorded temporal luminescence sensitivity fluctuations, and more research is needed in different parts of the CLP.
Compared with the central CLP, the eolian deposits in the northern CLP, which are located in a more fragile ecosystem and thus more sensitive to environmental change, provide evidence for the retreat–advance history of desert environments controlled by the cyclic East Asian monsoon circulations (Sun and Ding, Reference Sun and Ding1998; Ding et al., Reference Ding, Derbyshire, Yang, Sun and Liu2005; Yang and Ding, Reference Yang and Ding2008). In the northern CLP, eolian sand is intercalated with loess or paleosol horizons. Stratigraphic studies of these sand–loess–soil sequences have led to an interpretation that the sand and loess horizons were deposited during glacial times, whereas the soil developed in the warm/humid episodes of interglacial periods (Sun and Ding, Reference Sun and Ding1998; Sun et al., Reference Sun, Yin, Ding, Liu and Chen1998b, Reference Sun, Ding, Liu, Rokosh and Rutter1999; Singhvi et al., Reference Singhvi, Bluszcz, Bateman and Someshwar Rao2001). Although the eolian deposits in both the northern and central CLP have been controlled by cyclic climatic oscillations, questions remain as to whether or not they have the same provenance and similar temporal variation trends.
In recent years, “pseudo” single-grain OSL measurements, in which more than one grain is placed in each hole on single-grain disk, have been used to assess the suitability of equivalent dose measurements and the multigrain OSL age (Arnold et al., Reference Arnold, Demuro and Navazo Ruiz2012; Demuro et al., Reference Demuro, Arnold, Froese and Roberts2013; Douka et al., Reference Douka, Jacobs, Lane, Grün, Farr, Hunt and Inglis2014; Li et al., Reference Li, Jacobs and Roberts2016, Reference Li, Jacobs, Roberts, Galbraith and Peng2017). Different from true single-grain OSL measurement, pseudo single-grain OSL measurement is much like a very small multigrain aliquot (Arnold et al., Reference Arnold, Demuro and Navazo Ruiz2012). In this paper, we study the single-aliquot and pseudo single-grain (~20 grains per hole on a standard single-grain disk) luminescence sensitivity of quartz grains from the northern CLP. We aim to: (1) study the temporal fluctuations of luminescence sensitivity in the northern CLP since the last interglaciation; (2) examine the spatial changes of luminescence sensitivity for selected time spans by comparing the values from the northern and central CLP; and (3) discuss the factors that influence the temporal and spatial variations of the luminescence sensitivity of quartz grains.
GEOLOGIC SETTING AND SAMPLING
The Shimao Section (37°56′24″N, 109°59′01″E) is located at the boundary between the Mu Us Desert and the CLP (Fig. 1). The section has been studied for paleoclimate reconstructions (Sun and Ding, Reference Sun and Ding1998; Sun et al., Reference Sun, Ding, Liu, Rokosh and Rutter1999) and has been dated by OSL (Lü et al., Reference Lü, Sun and Gong2018; Fig. 2). The stratigraphic units can be divided into three categories: eolian sand beds, loess, and paleosols (Sun et al., Reference Sun, Ding, Liu, Rokosh and Rutter1999). It is worth noting that the last glacial loess (L1) and the interglacial paleosols (S1) within the Shimao Section contain interbedded sand and/or loess layers; subdivisions are indicated by adding a hyphen followed by a number: for example, L1-1 and S1-1, following the scheme of Rutter et al. (Reference Rutter, Ding, Evans and Liu1991; Fig. 2).
(color online) Map showing the Chinese Loess Plateau (CLP) and the locations of the Shimao and Luochuan Sections.

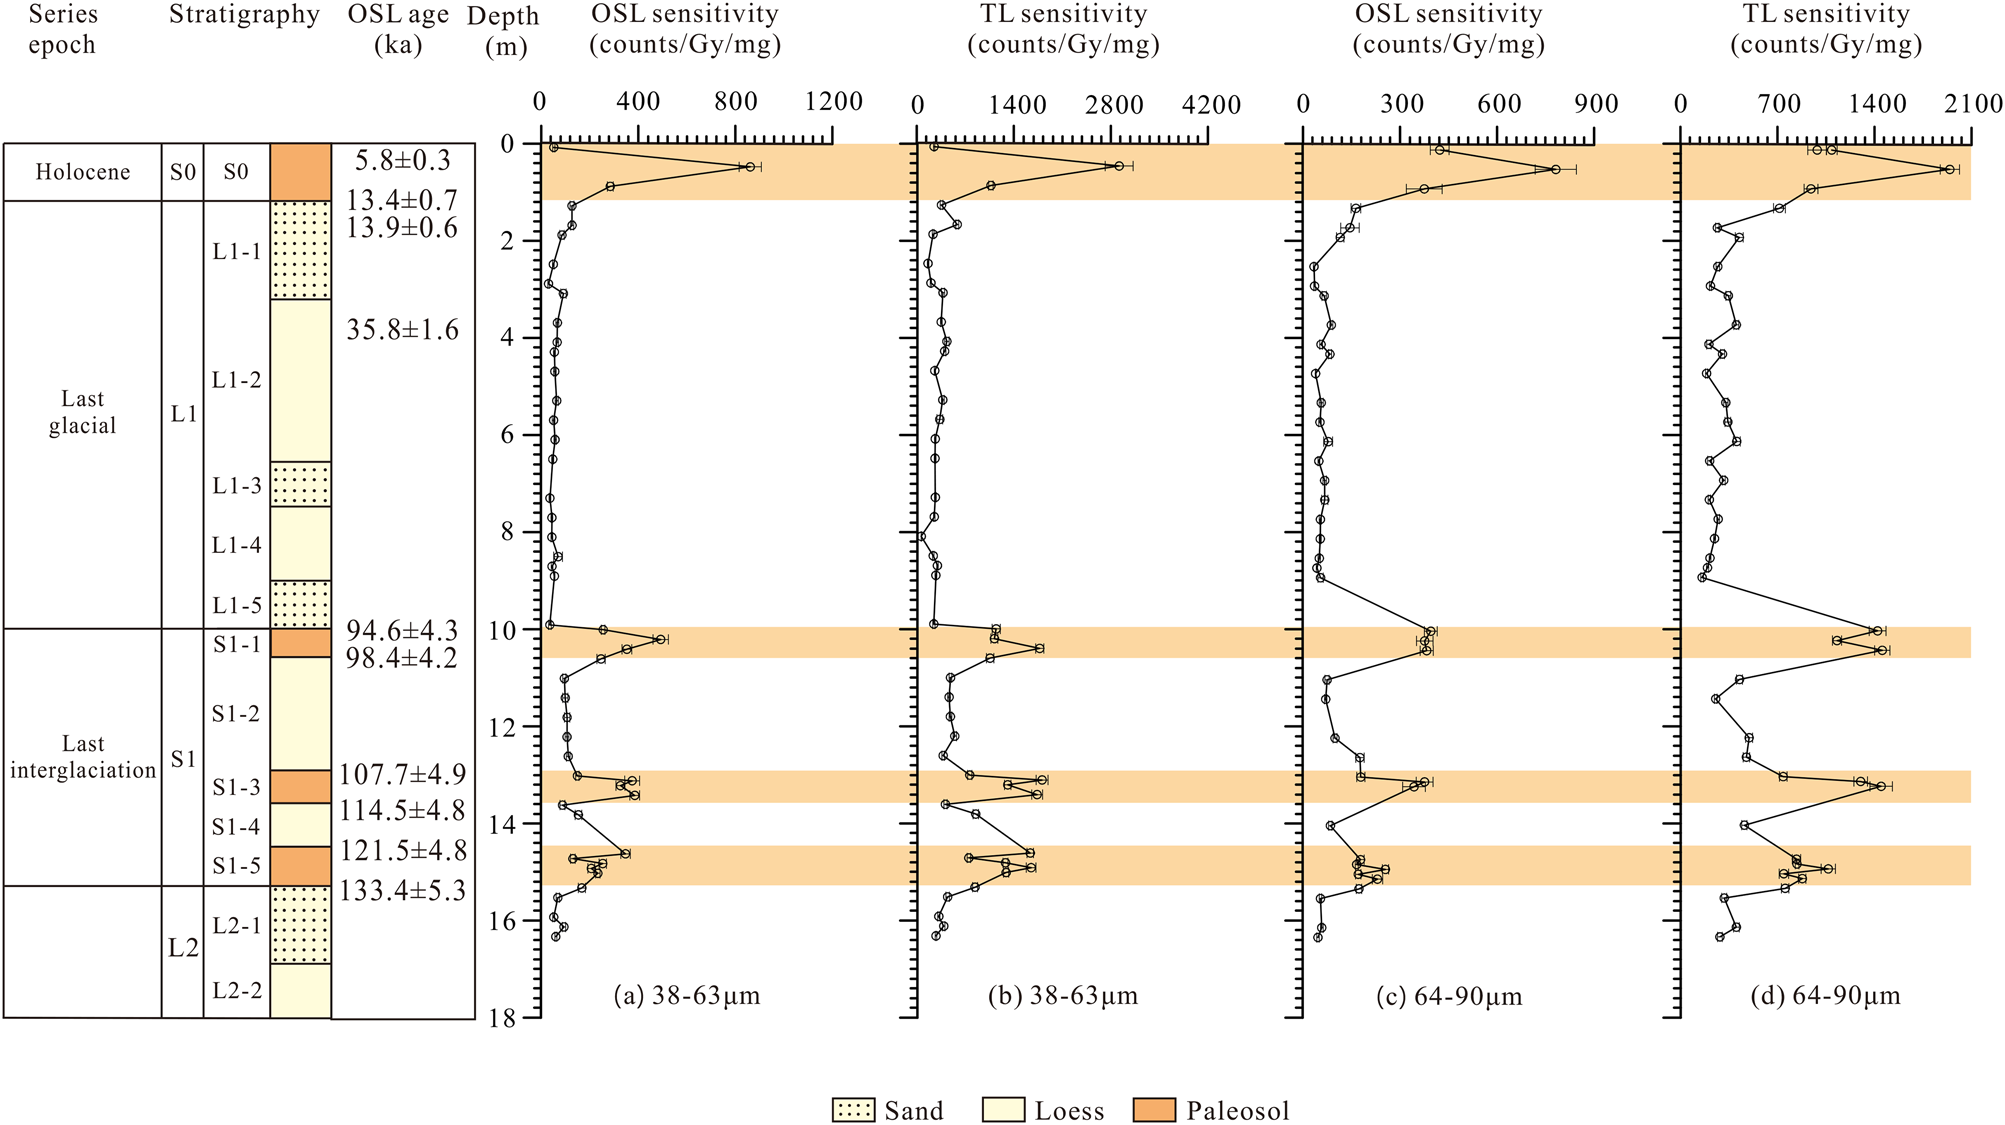
(color online) Results of single-aliquot optically stimulated luminescence (OSL) sensitivity and thermoluminescence (TL) sensitivity of different factions of quartz grains from the Shimao Section: (a and b) grains in the 38–63 μm fraction; (c and d) grains in the 64–90 μm fraction. Stratigraphy of the Shimao Section and the 10 OSL ages are from Lü et al. (Reference Lü, Sun and Gong2018).

Our study focuses on the upper part of the Shimao Section, which has been described in detail by Lü et al. (Reference Lü, Sun and Gong2018; Fig. 2). According to field observations, the OSL chronology, and the previous correlation between the magnetic susceptibility of the Shimao Section (Sun et al., Reference Sun, Yin, Ding, Liu and Chen1998b; Lü et al., Reference Lü, Sun and Gong2018), the studied eolian deposits consist of an ~1-m-thick Holocene sandy loam (S0), underlain by an ~9-m-thick last glacial eolian sequence (L1), and an ~5-m-thick last interglacial sequence (S1). Here, L1 consists of three eolian sand beds (L1-1, L1-3, and L1-5), and two interbedded loess beds (L1-2 and L1-4). The last interglacial S1 includes three dull orange paleosols (S1-1, S1-3, and S1-5) and two interbedded silty loess beds (S1-2 and S1-4). Below S1 is another eolian sand layer (L2).
In this study, 91 bulk samples were collected (at 10-cm intervals in paleosols and 20-cm intervals in other layers). At least 50 samples were chosen to study their luminescence sensitivity. All the bulk samples were used to analyze grain size and magnetic susceptibility in order to reconstruct paleoclimatic changes.
Different from the Shimao Section, the Luochuan Section (35°45′N, 109°25′E), located in the central CLP, has only loess beds and paleosols, without sand intercalations (Liu, Reference Liu1985; Sun and Liu, Reference Sun and Liu2000). The temporal OSL sensitivity information of this section is from Lü et al. (Reference Lü, Sun, Li, Gong and Xue2014).
METHODOLOGY
Sample preparation and instruments
Pretreatments of samples for the luminescence sensitivity study were carried out in natural light. First, bulk samples were washed with water using an ultrasonic cleaning machine. Then they were treated with 10% HCl and 10% H2O2 to remove carbonates and organic materials, respectively. After drying, the 64–90 μm and 38–64 μm fractions were separated by wet sieving. Subsequently, density separation was performed using an aqueous solution of sodium polytungstate to isolate quartz grains. The fraction of grains with densities of 2.62 g/cm3 and 2.75 g/cm3 were treated with 40% hydrofluoric acid for 40 minutes to remove any remaining feldspars, and the outer layer was irradiated by alpha particles. IRSL and the 110°C TL peak were used to check for feldspar contamination (Li, Reference Li2002).
For the single-aliquot sensitivity test, the sample grains were mounted on the center of aluminum disks (~3 mm) using silicone oil spray. The quartz grains on each disk were examined under the microscope to ensure a monolayer of quartz grains. Disks were weighed before and after mounting the disks in order to get the weights of sediment and to weight normalize luminescence signals, using a high-precision (with readability of 0.01 mg) analytical electronic balance. The unit of single-aliquot OSL sensitivity is counts/Gy/mg.
The pseudo single-grain OSL sensitivity measurement was made on grains of 38–64 μm in diameter using the standard single-grain disks, where each hole was 300 μm deep and 300 μm in diameter. It is estimated that ~20 grains were placed in each hole on a standard single-grain disk using a 10 μm needle brush under the microscope. For each sample, two single-grain disks were used for the measurements. We handpicked about 20 grains into each hole to ensure that each hole had a similar number of grains; therefore, further weight normalization was not needed. The unit of pseudo single-grain OSL sensitivity is counts/Gy.
The pretreatment and single-aliquot OSL measurements were carried out in the Luminescence Dating Laboratory, Institute of Geology and Geophysics, Chinese Academy of Sciences, using a Risø TL/OSL DA-15 reader. The pseudo single-grain OSL measurements were performed in the Luminescence Dating Laboratory, Department of Anthropology, University of Washington, using a Risø TL/OSL DA-20 reader. Single-aliquot OSL sensitivity and pseudo single-grain OSL sensitivity measurement parameters are given in Table 1.
Single-aliquot and pseudo single-grain optically stimulated luminescence (OSL) sensitivity measurement parameters.

Particle size was measured for all samples with a SALD-3001 laser-diffraction particle analyzer. After the organic matter and carbonates were removed (see details in Ding et al., Reference Ding, Ren, Yang and Liu1999), all samples were dispersed by ultrasonic pretreatment with addition of 20% (NaPO3)6 solutions for particle determination.
The environmental (or external) dose rate was calculated from uranium, thorium, and potassium content determined using an inductively coupled plasma mass spectrometry (ICP-MS) in the Analytical Laboratory, Beijing Research Institute of Uranium Geology (Bailey et al., Reference Bailey, Bray and Stokes2003). Beta and gamma dose rates were calculated using conversion factors taken from Adamiec and Aitken (Reference Adamiec and Aitken1998). Water contents of 5% for loess and of 10% for paleosols were estimated based on measurements during OSL dating of the Shimao Section (Lü et al., Reference Lü, Sun and Gong2018). The cosmic dose rate was estimated from the burial depth of samples and the latitude, longitude, and altitude of the section, following Prescott and Hutton (Reference Prescott and Hutton1994).
Measurement procedure
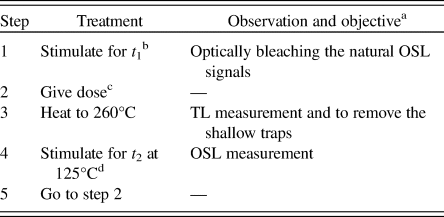
The luminescence sensitivity measurement procedure is from Lü et al. (Reference Lü, Sun, Li, Gong and Xue2014). The details are shown in Table 2. This procedure includes bleaching, three or four regenerative doses, and a zero-dose measurement. Bleaching by exposure to blue LED or green laser light is used to remove the natural OSL signals of quartz grains. The OSL and TL signals from the regenerative doses are used to build a dose–response curve. The growth curves were fit by the following equation (Lü et al., Reference Lü, Sun, Li, Gong and Xue2014).

where y represents luminescence signals after normalization for the single-aliquot OSL test (where this was done) for each dose; x is the given dose; and y 0, A, and B are model-fitting parameters. The sensitivity of quartz grains at a fixed dose can be obtained from the slope of a tangent line to the growth curve. To compare the luminescence sensitivity of quartz grains obtained from the Shimao Section with that of the Luochuan Section, a dose of 10 Gy was chosen for the location of the tangent. For each sample in the Shimao Section, 14 aliquots were measured for luminescence sensitivity; the average of these aliquots was used as the luminescence sensitivity of each sample.
Experimental methods for luminescence sensitivity measurement.

a OSL, optically stimulated luminescence; TL, thermoluminescence.
b For single-aliquot OSL, t 1 = 40 s. For pseudo single-grain OSL, t 1 = 10 s.
c For single-aliquot OSL, four regenerative doses (5, 10, 15, and 0 Gy) were applied. For pseudo single-grain OSL, about six regenerative doses (10, 18, 26, 34, 42, and 0 Gy) were applied.
d For single-aliquot OSL, t 2 = 40 s. For pseudo single-grain OSL, t 2 = 1 s.
For the single-aliquot and pseudo single-grain luminescence sensitivity measurements, different regenerative doses were given based on the efficiency of the readers. Instead of the four regenerative doses (5, 10, 15, and 0 Gy) applied in the single-aliquot measurement, about 10, 18, 26, 34, 42, and 0 Gy were applied in the pseudo single-grain test. Actual doses to each hole vary somewhat from one other, so calibration was required. We emphasize that the calibration of the source on 38–64 μm grains was not performed at the University of Washington; instead, the 180–212 μm grains were used for calibration. Although this approach may introduce some systematic errors, it was used for all the samples, so the errors have similar magnitudes.
For the pseudo single-grain measurement, 12 samples were chosen to test the pseudo single-grain OSL sensitivity. For each sample, two disks, each with 100 holes, were used to do the tests.
For the single-aliquot measurement, the 110°C TL and OSL signals were normalized by weight. However, normalization of pseudo single-grain measurements was not considered necessary, because the holes were filled with approximately the same number of quartz grains.
RESULTS
Variations of the single-aliquot OSL and TL sensitivity of quartz grains
The temporal variations of the OSL and TL sensitivity of quartz grains from the Shimao Section during the last interglacial–glacial period are shown in Figure 2. Two different fractions (38–64 μm and 64–90 μm) were tested. The results show that they have similar OSL and TL sensitivity values, and both show a similar trend versus depth. First, the TL sensitivity is much higher than that of the OSL. Second, the average TL sensitivity of the 38–64 μm fraction is higher than that of 64–90 μm fraction. Third, the last interglacial soil (S1) and the Holocene loam soil (S0) have higher luminescence sensitivity than that of the last glacial loess (L1). The highest value for S0 is from sample sm03, where the counts are 878 ± 46 counts/Gy/mg. For S1, the luminescence sensitivity can be subdivided into three peaks and two troughs. Finally, in the last interglacial period, most of the values are greater than 100 counts/Gy/mg, with 11 values greater than 200 counts/Gy/mg. In the last glacial period, by comparison, no values are higher than 100 counts/Gy/mg.
Single-aliquot OSL sensitivity of quartz grains (38–64 μm) was also compared with both magnetic susceptibility (Lü et al., Reference Lü, Sun and Gong2018) and particle size (Fig. 3). Our results show a good correlation between the OSL sensitivity and the magnetic susceptibility. However, the OSL sensitivity shows a different trend compared with that of the median particle size.
(color online) Correlations among the fluctuations of optically stimulated luminescence (OSL) sensitivity of quartz grains (a), thermoluminescence (TL) sensitivity (b), the magnetic susceptibility (c), and the median grain size (d) of the upper 16.3 m of the Shimao loess–paleosol sequence. Each error bar of luminescence sensitivity represents a standard error. The magnetic susceptibility records are from Lü et al. (Reference Lü, Sun and Gong2018).

Changes in the pseudo single-grain OSL sensitivity of quartz grains
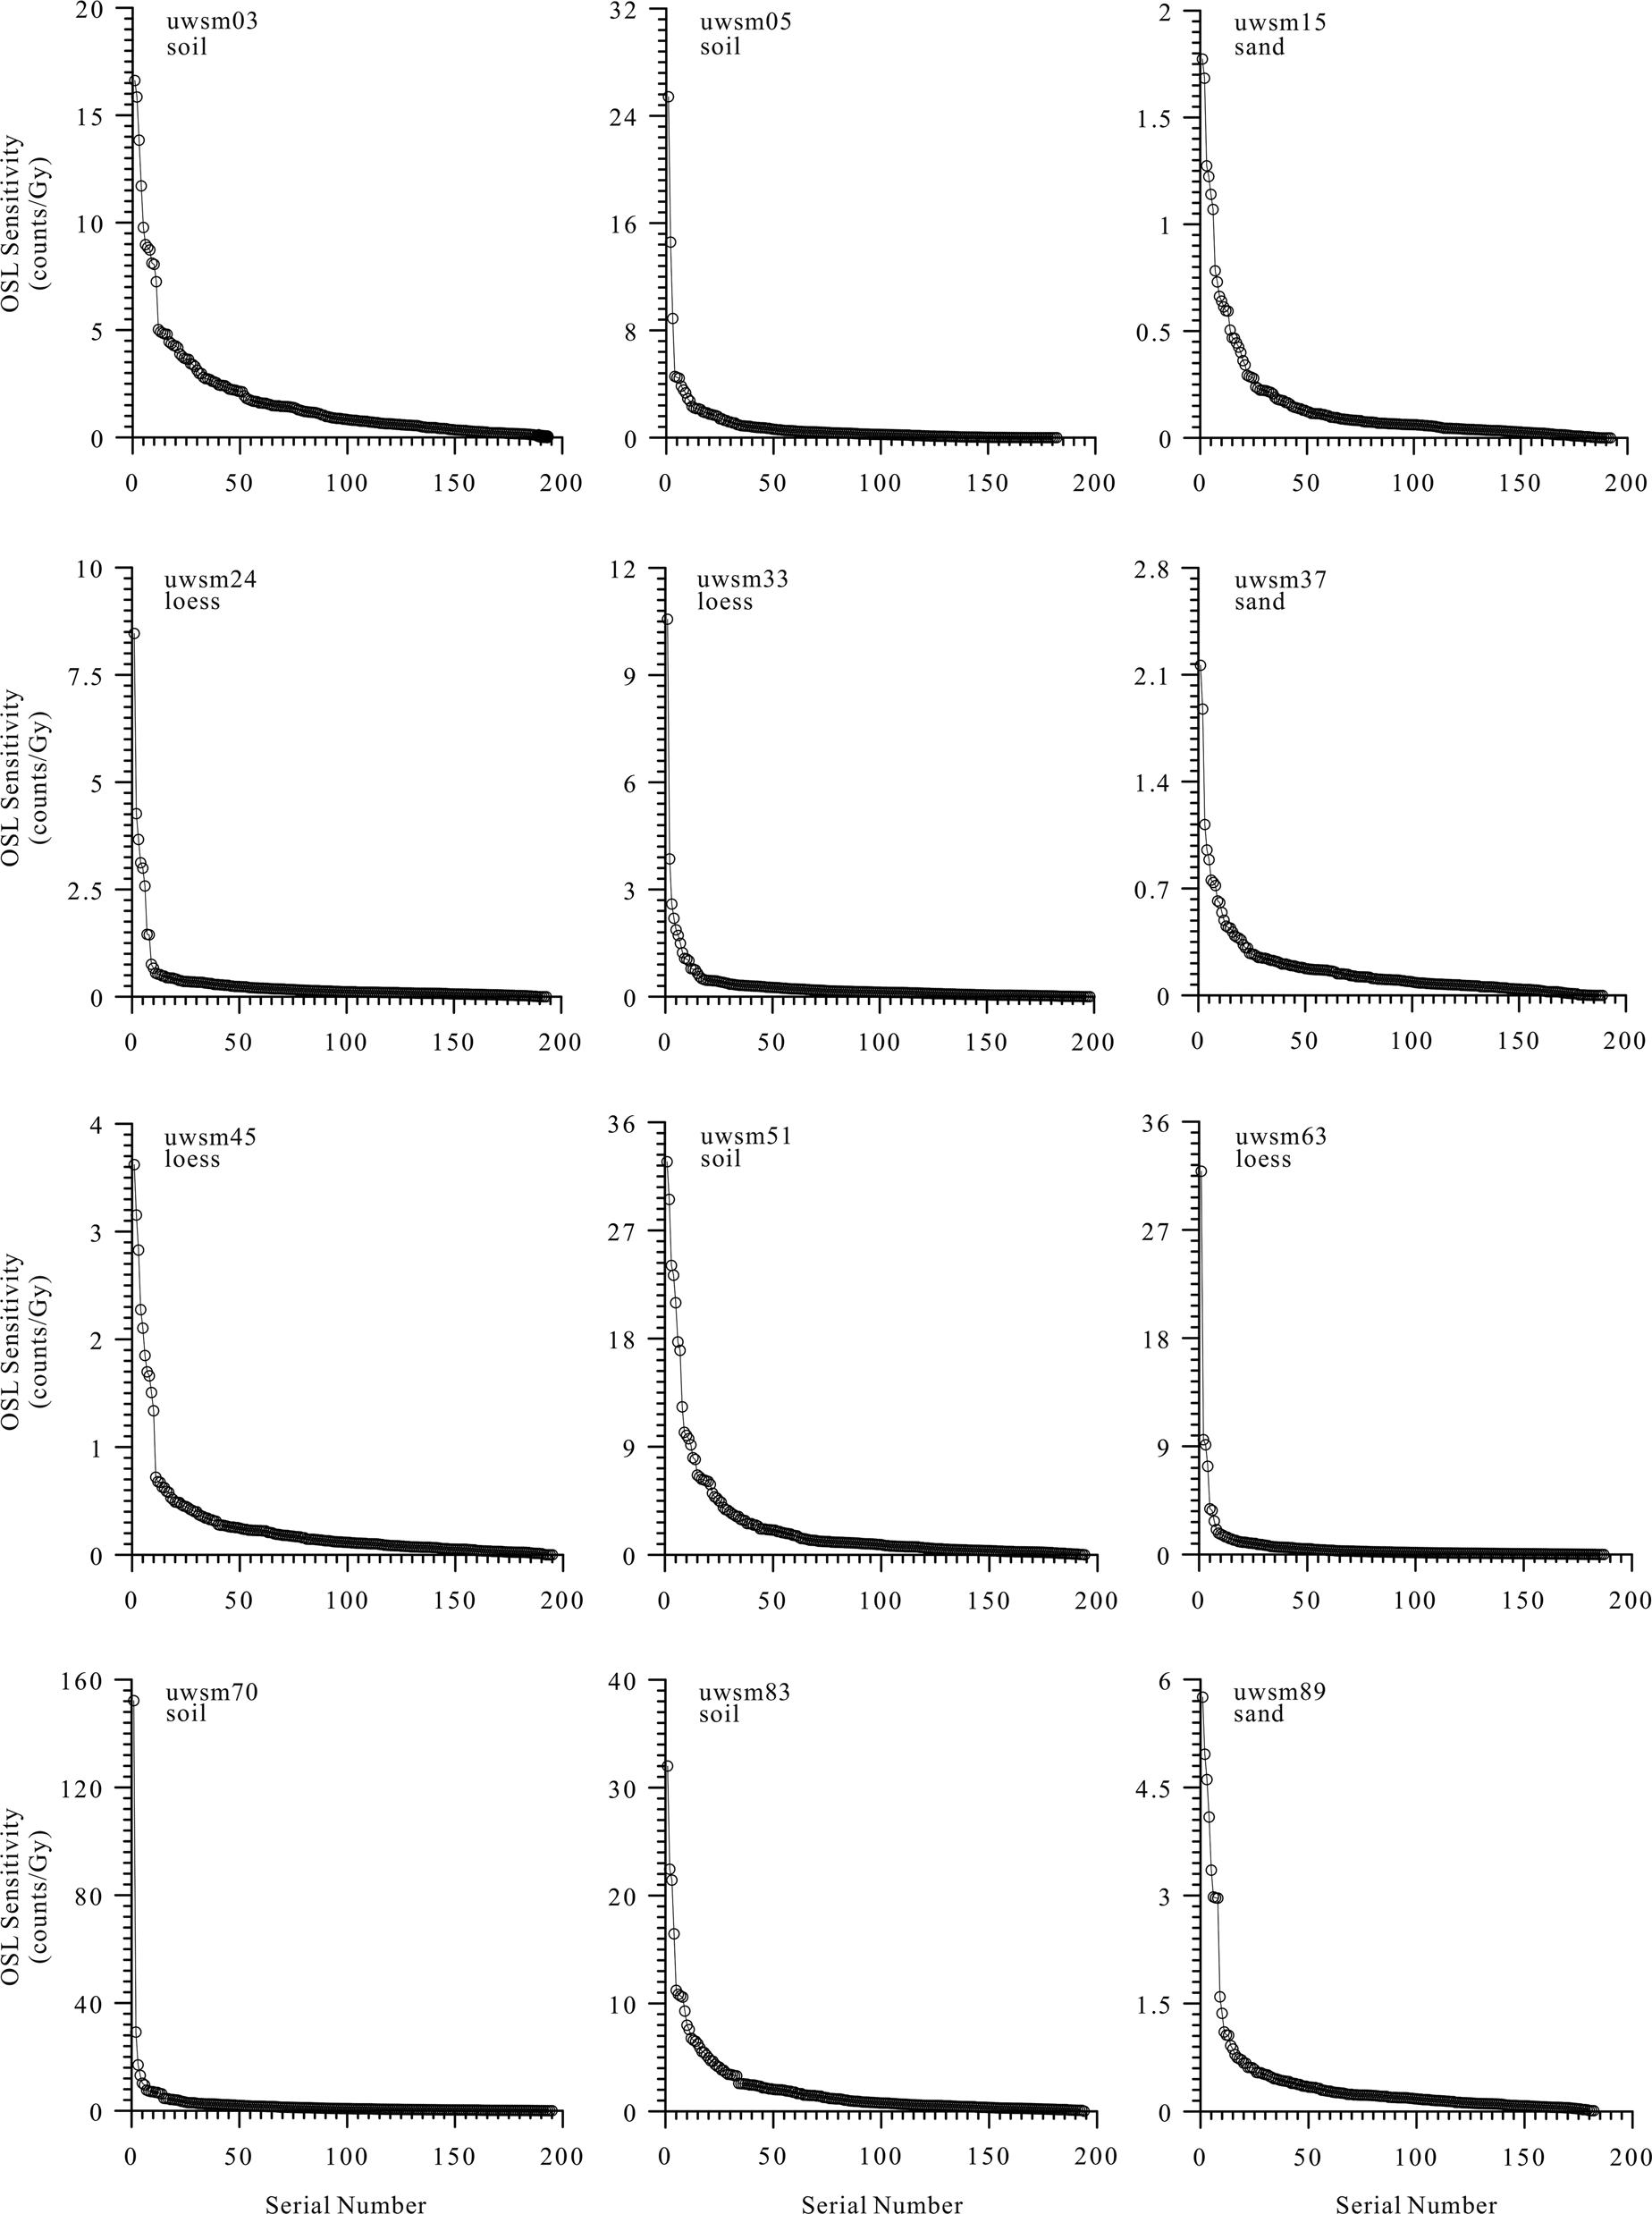
Figure 4 places the sensitivity values in order from the greatest (first) to the least (last). We define a quartz grain as “bright” when its OSL sensitivity is greater than 4 counts/Gy. In this context, paleosol samples have more bright grains than those of loess and sand samples (Fig. 4). For the loess sample uwsm45, most of the OSL sensitivity values are less than 2 counts/Gy, and none is greater than 4 counts/Gy, suggesting that quartz grains from loess have lower OSL sensitivity. By comparison, the uwsm70 paleosol samples, with an OSL sensitivity of 152 counts/Gy, have more bright grains. For this sample, 26 pseudo single-grain OSL sensitivity values are greater than 4 counts/Gy.
The distribution of the pseudo single-grain optically stimulated luminescence (OSL) sensitivities of 12 samples listed in decreasing order. The samples used in pseudo single-grain measurement (“uwsmxx”) are the same samples used in single-aliquot OSL measurement. For example, uwsm03 is the same as sm03. The “uw” prefix is just used to distinguish the pseudo single-grain measurements and the single-aliquot measurements.

The cumulative percentage of OSL sensitivity values is shown in Figure 5. Each point on the curve represents the percentage of grains with sensitivity values greater than the corresponding value on the x-axis. This allows the different distributions of bright and dim grains to be compared among samples. The paleosol sample uwsm51 has 13.40% of quartz grains with sensitivities greater than 4 counts/Gy. However, for the sand sample uwsm15, only 3.13% of quartz grains have OSL sensitivity values from 1 to 2 counts/Gy; whereas the other grains have less than 1 count/Gy. Higher cumulative probability of bright grains is responsible for the higher OSL sensitivity in the paleosol sample. In other words, the higher sensitivity of the paleosol samples is a function of a higher proportion of bright grains.
(color online) Cumulative probability distributions of the pseudo single-grain optically stimulated luminescence (OSL) sensitivity of 12 samples.

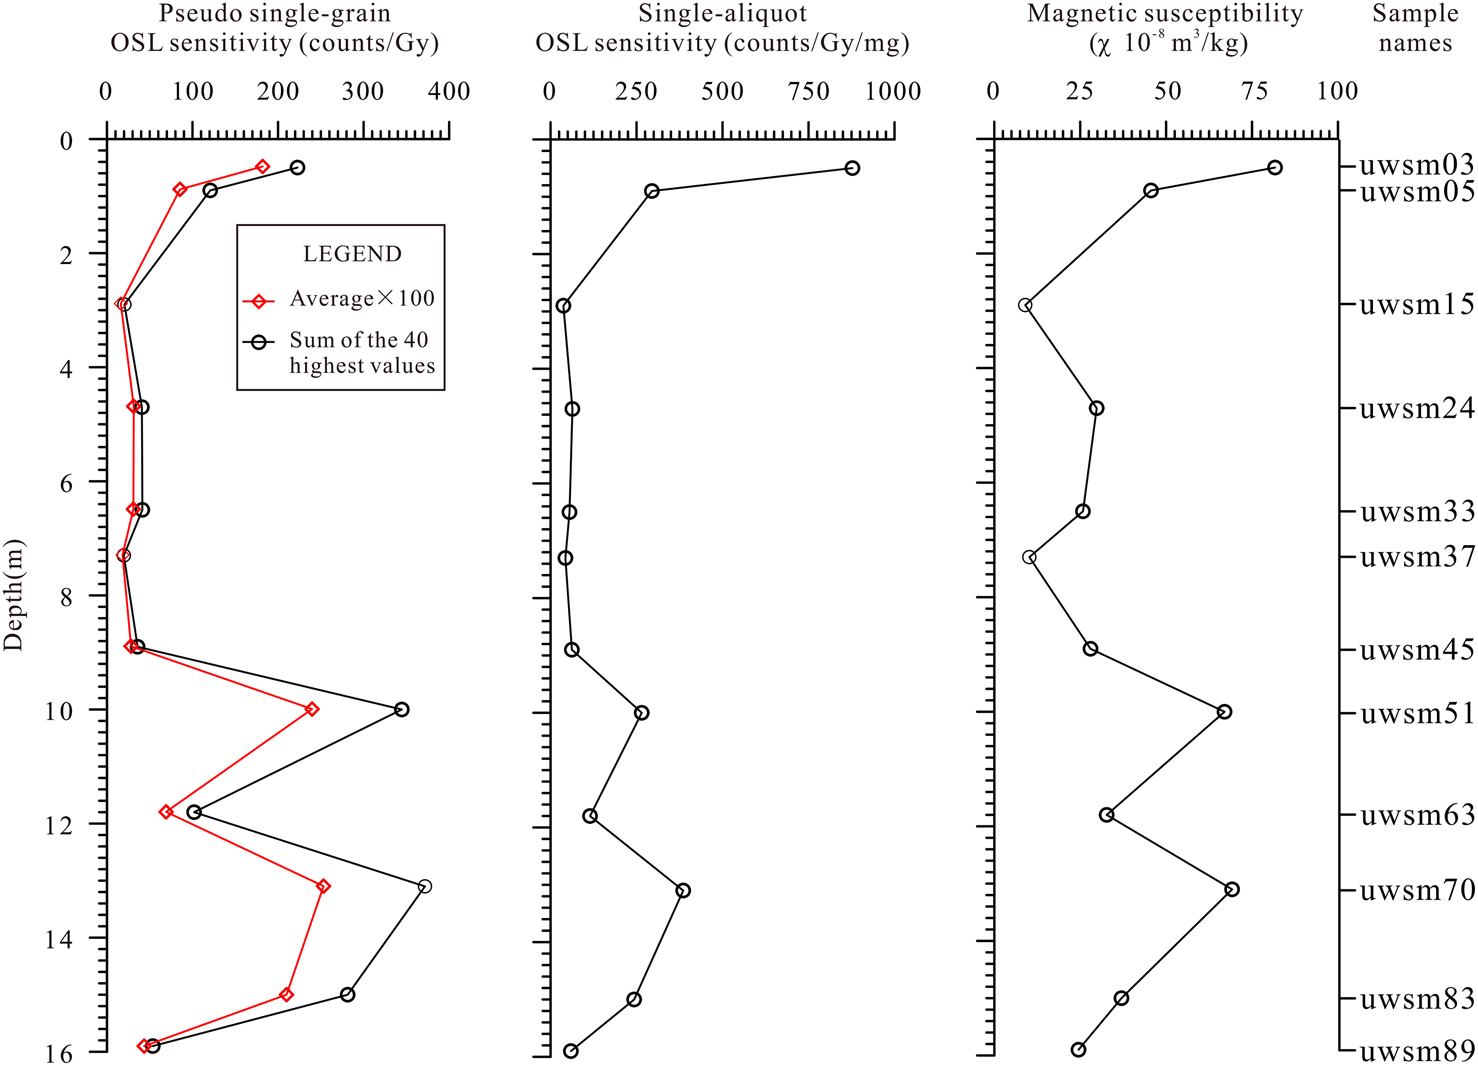
Figure 6 compares the sensitivity of the pseudo single-grain (both the average value of all grains [diamonds] and the sum of the 40 highest values [circles] for each sample) with that of the single aliquots, as well as the magnetic susceptibility. It shows that they all show a similar variation trend with depth.
Correlations among the pseudo single-grain optically stimulated luminescence (OSL) sensitivity, single-aliquot OSL sensitivity, and magnetic susceptibility of 12 samples. The red diamond represents the average value of all the single grain sensitivities, and the black circle is the sum of the 40 highest values. (For interpretation of the references to color in this figure legend, the reader is referred to the web version of this article.)

DISCUSSION
Spatial changes in luminescence sensitivity of quartz grains from the loess–paleosol sequence in the CLP
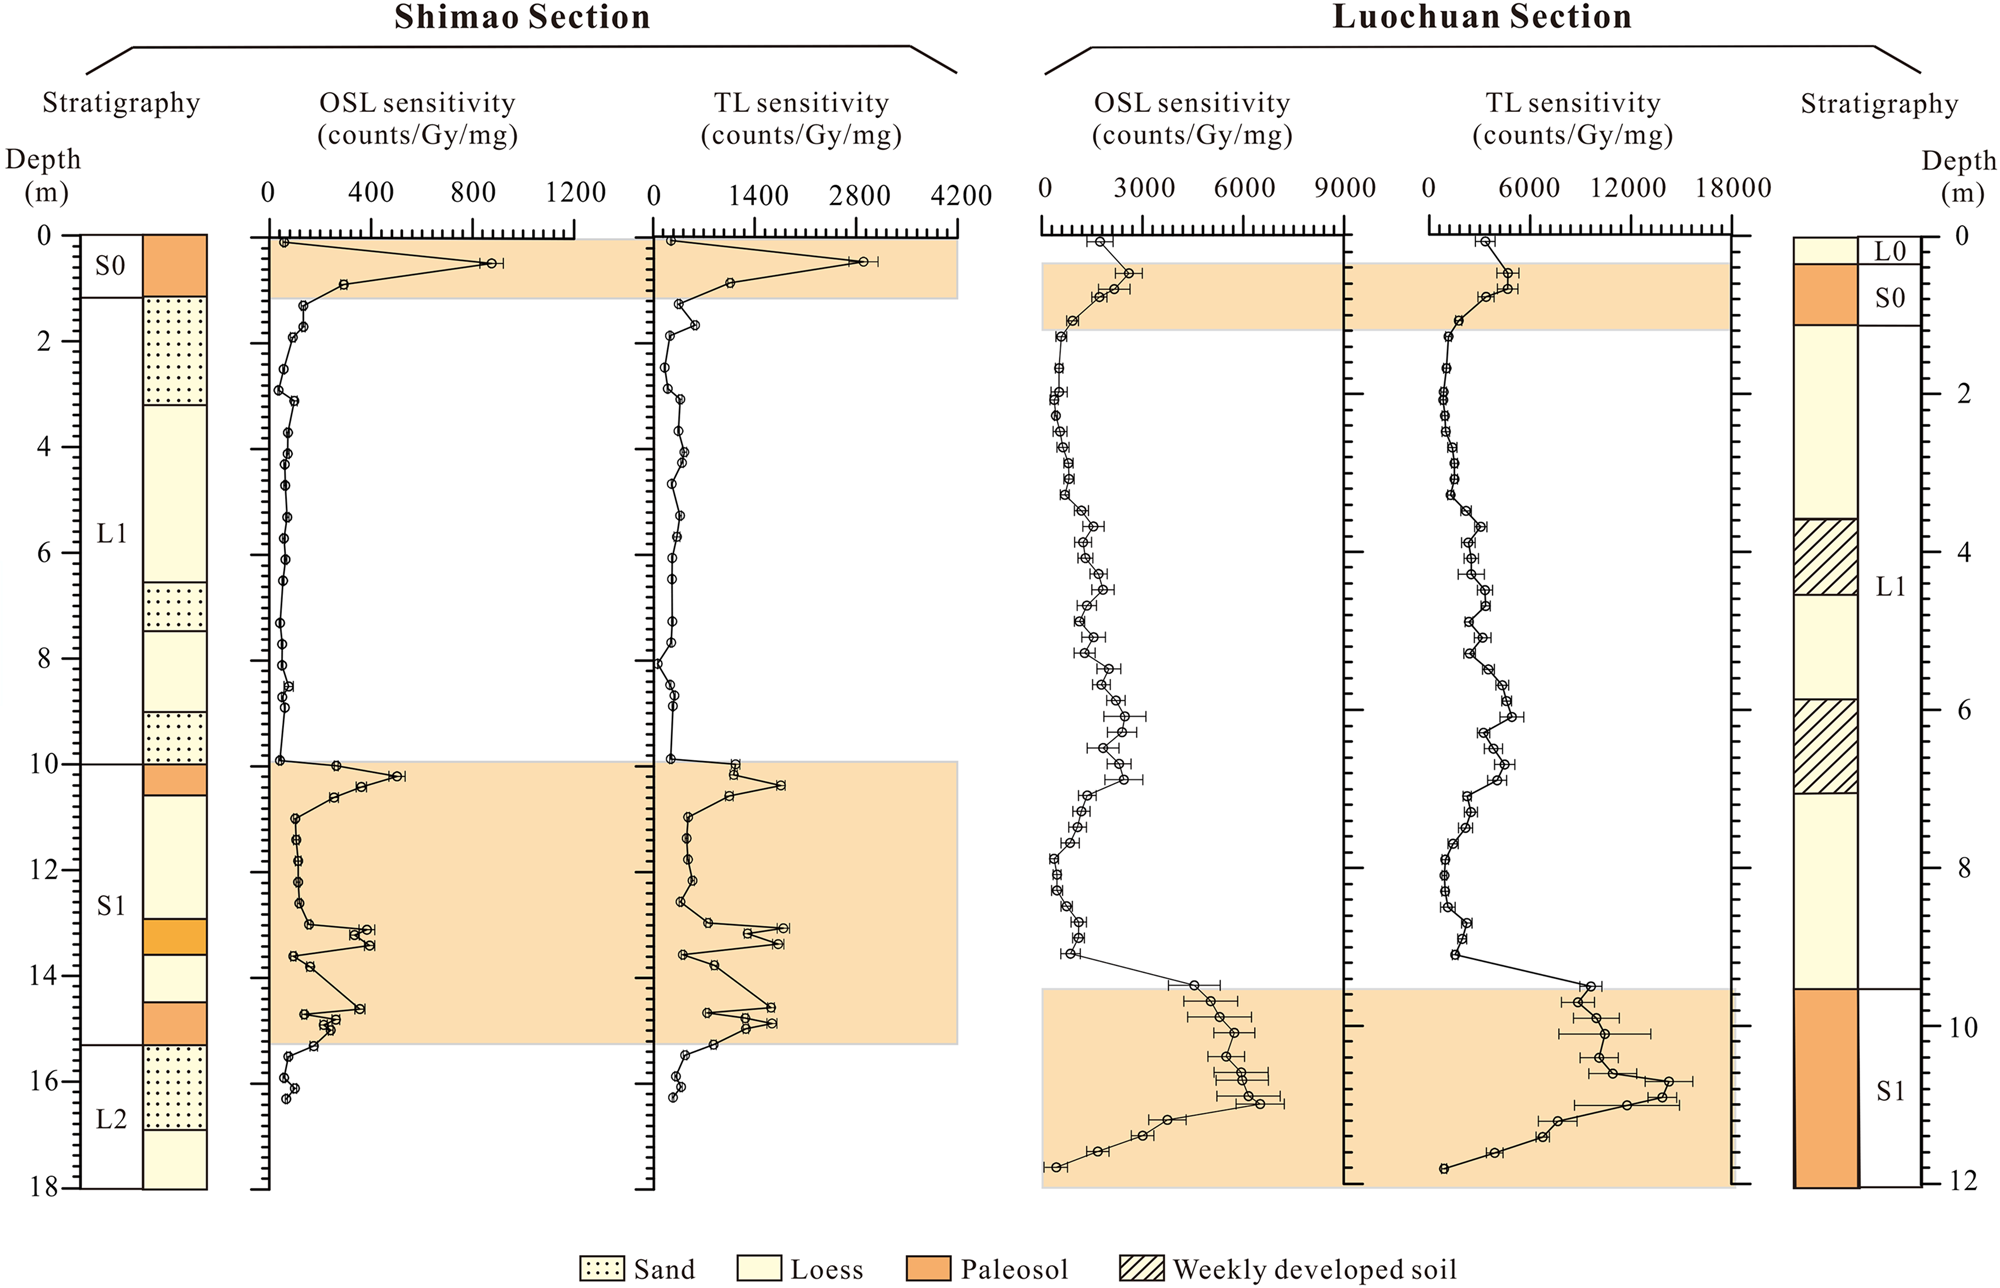
Size-dependent vertical variations of the OSL and TL sensitivities of quartz grains from the loess–paleosol sequence of the Shimao and Luochuan Sections since the last interglaciation are compared (Fig. 7). Changes in luminescence sensitivity at Luochuan have been reported in Lü et al. (Reference Lü, Sun, Li, Gong and Xue2014). The changes in sensitivity with age at both locations show similar trends. The last interglacial soil (S1) and the Holocene loam soil (S0) have higher luminescence sensitivity values compared with the loess or sand/loess beds. But there are some differences between them. First, the luminescence sensitivity values of quartz grains of the loess–palosol sequence from the Luochuan Section are higher than those of the same beds from the Shimao Section. For example, the highest and lowest value of OSL sensitivity from the Luochuan Section is 6485 ± 717 and 410 ± 45 counts/Gy/mg, respectively (Lü et al., Reference Lü, Sun, Li, Gong and Xue2014), compared with the corresponding values of 878 ± 46 counts/Gy/mg (from S0, 38–64 μm grains) and 37 ± 2 counts/Gy/mg (from L1) at Shimao. Generally, the luminescence sensitivity values of quartz grains from the Luochuan Section are at least seven times higher than those of the Shimao Section. The second difference is that the luminescence sensitivity values of L1 of the Shimao Section do not show the remarkable peak–trough variations seen for the Luochuan Section.
(color online) Comparison between the single-aliquot optically stimulated luminescence (OSL) sensitivity and the thermoluminescence (TL) sensitivity of quartz grains (38–63 μm) of the Shimao Section and quartz grains (25–64 μm) of the Luochuan Section (data from Lü et al. Reference Lü, Sun, Li, Gong and Xue2014).

Evidence from the pseudo single-grain OSL sensitivity measurements
The pseudo single-grain (~20 grains per hole) OSL might not provide true single-grain resolution, but instead represents a very small multigrain aliquot (Arnold et al., Reference Arnold, Demuro and Navazo Ruiz2012). The pseudo single-grain OSL sensitivity measurement provides better resolution than the single-aliquot OSL. For the former, although the 3 mm window for each disk was used to limit the number of quartz grains in the single aliquots, there are still thousands of quartz grains on each disk. Variation in sensitivity among grains cannot be addressed, but pseudo single-grain can help resolve this question.
First, as indicated by Figure 4, more bright quartz grains contribute to the total signal in the paleosol than in the loess, which is the reason for the variation in sensitivity changes between them. Two typical samples from the paleosol (uwsm70) and loess bed (uwsm45) have been discussed previously (Fig. 4).
Second, differences not only exist between the loess and paleosol, but also between different loess samples. Two loess samples, uwsm24 and uwsm63, are compared. They are from last glacial loess bed and the interglacial loess layer, respectively. The total number of effective values (where signals are high enough to calculate a slope) is 193 for uwsm24 and 187 for uwsm63. For uwsm63, 46 sensitivity values are greater than 0.50 counts/Gy compared with only 13 values in uwsm24 (Fig. 4). Uwsm63 has five OSL sensitivity values greater than 5 counts/Gy, but uwsm24 has only one (Fig. 4).
Moreover, the distribution of bright versus dim grains varies greatly from sample to sample, as evidenced by the shape of the curves in Figure 4. The shape of the curves depends on the brightness of the grains and the number of bright grains. For example, the curve shapes of three samples (uwsm05, uwsm63, and uwsm70) are sharp, because these samples have just a few bright grains not seen in the single aliquots because of averaging. With the pseudo single-grain method, high sensitivity values are thus the result of a high proportion of bright grains. For example, the uwsm70 paleosol sample has a high sensitivity value of 152 counts/Gy.
Overall, we conclude that pseudo single-grain OSL sensitivity could provide more information than single-aliquot luminescence sensitivity. More bright quartz grains play a crucial role in the total signal in paleosols compared with loess. High luminescence sensitivity depends on a high proportion of bright grains. Although dull quartz grains dominate the loess samples, differences among them do exist.
Factors affecting spatiotemporal luminescence sensitivity changes
Although the pseudo single-grain OSL sensitivity reveals that more bright grains are found in paleosols than in loess, the origin of these bright grains is still unclear. Possible factors are discussed in the following sections.
The origin of the quartz grains and the influence on OSL sensitivity
Luminescence is the emission of light from the crystal during light exposure or heating. The mechanism of luminescence has been described by Aitken (Reference Aitken1985b, Reference Aitken1998). Trapped electrons serve as the “memory” of the accumulated exposure to radiation. Radiation initially detaches them from their parent nuclei; they are then trapped by localized charge deficiencies at defects in the crystal lattice. The light emission occurs when trapped electrons are released from the defects (by heat or light). The amount and type of electron traps, which affect the intensity of OSL and TL signals, are related to the atomic impurities or structural defects (such as atomic vacancies) of quartz crystals (Gray et al., Reference Gray, Jain, Sawakuchi, Mahan and Tucker2019).
Quartz is the principal mineral used in luminescence dating. The trace chemical composition of quartz has been studied using Laser Ablation ICP-MS, which indicates that the evolution of Al, Rb, Li, and Ti in the crystal structure is related to genetic processes such as the magnitude of the crystallization temperature and magma differentiation (Monnier et al., Reference Monnier, Lach, Salvi, Melleton, Bailly, Béziat, Monnier and Gouy2018). These impurity atoms (Al, Rb, Li, and Ti) affect the luminescence properties of quartz, which are therefore dependent on the conditions of mineral formation (Preusser et al., Reference Preusser, Chithambo, Gotte, Martini, Ramseyer, Sendezera, Susino and Wintle2009). Different temperature and pressure conditions of crystallization of rocks control the intrinsic defects of quartz (Guralnik et al., Reference Guralnik, Ankjærgaard, Jain, Murray, Müller, Wälle and Lowick2015). Both impurities and intrinsic defects influence the concentration of the trapped-charge population and the efficiency of radiative recombination (Gray et al., Reference Gray, Jain, Sawakuchi, Mahan and Tucker2019). Luminescence sensitivity, as one of the important luminescence characteristics, is thus partly a function of source rocks.
Several studies have revealed that source rocks have a significant influence on OSL sensitivity of quartz (Chithambo et al., Reference Chithambo, Preusser, Ramseyer and Ogundare2007; Preusser et al., Reference Preusser, Chithambo, Gotte, Martini, Ramseyer, Sendezera, Susino and Wintle2009; Zheng et al., Reference Zheng, Zhou and Qin2009; Lü and Sun, Reference Lü and Sun2011; Sawakuchi et al., Reference Sawakuchi, Blair, DeWitt, Faleiros, Hyppolito and Guedes2011, Reference Sawakuchi, Jain, Mineli, Nogueira, Bertassoli, Häggi, Sawakuchi, Pupim, Grohmann and Chiessi2018; Guralnik et al., Reference Guralnik, Ankjærgaard, Jain, Murray, Müller, Wälle and Lowick2015; Sharma et al., Reference Sharma, Chawla, Sastry, Gaonkar, Mane, Balaram and Singhvi2017). Increased OSL sensitivity of quartz grains has been observed in rocks formed at higher temperatures, such as rhyolite and amphibolite facies metamorphic rocks (schist and gneiss) (Sawakuchi et al., Reference Sawakuchi, Blair, DeWitt, Faleiros, Hyppolito and Guedes2011). We have also proposed that quartz in the Chinese deserts has different sensitivity related to the different rock types of adjacent mountains (Lü and Sun, Reference Lü and Sun2011). These Gobi (gravel desert) and sand deserts (including the Badain Jaran Desert, Tengger Desert, Hobq Desert, and Mu Us Desert) are thought to be dust- and silt-holding areas, providing loess-sized material for the CLP (Sun, Reference Sun2002a). Therefore, the luminescence characteristics of quartz in loess are related to source rocks.
Another possible factor is the influence of mountain geologic processes on loess-sized material production. These include glacial grinding and frost weathering (Smalley, Reference Smalley1966, Reference Smalley1995; Sun, Reference Sun2002a, Reference Sun2002b). Vast amounts of Chinese loess deposits have been derived from silt particles produced in the Gobi Altay, Hangayn, and Qilian Mountains (Sun, Reference Sun2002a, Reference Sun2002b, Reference Sun2005; Sun and Zhu, Reference Sun and Zhu2010; Sun et al., Reference Sun, Ding, Xia, Sun and Windley2018). The mountain processes responsible for loess-sized material production vary between glacial and interglacial periods. During glacial periods, frost weathering and/or glacial grinding on bedrock produce more and coarser materials, resulting in enlarged outwash fluvial fans in the piedmonts. Moreover, the enhanced cold Siberian High during the glacial period led to a stronger northwest winter monsoon. Subsequent wind sorting and entrainment on the piedmont alluvial fans bring more coarse silt materials to the CLP. During interglacial periods, weakened frost weathering and/or glacial grinding processes, together with the weaker winter monsoon, result in transport of finer and fewer loess-sized materials.
Quartz grains from the glaciogenic sediments in mountain ranges usually have low luminescence sensitivity (Rhodes and Pownall, Reference Rhodes and Pownall1994; Rhodes and Bailey, Reference Rhodes and Bailey1997; Rhodes, Reference Rhodes2000; Richards, Reference Richards2000; Spencer and Owen, Reference Spencer and Owen2004; Lukas et al., Reference Lukas, Spencer, Robinson and Benn2007; Fuchs and Owen, Reference Fuchs and Owen2008; Thrasher et al., Reference Thrasher, Mauz, Chiverrell and Lang2009; Sawakuchi et al., Reference Sawakuchi, Jain, Mineli, Nogueira, Bertassoli, Häggi, Sawakuchi, Pupim, Grohmann and Chiessi2018). Examples are the Himalayas and the Tibetan Plateau (Rhodes and Bailey, Reference Rhodes and Bailey1997; Richards, Reference Richards1999; Jaiswal et al., Reference Jaiswal, Srivastava, Tripathi and Islam2008), the Andes (Steffen et al., Reference Steffen, Preusser and Schlunegger2009), and the Scottish Highlands (Lukas et al., Reference Lukas, Spencer, Robinson and Benn2007). The Qilian Mountains, located along the northeastern margin of the Tibetan Plateau, serve as one of the important source regions for the CLP (Derbyshire et al., Reference Derbyshire, Meng and Kemp1998; Sun, Reference Sun2002a), and some quartz grains show low sensitivity (Zhang et al., Reference Zhang, Nottebaum, Tsukamoto, Lehmkuhl and Frechen2015; Zeng et al., Reference Zeng, Ou, Lai and Zhou2016). Therefore, low luminescence sensitivity of glacial loess can be, at least partially, related to dim glaciogenic quartz grains.
It is important to stress that some authors have proposed that Yellow River fluvial sediments (e.g., Stevens et al., Reference Stevens, Carter, Watson, Vermeesch, Andò, Bird, Lu, Garzanti, Cottam and Sevastjanova2013; Nie et al., Reference Nie, Stevens, Rittner, Stockli, Garzanti, Limonta and Vermeesch2015; Fenn et al., Reference Fenn, Stevens, Bird, Limonta, Rittner, Vermeesch, Andò, Garzanti, Lu and Zhang2017) as well as eolian reworking of preexisting sediments (Kapp et al., Reference Kapp, Pullen, Pelletier, Russell, Goodman and Cai2015; Wang et al., Reference Wang, Wu, Tan, Fu, Wen and Li2019) might contribute significantly to the source materials of the CLP. However, the eolian loess accumulated on the CLP can be dated back to 22 Ma (Guo et al., Reference Guo, Ruddiman, Hao, Wu, Qiao, Zhu, Peng, Wei, Yuan and Liu2002), but the Yellow River is much younger, mostly with an early Pleistocene age (Yang et al., Reference Yang, Cai, Li and Deng2001) or even the late Pleistocene (Zhang et al., Reference Zhang, Liu, Wang, Liu and Xue2018). Moreover, the elevation of the Yellow River valley is about 400 m lower than that of the Mu Us Desert (Kapp et al., Reference Kapp, Pullen, Pelletier, Russell, Goodman and Cai2015); it is difficult for wind to transport large amounts of sands to higher places.
Additionally, the CLP has an area of 640,000 km2 and loess thicknesses of up to 100–200 m; however, the Mu Us Desert has an area of only 42,000 km2 that occupies less than 7% of the CLP. Therefore, the eolian reworking of preexisting sediments of the Mu Us Desert might also contribute to the CLP (Kapp et al., Reference Kapp, Pullen, Pelletier, Russell, Goodman and Cai2015; Wang et al., Reference Wang, Wu, Tan, Fu, Wen and Li2019), but such a contribution must be very limited.
The role of desert migrations
The luminescence sensitivity of quartz has been well studied (Murray and Roberts, Reference Murray and Roberts1998; Murray and Wintle, Reference Murray and Wintle2000; Preusser et al., Reference Preusser, Ramseyer and Schluchter2006; Wintle and Murray, Reference Wintle and Murray2006). The cycles of heating, irradiation, and bleaching can increase luminescence sensitivity of quartz grains (McKeever et al., Reference McKeever, Bøtter-Jensen, Larsen, Mejdahl and Poolton1996; Li, Reference Li2002; Duller, Reference Duller2006; Moska and Murray, Reference Moska and Murray2006; Preusser et al., Reference Preusser, Ramseyer and Schluchter2006; Koul and Chougaonkar, Reference Koul and Chougaonkar2007). In sedimentary environments, a positive correlation between the OSL sensitivity of quartz and the number of natural cycles of heating, irradiation, and bleaching has been proposed for fluvial systems (Pietsch et al., Reference Pietsch, Olleya and Nanson2008; Preusser et al., Reference Preusser, Chithambo, Gotte, Martini, Ramseyer, Sendezera, Susino and Wintle2009; Fitzsimmons et al., Reference Fitzsimmons, Rhodes and Barrows2010; Poolton et al., Reference Poolton, Smith, Riedi, Bulur, Bøtter-Jensen, Murray and Adrian2000; Fitzsimmons, Reference Fitzsimmons2011; Gliganic et al., Reference Gliganic, Cohen, Meyer and Molenaar2017; Sawakuchi et al., Reference Sawakuchi, Jain, Mineli, Nogueira, Bertassoli, Häggi, Sawakuchi, Pupim, Grohmann and Chiessi2018), periglacial sediments (Fitzsimmons et al., Reference Fitzsimmons, Rhodes and Barrows2010; Fitzsimmons, Reference Fitzsimmons2011), lacustrine sediments (Fitzsimmons et al., Reference Fitzsimmons, Rhodes and Barrows2010; Fitzsimmons, Reference Fitzsimmons2011), and eolian sediments (Zheng et al., Reference Zheng, Zhou and Qin2009; Fitzsimmons et al., Reference Fitzsimmons, Rhodes and Barrows2010; Fitzsimmons, Reference Fitzsimmons2011; Lü and Sun, Reference Lü and Sun2011; Lü et al., Reference Lü, Sun, Li, Gong and Xue2014).
A conceptual model of the effect of desert migration on luminescence sensitivity has been proposed (Lü et al., Reference Lü, Sun, Li, Gong and Xue2014). The retreat–advance of deserts in the northwest of the CLP of China directly influences dust transport distance. The Shimao Section is located between the Mu Us Desert and the CLP (Fig. 1) and is sensitive to the advance–retreat cycles of desert migration. From analysis of this section, Sun et al. (Reference Sun, Ding and Liu1998a) suggest that the southeast margin of the Mu Us Desert during the last glacial maximum (MIS 2) expanded at least 400–500 km south compared with its position during the Holocene climate optimum. Yang and Ding (Reference Yang and Ding2008) have used median grain size and the percentage of >20 mm particles in both loess and paleosols to reconstruct the history of desert migrations. They propose northerly desert retreats of ~160 km, ~19 km, and ~225 km during MIS 3, 4, and 5, respectively, resulting in a longer source to sink distance during interglacial periods than during glacial periods. Longer transportation distance means more chances for the quartz grains to undergo irradiation and bleaching cycles during sediment transport (Lü et al., Reference Lü, Sun, Li, Gong and Xue2014). The quartz grains in the Shimao and Luochuan Sections have shown similar changes in luminescence sensitivity with depth. But the Luochuan Section has much brighter quartz grains than the Shimao Section for the same period. This could relate to a longer source–sink distance for the Luochuan Section compared with the Shimao Section.
The retreat–advance history of the desert reflects the strength of the East Asian monsoon (Sun et al., Reference Sun, Ding and Liu1998a; Ding et al., Reference Ding, Derbyshire, Yang, Sun and Liu2005; Yang and Ding, Reference Yang and Ding2008), and this variation influences the source–sink distances associated with climate change. The sensitivity of quartz grains reflects this change of provenance. Mountain processes, glacial history, and desert migrations are all related to cyclic climatic changes and can also explain why the change of luminescence sensitivity of sediments through time correlates with that of the magnetic susceptibility (Fig. 4), which has been demonstrated to be a climatic proxy (Liu, Reference Liu1985).
The influence of natural radioactivity
OSL and TL dating are based on the energy absorbed from radiation from potassium (40K), thorium (Th), uranium (U), rubidium (87Rb), and cosmic rays (Aitken, Reference Aitken1985b, Reference Aitken1998). Irradiation has been discussed as one of the factors influencing luminescence sensitivities of quartz grains in the laboratory (Zimmerman, Reference Zimmerman1971; Aitken, Reference Aitken1985a; Li, Reference Li1995, Reference Li2002; Wintle and Murray, Reference Wintle and Murray1999; Polymeris et al., Reference Polymeris, Kitis and Pagonis2006). Irradiation differences among samples might therefore play a potential role in the variation of the luminescence sensitivity of quartz (Pietsch et al., Reference Pietsch, Olleya and Nanson2008; Sawakuchi et al., Reference Sawakuchi, Jain, Mineli, Nogueira, Bertassoli, Häggi, Sawakuchi, Pupim, Grohmann and Chiessi2018; Gray et al., Reference Gray, Jain, Sawakuchi, Mahan and Tucker2019).
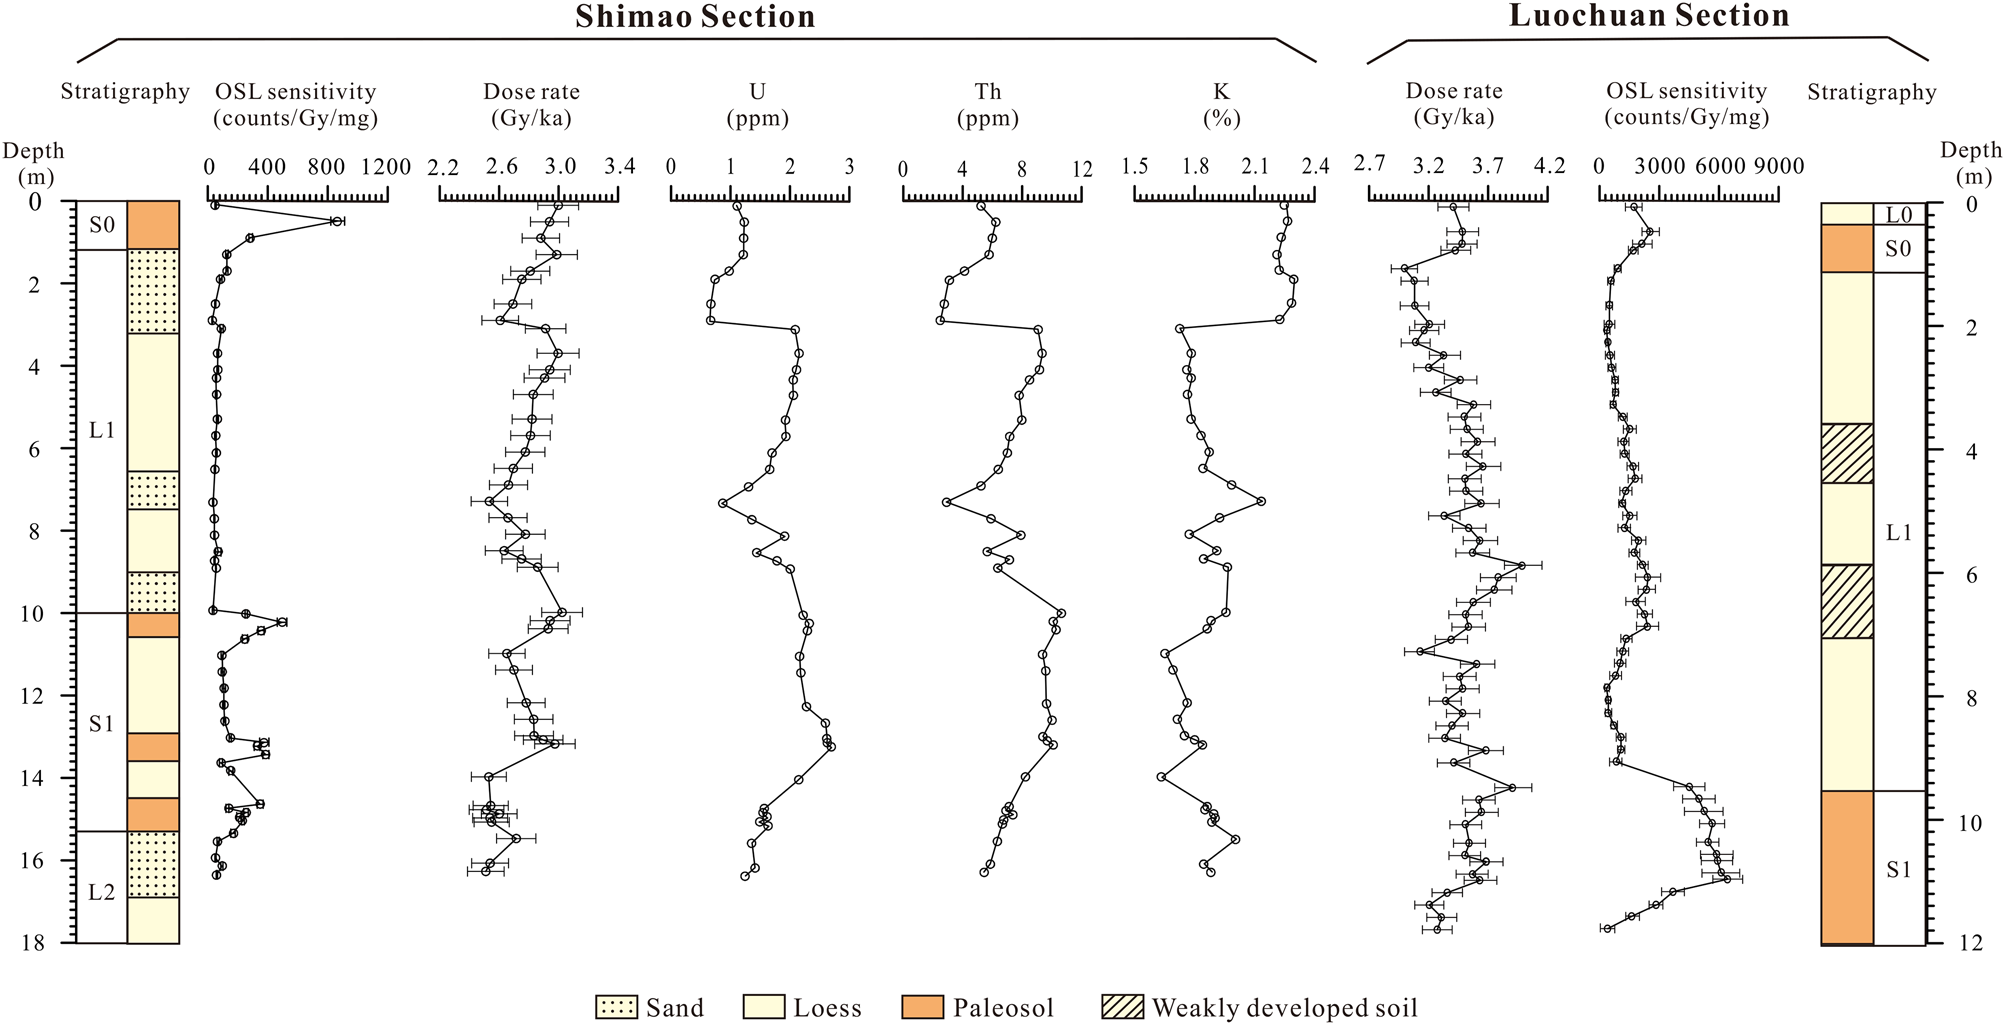
To demonstrate the relationship between the spatiotemporal variation of natural radioactive elements and luminescence sensitivity, the dose rate and the related dosimetric parameters of the Luochuan and Shimao Sections are presented in Figure 8. Although the uranium and thorium content shows a similar trend with the luminescence sensitivity of the Shimao Section, the dose rate shows irregular changes (Fig. 8). These might be related to different potassium and moisture contents. First, the variation trend of potassium content is in the opposite direction from those of the uranium and thorium contents, thus weakening the overall dose-rate trend. Second, moisture content influences the absorption rate of irradiation. The paleosol has higher uranium, thorium, and potassium content than the loess, which leads to a higher dose rate. However, higher water content in the interstices of paleosols decreases the absorption rate of irradiation. The irregular dose rates in the Luochuan and Shimao Sections indicate that irradiation plays only a minor role in affecting luminescence sensitivity.
(color online) Relationships between the single-aliquot optically stimulated luminescence (OSL) sensitivity and the dose rate of the Shimao and Luochuan Sections (a, b, f, g). Concentrations of uranium (c), thorium (d), and potassium (e) of the Shimao Section versus depth. The data for the Luochuan Section are from Lü et al. (Reference Lü, Sun, Li, Gong and Xue2014).

CONCLUSIONS
Based on single-aliquot OSL and TL sensitivity results, changes in the luminescence sensitivity with depth in the Shimao Section in the northern CLP have been reconstructed and indicate well-defined glacial–interglacial cycles, with higher sensitivity values in paleosols and lower values in loess beds.
The spatial variations of TL and OSL sensitivity of quartz grains between the Luochuan and Shimao Sections have been compared. There are similar temporal variation patterns that correlate well with glacial–interglacial cycles. However, the Luochuan Section has higher TL and OSL sensitivities than the Shimao Section for the same period.
The pseudo single-grain (~20 grains per hole) OSL sensitivity measurements provide better resolution than the single-aliquot OSL for examining the relative contributions to OSL sensitivity of quartz grains. The new results suggest that more abundant bright quartz grains are responsible for the higher OSL sensitivity in paleosol compared with loess.
The main factors governing the spatial and temporal variations of OSL and TL sensitivity include the origin of the quartz grains related to the loess-sized material production processes, the migration of desert environments, and the dose rate. We suggest that the loess-sized material production processes and desert migration, which are ultimately controlled by cyclic climatic changes, play an important role in affecting spatial and temporal luminescence sensitivity variations in Chinese loess.
ACKNOWLEDGMENTS
This study was funded by the National Science Foundation of China (grants 41877443, 41888101, and 41672168), the Strategic Priority Research Program of Chinese Academy of Sciences (grant XDA20070202), the Chinese Geological Survey Project (grant DD20190306), the Basic Science Foundation of the Chinese Academy of Geological Sciences (grant JYYWF20183201), and the Basic Science Foundation of Geomechanics (grant DZLXJK201714). TL gratefully acknowledges financial support from China Scholarship Council (201809110049). We also thank the two anonymous reviewers and associate editor Ashok Singhvi for their helpful comments.