Most of the treatments currently available to treat hypertension are based on the inhibition of the angiotensin converting enzyme (ACE). This dicarbopeptidase (EC 3.4.15.1) plays a crucial role in raising blood pressure by transforming angiotensing I into angiotensing II (potent vasoconstrictor) and degrading the vasodilator bradykinin (Riordan, Reference Riordan2003). As a consequence, a number of synthetic compounds with ACE inhibitory activity are nowadays available for the treatment of hypertension. Nevertheless, these drugs present several undesirable side-effects (FitzGerald et al. Reference FitzGerald, Murray and Walsh2004) which could be alleviated by employing ACE inhibitors from natural sources. Although, generally, these peptides present lower ACE inhibitory activity than pharmaceutical drugs, they do not possess side effects even in high doses (Ishida et al. Reference Ishida, Shibata, Fukuhara, Yano, Takehara and Kaneko2011).
Peptides with ACE inhibitory activity have been produced by enzymatic hydrolysis of several substrates from animal or vegetal origin (Ryan et al. Reference Ryan, Ross, Bolton, Fitzgerald and Stanton2011; Rui et al. Reference Rui, Boye, Simpson and Prasher2013). More specifically, the ACE inhibitory activity of several peptides derived from bovine milk has been extensively reported by both in vitro and in vivo assays (López-Fandiño et al. Reference López-Fandiño, Otte and van Camp2006). In contrast, goat milk proteins have been studied to a lesser extent, but with promising results as an ACE-inhibitory peptide source (Geerlings et al. Reference Geerlings, Villar, Hidalgo-Zarco, Sánchez, Vera, Zafra-Gómez, Boza and Duarte2006; Kumar et al. Reference Kumar, Tandon and Kapila2011). The production of ACE inhibitory hydrolysates from goat milk would suppose a new application for this kind of milk which, currently, is mostly intended to cheese making. These ACE inhibitory peptides could be incorporated as ingredients in the formulation of food products intended to prevent or help to control hypertension. Indeed, nowadays, there are a number of commercial products which contain such peptides (Aluko, Reference Aluko2007). As example, Biozate™, is a commercial whey protein hydrolysate containing 3 potent antihypertensive peptides (IIAEK, IPAVF and IPAVFK).
To this end, it would be desirable to obtain hydrolysates enriched in active peptides. Most of the literature available is focussed on isolation and identification of new inhibitory peptides. These identification studies employ filtrations through polymeric membranes as a previous step for selecting the most active fraction for further analysis (Pihlanto-Leppälä et al. Reference Pihlanto-Leppälä, Koskinen, Piilola, Tupasela and Korhonen2000; Pan et al. Reference Pan, Cao, Guo and Zhao2012). Some authors have also used polymeric membranes in order to purified bioactive peptides on a larger scale (Jiang et al. Reference Jiang, Tian, Brodcrob and Huo2010; Holder et al. Reference Holder, Weik and Hinrichs2013). However these organic membranes present numerous disadvantages when compared with inorganic membranes. Specifically, ceramic membranes present very good chemical resistance, wide pH and T limits and extended operating lifetimes (Cheryan Reference Cheryan1998). Despite of these favourable characteristics, ceramic membranes have been rarely evaluated for the purification of ACE inhibitory peptides. Lin et al. (Reference Lin, Chen, Liang, Zhang, Wang, Cai and Li2011) assayed ceramic membranes in the purification of corn protein hydrolysates. Nevertheless, the authors did not study either the filtration process or the cleaning of the membrane process. From an industrial point of view, both the study of the filtration mechanism as well as the implementation of a cleaning stage are key factors. Especially important is to choose an adequate cleaning process allowing several reutilisations of the membrane. Therefore, the study in detail of both the filtration and cleaning process is desirable.
The aim of this paper was to study a three-stage integral process to produce hydrolysates exhibiting ACE-inhibitory activity from goat milk protein. Firstly, since neither commercial goat caseins nor whey proteins are available, a membrane filtration process was proposed to isolate caseins and whey protein fractions. Subsequently, the hydrolysis of these fractions was studied employing three enzyme treatments with the objective of maximising the ACE inhibitory activity. Finally, different ultrafiltration processes with ceramic membranes were assayed for improving the ACE inhibitory activity of the hydrolysates. The fouling mechanisms of the filtration stages as well as the cleaning procedures were studied.
Materials and methods
Production of protein fractions
Commercial UHT goat milk was centrifuged at 4800 g and 4 °C for 30 min in order to remove fat. Protein fractions, caseins and whey proteins, were obtained after concentration with a 0·14 μm ultrafiltration tubular ceramic membrane (TAMI, Nyons, France), 1·20 m length, 3 channels and 0·045 m2 of filtration area.
Firstly, the membrane was hydrated with demineralised water at 50 °C for 1 h. At this point, the permeability of the unfouled membrane was determined, reported as the slope of the water flux (demineralised water at 50 °C) against transmembrane pressure. Subsequently 6 l skimmed milk were concentrated at 50 °C to a volume reduction factor (VRF) of 3, attaining 2 l retentate (enriched in caseins). The operation conditions were 1 bar of transmembrane pressure and cross-flow velocity 3·3 m/s, with recycle of the retentate stream while permeate was continuously removed from the ultrafiltration rig.
In order to model the dynamic behaviour of the permeate flux, the experimental data were fitted to a several blocking models according to the expressions for crossflow filtration proposed by Field et al. (Reference Field, Wu, Howell and Gupta1995). The better model fitting the experimental data was the complete pore blocking model (1). This model assumes that the flux decline is provoked by the deposition of particles which seal the membranes pores and decrease the effective filtration area. The flux can be expressed mathematically as follows:
 $$J = J^* + (J_0 - J^* ) \cdot \exp ( - k_1 \cdot t)$$
where J is the flux of permeate, J 0 is the initial value of flux of permeate, J* is a critical value of flux, below which there is no fouling phenomena and k 1 is a constant related to the deposition of particles onto the pores.
Finally, a cleaning procedure was conducted on the fouled membrane to restore the initial water flux. Two consecutive cleaning stages were proposed. Firstly, a mechanical cleaning consisting of an initial rinse with demineralised water at room temperature (1 bar, 3·3 m/s). Secondly, a chemical cleaning stage employing alkaline (sodium hydroxide 0·5 N plus 2 g/l SDS as surfactant agent). Sodium hydroxide is effective to hydrolyse and remove protein deposits on the membrane surface. The cleaning solution was pumped at total recycle mode for 30 min at 50 °C, 1 bar of transmembrane pressure and cross-flow velocity of 3·3 m/s. Finally, both permeate and retentate ports were rinsed with de-mineralised water until neutrality. The hydraulic resistance of the membrane was determined before and after the cleaning procedure to determine its effectiveness.
The efficiency of the cleaning protocol was assessed by evaluating the decrease of hydraulic resistance of the fouled membrane throughout the cleaning steps, until attaining its intrinsic value prior to the ultrafiltration. To this end, the total hydraulic resistances (R T) after each cleaning stage were determined as the inverse of the slope of the water flux (J w) against the transmembrane pressure (TMP):
 $$R_{\rm T} = J_{\rm W} /{\rm TMP}$$
Assuming that the total resistance provided by the membrane is the contribution of that of the membrane material (i.e. membrane intrinsic resistance R M) and that provided by the fouling deposits (R F), the latter could be calculated by:
 $$R_{\rm F} = R_{\rm T} - R_{\rm M} $$
Finally, a cleaning efficiency index was defined for the cleaning treatment, which was calculated by means of the Eq. (4):
 $$E = (R_0 -R_{{\rm Clean}} )/(R_0 - R_{\rm M} )\cdot100$$
where R M is the intrinsic membrane resistance (i.e. that provided by the unfouled membrane), R 0 is the hydraulic resistance after the concentration and R Clean is that determined after performing the cleaning procedure. The cleaning efficiency index represents the percentage removal of the fouling resistance after the cleaning procedure. The closer R Clean is to the intrinsic resistance of the membrane material, the larger the efficiency index is, approaching to 100%.
SDS-Electrophoresis
After filtration, the proteins fractions obtained were analysed by SDS-Page in order to certify the separation between caseins and whey proteins. SDS-polyacrylamide gel electrophoresis (SDS-PAGE) was performed using the method described by Laemmli (Reference Laemmli1970). The protein concentration of each sample was diluted with cracking buffer 4× (0·0625 m Tris HCl pH 6·8, 2% SDS, 0·71 m b-mercaptoetanol, 0·025% bromophenol blue, 10% glycerol) until a 1× concentration cracking buffer was obtained. The mixed samples were heated in a water bath at 95 °C for 5 min. The protein sample (∼20 μl) was applied to the gel and run at a constant current of 200 V per gel. Upon the completion of electrophoresis, the gel was stained in a staining solution which consisted of 2·5 g Coomassie Brilliant Blue R-250/l in 50% methanol and 9% acetic acid on an orbital shaker. After 2 h staining, the gel was destained in a quick destaining solution, which consisted of 40% methanol and 10% acetic acid, for 3–4 h to remove background stain. A broad range of molecular mass standard proteins of 116·0, 66·2, 45·0, 35·0, 25·0, 18·4 and 14·4 kDa (Thermo Scientific) were used to calculate molecular weight. Milk and retentate samples were previously diluted to 1 : 10 and 1 : 50 respectively, due to their high protein concentration.
Enzymatic hydrolysis
The proteins fractions, caseins and whey proteins, obtained in the ultrafiltration stage through 0·14 μm were employed as substrates in the hydrolysis processes. The enzymes assayed were subtilisin (EC 3.4.21.62) and trypsin (EC 3.4.21.4). Both are serine endoproteases purchased from Novozymes (Denmark). Subtilisin is an endoprotease of broad specifity, while trypsin only cleaves peptide bonds involving Arg or Lys residues (Adler-Nissen, Reference Adler-Nissen1986). Both subtilisin (Geerlings et al. Reference Geerlings, Villar, Hidalgo-Zarco, Sánchez, Vera, Zafra-Gómez, Boza and Duarte2006; Jiang et al. Reference Jiang, Chen, Ren, Luo and Zeng2007) and trypsin (Pintado & Malcata, Reference Pintado and Malcata2000; Pan et al. Reference Pan, Cao, Guo and Zhao2012) have been reported to release ACE inhibitory peptides.
Both protein fractions were subjected to three different treatments: using subtilisin (S), trypsin (T) and the mixture (1 : 1) of both enzymes (ST). These experiments were carried out in a stirred tank reactor of 0·2 L at 50 °C and pH 8, since these operational conditions are adequate for both enzymes (Adler Nissen, Reference Adler-Nissen1986; Mota et al. Reference Mota, Ferreira, Oliveira, Rocha, Teixeira, Torres and Gonçalves2006). The enzyme concentration in the reaction was adjusted to 5 and 0·5 g/l for retentate and permeate, respectively. The degree of hydrolysis (DH), defined as the fraction of peptide bonds cleaved, was followed by the pH-stat method (Adler-Nissen, Reference Adler-Nissen1986) throughout the reaction time (3 h). The evolution of ACE inhibitory activity was determined by taking 100 μl samples at 0, 5, 10, 20, 30, 40, 50, 60, 75, 90, 105, 120, 150 and 180 min. The samples were deactivated by heating at 100 °C for 15 min and subsequently frozen it at −20 °C until analysis.
The hydrolysate selected for the filtration studies was obtained as explained above. In this case, a 2 L stirrer reactor was employed, in order to produce enough volume for each filtration. After 3 h, the reaction was stopped by thermal deactivation.
Concentration of active peptides
The hydrolysate displaying the highest ACE inhibitory activity was then subjected to a two-step ultrafiltration, with the aim to produce a concentrate in active peptides. According to the molecular weight cut-offs commercially available, ceramic membranes of 50, 15, 3 and 1 kDa from Tami (Nyons, France) were assayed, all with a length of 0·25 m. The filtration area was 0·0094 m2 and the hydraulic diameter was 3·6 mm for the highest cut-off membranes (50 and 15 kDa). In the case of the smaller ones (3 and 1 kDa) the filtration area was 0·0042 m2 and the hydraulic diameter was 6 mm.
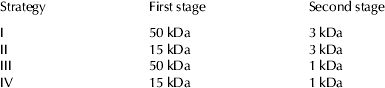
A total of four strategies (Table 1) consisting in two consecutive filtrations were studied. Each strategy comprised a first step, where the membranes with higher MWCO (50 or 15 kDa) were employed to remove the larger peptides from the hydrolysate. The permeate obtained from the first stage was further treated by a second filtration process through 3 or 1 kDa membrane in order to concentrate the active peptides in the retentate.
Strategies proposed for studying the concentration process

The filtrations experiments were carried out following the same procedure employed in the production of protein fraction. Firstly the membrane was hydrated and its permeability was determined with ultrapure water. Then, the selected hydrolysate was ultrafiltrated in batch concentration mode. The operation conditions were 50 °C, 1 bar and a cross-flow velocity of 3·3 m/s. Afterward, the membrane was subjected to the cleaning procedure described above.
ACE inhibitory activity analysis
Raw hydrolysates, retentate and permeate streams were tested for their ACE inhibitory activity. To this end, the spectrophotometric method proposed by Shalaby et al. (Reference Shalaby, Zakora and Otte2006) was employed. For determining the percentage inhibition, the samples of retentate hydrolysates were diluted 50 times with ultrapure water in order to reduce their absorbance and avoid values high values of absorbance which would generate nonlinear measures. While samples of permeate hydrolysates were used directly in the assay. Each sample was analysed in triplicate.
Results and discussion
Production of protein fractions
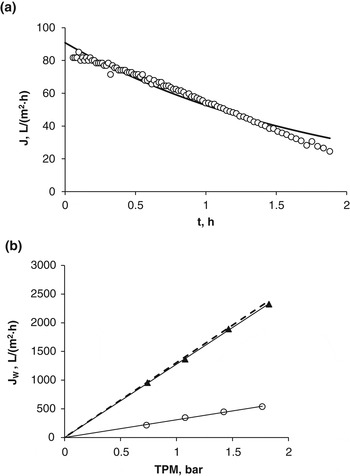
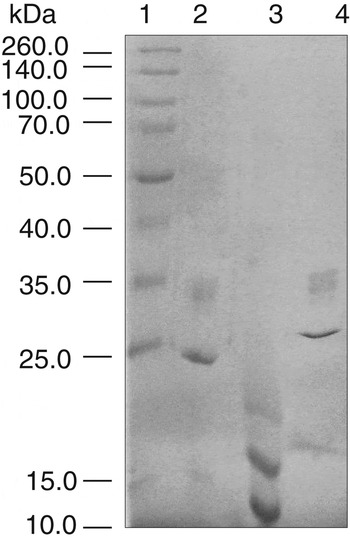
Figure 1a plots the flux of permeate against time for the 0·14 μm membrane. The concentration mode was conducted during 113 min, where the feed solution (skimmed goat milk) was concentrated 3-fold under the operation parameters described above (50 °C, 1 bar, 3·3 m/s). During the filtration, the flux of permeate decreased linearly with time, dropping from 81·6 l/(m2·h) to 24·5 l/(m2·h), which represents a relative flux decline of 70%. As can be observed in Fig. 2, caseins (with molecular weight higher than 20 kDa) were concentrated in the retentate while permeate containted only whey proteins. The protein content of the fractions were 63·50 and 3·15 g/l for the retentate and the permeate respectively.
Production of protein fractions through the 0·14 μm membrane: (a) Observed flux of permeate (○) and predicted flux with the proposed model (line). (b) Water flux against transmembrane pressure for the fouled membrane (○), alkali cleaning stage (▲) and unfouled membrane (dotted line).

SDS-Page analysis of filtration streams. Lane 1: Standards; Lane 2: initial milk (diluted 1 : 10); Lane 3: permeate; Lane 4: retentate (diluted 1 : 50).

The experimental data were fitted by non-linear regression to the complete pore blocking model (1). The estimated parameters obtained were 90·83 l/m2h, 0 l/m2h, 15·2·10−5 h−1, for J 0, J*, k 1, respectively. According to Fig. 1a, this model adequately fits experimental data within the first hour, and deviates progressively. This could be attributed to the changes undergone by the feed solution (e.g. viscosity, protein content) during the concentration, as well as the appearance of new fouling phenomena such as cake formation.
After completing the filtration, the water flux of the fouled membrane was restored according to the cleaning procedure described previously. Figure 1b plots the observed values of water flux against the transmembrane pressure for the fouled membrane and for the membrane cleaned with the alkali solution. These data were fitted to a regression line, whose slope represents the permeability of the membrane at each stage. It can be observed that the slope of the regression line increases after the alkali cleaning until attaining the initial value of the unfouled membrane . Indeed, the efficiency of alkali cleaning (Table 2) was 99%. Therefore, the membrane fouling was removed almost totally and further cleaning with acid agents was unnecessary.
Resistances and cleaning efficiency parameters

Enzymatic hydrolysis
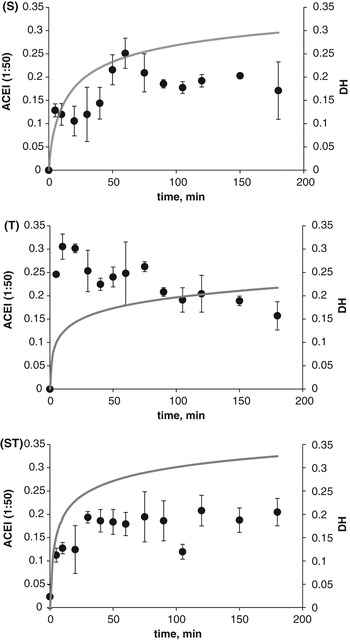
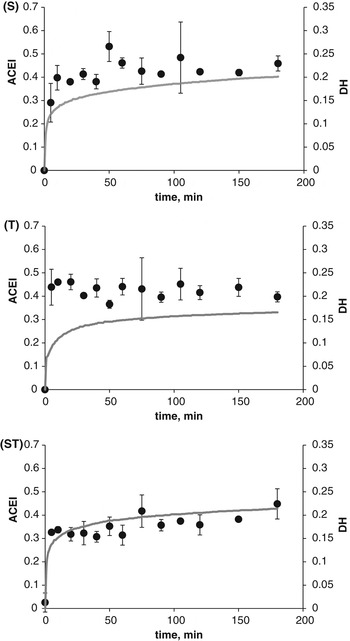
In Figs. 3 & 4 are presented the hydrolysis curves for each protein fraction and treatment assayed. All of them showed the typical pattern of an enzymatic reaction. At the beginning of the hydrolysis reaction, DH increased rapidly at constant rate. As the reaction progressed, the number of susceptible-cleaving bond were reduced, consequently the number of bonds cleaved per unit of time decreased. This period of decreasing rate corresponds to the asymptotic zone of the hydrolysis curves. For both protein fractions, the treatment with the mixture of both enzymes (Fig. 3-ST) had the higher initial reaction rate and the proteolitic action of this treatment continued throughout the time of reaction giving the highest DH values. On the contrary, the hydrolysis with trypsin (Fig. 3-T) generated the lowest DH. This result could be explained by the higher specificity of trypsin, which limits the number of peptide bonds that could be cleaved by the enzyme. Similar results were reported in previous works dealing with goat milk (Espejo-Carpio et al. Reference Espejo-Carpio, Pérez-Gálvez, Guadix and Guadix2013b) but also with other protein sources (García-Moreno et al. Reference García-Moreno, Pérez-Gálvez, Espejo-Carpio, Muñío, Guadix and Guadix2013).
Evolution of degree of hydrolysis (line) and ACE inhibitory activity (●) for the hydrolysis of retentate with subtilisin (S), trypsin (T) and the mixture of both (ST). ACE inhibitory activity was determined by triplicate.

Evolution of degree of hydrolysis (line) and ACE inhibitory activity (●) for the hydrolysis of permeate with subtilisin (S), trypsin (T) and the mixture of both (ST). ACE inhibitory activity was determined by triplicate.

As can be observed in Fig. 3, the final DH values were 0·29, 0·22 and 0·32 for the hydrolysis of retentate fraction with S, T and ST treatment respectively. While, the final DH obtained in the permeate hydrolysates (Fig. 4) were 0·20, 0·16, and 0·214 for S, T and ST treatment respectively. These high DH values, especially in retentate hydrolysates, would result in hydrolysates abundant in low molecular weight peptides.
The ACE inhibitory activity of the hydrolysates varied according to the total reaction time as is shown in Figs. 3 & 4. It was observed that the intact protein (reaction time=0) did not present ACE inhibitory activity, whereas short reactions times increased the ACE inhibitory activity considerably. This rise was usually produced within the first 5–10 min of reaction, when the reaction rate was constant and a large number of new peptides were released, improving the ACE inhibitory activity of hydrolysates. The evolution of ACE hydrolysates varied according to the treatment employed. When subtilisin was employed (Figs. 3-S & 4-S), after an initial increment, the inhibitory activity remained constant or slightly decreased for some minutes. Around 30–40 min of reaction time, the inhibitory activity started rising again until a maximum was reached. This rising could be explained by the opening of the protein structure which would allow the releasing of peptides from the inner zone of the protein. Generally, the inner part of the protein structure has higher number of non-polar residues which are known to favour the ACE inhibitory activity of peptides (Li et al. Reference Li, Le, Shi and Shresthaa2004; López-Fandiño et al. Reference López-Fandiño, Otte and van Camp2006). After reaching the maximum, the percentage of inhibition of subtilisin hydrolysates decreased slightly and then remained constant. During this final period some active peptides would be hydrolysed losing their inhibition power, but the expected decrease in ACE inhibitory activity would be compensated by the simultaneous generation of new active peptides. Similar results were obtained by Jiang et al. (Reference Jiang, Chen, Ren, Luo and Zeng2007) in the hydrolysis of yak milk caseins with alcalase (subtilisin). In contrast, the ACE inhibitory activity of trypsin hydrolysates of retentate (Fig. 3-T) decreased with the hydrolysis time. This behaviour was already observed in our previous work (Espejo-Carpio et al. Reference Espejo-Carpio, Pérez-Gálvez, Guadix and Guadix2013b). Moreover, it was in line with the result obtained by Jiang et al. (Reference Jiang, Chen, Ren, Luo and Zeng2007) which found that, after reaching a maximum ACE inhibitory activity, trypsin hydrolysates reduced their inhibitory activity with the degree of hydrolysis. In the case of the trypsin hydrolysate of permeate (Fig. 4-T), the inhibitory activity remains almost constant within the reaction time studied. The same behaviour was described by Wang et al. (Reference Wang, Mao, Cheng, Xiong and Ren2010) for a trypsin hydrolysate of whey protein isolate. When both enzymes were employed together (Figs. 3-ST & 4-ST) the behaviour appears as a combination of the hydrolysis observed for the individual enzymes. In general, after the initial increase in ACE inhibition, the values remained almost constant.
Since extensive hydrolysis leads to a final hydrolysate rich in short chain peptides, long reaction times would be desirable from the point of view of ACE inhibition of the hydrolysates. In this sense, larger peptide chains have been related with lower ACE inhibitory activity (Roberts et al. Reference Roberts, Burney, Black and Zaloga1999). Indeed, most of the antihypertensive sequences reported in literature present a length ranged between 2–12 residues (Li et al. Reference Li, Le, Shi and Shresthaa2004). Furthermore, some studies have proved that di- and tripeptides can be transported through the intestine wall without any modification (Foltz et al. Reference Foltz, Cerstiaens, van Meensel, Mols, van der Pijl, Duchateau and Augustijns2008). This implies that active sequences may enter the blood stream intact and produce a systemic effect. Therefore, the final hydrolysates (3 h of reaction time) were preferred more than hydrolysates presenting lower DH.
With respect to ACE inhibitory activity, it was observed that the combination subtilisin plus trypsin led to the final hydrolysates displaying the highest inhibition in both retentate and permeate fractions. Likewise, retentate fraction always gave better ACE inhibitory activity than permeate. For these reasons retentate hydrolysate produced with subtilisin and trypsin simultaneously for 3 h was selected as the best option for producing ACE inhibitory peptides.
The selected hydrolysate presented an IC50 of 218·50 μg/ml and an average peptide length chain (PLC) of 3 amino acids approximately, determined as the inverse of the degree of hydrolysis (Adler-Nissen, Reference Adler-Nissen1986). Worse IC50 values (847 and 1143 μg/ml) were obtained for the yak caseins hydrolysates (Jiang et al. Reference Jiang, Chen, Ren, Luo and Zeng2007) employing similar operational conditions (3 h with trypsin and subtilisin). Others authors (Otte et al. Reference Otte, Shalaby, Zakora, Pripp and El-Shabrawy2007) determined inhibitory values similar to those obtained in this work in bovine caseins hydrolysates using thermolysin. The hydrolysate of retentate produced with the mixture of enzymes was further characterised in a previous work (Espejo-Carpio et al. Reference Espejo-Carpio, De Gobba, Guadix, Guadix and Otte2013a) obtaining fractions with low IC50 values (e.g. 9·3 μg/ml). These values represent an increment of inhibitory activity of more than 90% with respect to the original hydrolysate without fractionation. This result highlights the importance of concentrating the fractions, in order to obtain a final product with higher content of active peptides.
Concentration of active peptides
Hydrolysate (2 l) was produced using the conditions selected for ACE inhibitory peptides production. The curve of the hydrolysis was practically the same as that obtained in the hydrolysis carried out in the smaller reactor (Fig. 3-ST), indeed, DH and IC50 values of the final hydrolysates varied just 3 and 5% respectively. It can be concluded that escalating the reactor from 0·2 to 2 l had no significant effect on either DH or IC50 values of the hydrolysate.
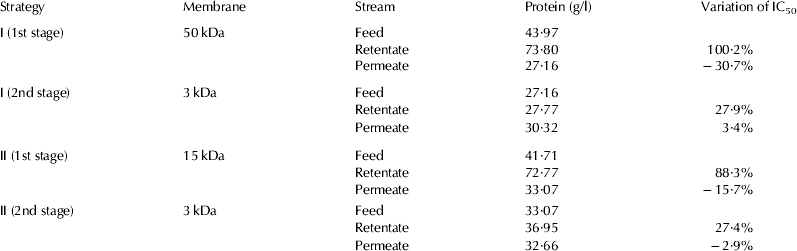
With the objective of comparing the effect of the different filtration strategies over ACE inhibitory activity, the variation percentage of IC50 between feed and fractions were determined. In Table 3 is shown the protein content together with the variation of the IC50 values of the fractions produced in strategies I and II. Unfortunately, strategies III and IV were rejected because, independently of the previous filtration step employed, the secondary filtrations carried out with 1 kDa membrane produced a rapid clogging of the membrane which made it impossible to continue with the operation.
Protein concentration and variation of IC50 for each filtration stage

As can be observed in Table 3, the protein content of retentate increased considerably in the first stages of both strategies. However, this increase in protein concentration provoked a remarkable decrease in ACE inhibitory activity of the retentate fractions. Indeed, the IC50 value of retentate fractions increased more than 80% with respect to the initial hydrolysates. In contrast, permeate fraction presented a reduction in the protein content but showed a decrease in the IC50 values which involve an improvement in the ACE inhibitory activity. Therefore, both the 50 and 15 kDa membranes were able to remove the biggest and non-active peptides from the hydrolysates. However, the improvement in ACE inhibitory activity obtained with the filtration through 50 kDa was slightly better. Regarding the second stages (3 kDa), the sharp decline in the permeate flux avoided reaching VRF higher than 1·2. Moreover, as can be checked in Table 3, the filtrations through 3 kDa did not improve the ACE inhibitory activity.
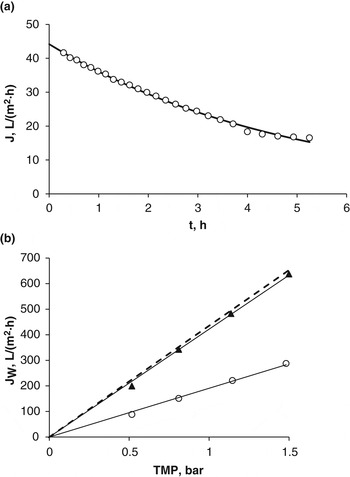
Based on the previous results, a single filtration stage through 50 kDa was selected for the concentration of active peptides. Figure 5a shows the time evolution of observed flux of permeate for the membrane of 50 kDa. During 5·3 h of filtration the flux of permeate dropped from 41·6 to 16·5 l/(m2·h) which represents a relative flux decline of 60·3% and a VRF of 4 was reached. As in the case of the 0·14 μm membrane, the observed data of flux was adequately fitted to the fouling model of complete pore blocking , as reflected by the coefficient of determination r 2 (0·9966). The initial flux J 0 estimated with the model (44·15 l/(m2·h)) is in accordance with the observed value, while the critical flux J* presented a value near to zero (0·097 l/(m2·h)). Finally, the parameter k 1, was 5·6×10−5/h.
Concentration of hydrolysate through the 50 kDa membrane: (a) Observed flux of permeate (○) and predicted flux with the proposed model (line). (b) Water flux against transmembrane pressure for the fouled membrane (○), alkali cleaning stage (▲) and unfouled membrane (dotted line).

Restoration of the membrane permeability after the cleaning treatment was followed by the calibration lines shown in Fig. 5b, where the flux of water permeating the membrane was plotted against the transmembrane pressure. The slope of the calibration line (i.e. the permeability) for the fouled membrane increases after the alkaline cleaning stage until attaining the permeability of the unfouled membrane (dotted line), which was 435 l/(bar · m2 · h) for the membrane of 50 kDa. According to the efficiency indices listed in Table 2, the cleaning procedure assayed was efficient to restore the permeability of the 50 kDa, recovering 97% of the initial water flux. These results are in agreement with those of Barlett et al. (Reference Barlett, Bird and Howell1995), who reported that a NaOH treatment was effective to clean a ceramic membrane after ultrafiltration of milk. This was attributed to the hydrolysis and solubilisation of the protein deposits by the alkali solution.
Therefore, the filtration process proposed is an adequate stage which increased by 30% ACE inhibitory activity of the goat milk casein hydrolysate. The permeate obtained could be included directly in food formulas, but also could be stabilised by spray drying before its use. According to previous studies (Espejo-Carpio et al. unpublished), the conditions which maximise the yield of spray dried product would be an inlet air temperature of 170 °C and a feed flow of 4·35 ml/min.
Conclusions
The three stage process proposed in this work is appropriate to produce hydrolysates from goat caseins with high ACE inhibitory activity. Initially the goat milk caseins were satisfactorily separated by ultrafiltration through 0·14 μm membrane. Afterward, the hydrolysis of the casein fraction with the mixture of subtilisin and trypsin generated a high ACE inhibitory hydrolysate (IC50 of 218·50 μg/ml). As a final stage, an ultrafiltration process through a 50 kDa ceramic membrane allowed an improvement of 30% in the ACE inhibitory activity.
This work was funded by the project P07-TEP-02579 from the Consejería de Economía, Innovación, Ciencia y Empleo of Junta de Andalucía, Spain. F.Javier Espejo-Carpio also acknowledges the postdoctoral fellowship support from the Consejería de Economía, Innovación, Ciencia y Empleo of Junta de Andalucía.