Introduction
Breeding programmes have made a critical contribution to improve poultry productivity through the development of new strains. Testing traits of economic interest (performance and carcass) is part of this process, because it provides information on the performance of lines that will originate broiler chicken strains, thus indicating their productive and economic potentials. Evaluating the genetic material and commercial end-products periodically is extremely important to maintain records on the progress of the breeding programmes, as well as to establish and improve the selection criteria, ensuring the renovation of breeding stock with animals of higher genetic and productive potentials, generation after generation (Le Bihan-Duval, Reference Le Bihan-Duval2004; Hoffmann, Reference Hoffmann2005; Yang and Jiang, Reference Yang and Jiang2005).
The mechanisms involved in the control of growth in chickens are too complex to be explained only under univariate analysis because all related traits are biologically correlated due to pleiotropy or linkage. Therefore, the univariate analysis does not account for all the (co)variation that exists between traits. Although the genotypic and phenotypic correlations have been estimated in poultry breeding programmes since 1950s and 1960s, they have not yet been actually used, probably because performance experiments of broiler chicken have been analysed using univariate analysis.
Consequently, multivariate analysis might be a suitable approach of analysing performance data of broiler chickens. Several multivariate analysis methods are available, depending on the aim of the study: principal components, factor analysis, cluster analysis, canonical correlation, correspondence analysis, multidimensional scaling analysis, redundancy analysis and canonical discriminant analysis (Johnson and Wichern, Reference Johnson and Wichern1992).
Some interesting results have already been obtained on performance and genetic breeding of broiler chickens, demonstrating that is viable to use multivariate approaches, such as principal components analysis (Liu et al., Reference Liu, Lyon, Windham, Lyon and Savage2004; Pinto et al., Reference Pinto, Packer, Melo, Ledur and Coutinho2006) and cluster analysis using canonical variables (Viana et al., Reference Viana, Almeida e Silva, Pires, Lopes and Piassi2000; Carneiro et al., Reference Carneiro, Fonseca, Pires, Torres Filho, Torres, Peixoto, Lopes and Euclydes2002; Pires et al., Reference Pires, Carneiro, Torres Filho, Fonseca, Torres, Euclydes, Lopes and Barbosa2002).
Other interesting results have been obtained by employing multi-trait techniques to evaluate selection strategies in poultry breeding, for example, mixed inheritance model via Gibbs sampling (Dobek et al., Reference Dobek, Moliński, Szydłowski and Szwaczkowski2000; Szwaczkowski et al., Reference Szwaczkowski, Szydłlowski, Moliński and Dobek2001), segregation analysis of production traits using Bayesian inference (Szydłowski and Szwaczkowski, Reference Szydłowski and Szwaczkowski2001) and marker-assisted selection based on a multi-trait economic index (Lahav et al., Reference Lahav, Atzmon, Blum, Ben-Ari, Weigend, Cahaner, Lavi and Hillel2006).
However, there is no published manuscript where the canonical discriminant analysis was applied to performance data of chickens. This approach aims at reducing the dimension of variables related to principal components analysis and to canonical correlations. The methodology is based on the derivation of canonical coefficients, concurrently with a multivariate analysis of variance (MANOVA). In canonical discriminant analysis, linear combinations are defined as the quantitative variables that provide the maximum discrimination between treatments by the F-test, called canonical variables. MANOVA, on the other hand, provides results for the joint analysis of all variables used and also has the objective of testing the equality of the multivariate vector of means across treatment levels (Johnson and Wichern, Reference Johnson and Wichern1992; Statistical Analysis Systems Institute (SAS), 2006).
The variable defined by the first linear combination is the first canonical variable or canonical component or yet, Fisher linear discriminant function, whose effectiveness increases in proportion to the percentage of the total variance attributed to it (Harris, Reference Harris1975). The second canonical variable is obtained by defining the linear combination of the original variables, not correlated with the first canonical variable, which has the highest possible multiple correlation. The canonical variable extraction process can be repeated until the number of canonical variables becomes equal to the number of original variables or to the number of treatments minus one, which is lower (SAS, 2006).
The correlation between the first canonical variable and the original variables is at least as high as any simple or multiple correlation between the original variables. If the original variables show high correlations within treatments, the first canonical variable may be high even when all multiple correlations are low. Therefore, the first canonical variable may present substantial differences between treatments, even if none of the original variables show them (Johnson and Wichern, Reference Johnson and Wichern1992; SAS, 2006).
In the present study, we investigated broiler chicken performance under multivariate analysis using canonical discriminant analysis in order to reduce the number of original traits and allow the discrimination and classification of treatments (i.e. of the genetic groups).
Material and methods
Animals and traits
In the experiment, 1920 chicks, equal number of males and females, from three commercial broiler chicken strains (Arbor Acres, AgRoss 308 and Cobb 500) and an experimental strain (RX), were used. The RX strain was selected for high breast and leg weights.
The care of the chicks met the guidelines of the Canadian Council on Animal Care (1993). Chicks were housed in 48 pens (2.2 × 1.8 m), 40 animals per pen, distributed in two blocks with three replicates per block. During the experimental period (1 to 42 days) four types of feed were available, whose metabolisable energy (MJ/kg) and the crude protein (g/kg) levels were, respectively: 0 to 7 days: 12.34 and 225; 8 to 14 days: 12.76 and 215; 15 to 35 days: 13.18 and 192; 36 to 42 days: 13.18 and 190. Feed and water were available ad libitum during the entire experimental period. Means (minimum to maximum) of the environmental conditions from 21 to 42 days were: ambient temperature, in °C, 25.2 (22.5 to 27.7) and relative humidity, in %, 89.4 (83.0 to 100.0). During the same period, the constant lighting programme was: 18L : 06D using both natural and artificial sources.
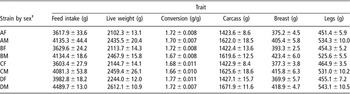
Average feed intake, average live weight, both expressed in grams and feed conversion, considering the pen as the experimental unit for all traits, were obtained for days 1 to 42. A random sample of seven birds per pen was also drawn at the same age in order to obtain carcass, breast and leg weight traits, all expressed in grams. Means for each trait in each pen were calculated in order to consider the pen as the experimental unit for carcass traits as well. Table 1 summarises univariate performance for each treatment.
Means ± s.e. of traits for each treatment for days 1 to 42

†A = Arbor Acres; B = AgRoss 308; C = Cobb 500; D = RX; F = female; M = male.
Statistical analyses
The experimental treatments consisted of combinations of four strains (Arbor Acres, AgRoss 308, Cobb 500 and RX) and two sexes (male and female), in a total of eight treatments.
The null hypothesis for the equality of the mean vectors for the six traits in the eight tested treatments is presented below:

or, T1 = T2 = T3 = T4 = T5 = T6 = T7 = T8v. the alternative hypothesis Ha that at least one of these mean vectors is different from the others.
The multivariate statistical model employed in the analyses was

where t = 1, 2, …, 6; i = 1, 2, …, 8; k = 1, 2; r = 1, 2, 3; y iktr is the multivariate vector of observations on trait t for treatment i, in replicate r, of block k; μt is the general means multivariate vector on trait t; Bkt is the multivariate vector of effects in block k on trait t; Tit is the multivariate vector of effects in treatment i on trait t; eiktr is the multivariate vector for random errors associated with the observations vector yiktr.
It was assumed that the errors vector had multinormal distribution, verified by Mardia’s test (Mardia, Reference Mardia1974) using the SAS® MULTNORM macro (http://support.sas.com/ctx/samples/index.jsp?sid=480&tab=output), with a null means vector and a variance and covariance matrix ∑ common to all treatments. The errors vector corresponding to different experimental units was independently distributed.
Canonical discriminant analysis was implemented through SAS® CANDISC procedure, where differences between treatments were obtained by the F-test (P < 0.05) over the squared Mahalanobis’ distances  , in which
 and
 are the mean vectors for treatments i and l, and S−1 is the inverse matrix of sample variances and sample covariances common to all treatments. This same procedure was used to obtain total-sample standardised canonical coefficients and total variation explained by each canonical variable.
A graph was built for the first two canonical variables (Can 1 and Can 2), showing the 95% confidence ellipses of the mean vectors for each treatment, using a modification of the SAS® CONELIP macro (http://support.sas.com/ctx/samples/index.jsp?sid=497) in order to visualise the multivariate trends of all treatments jointly.
Results and discussion
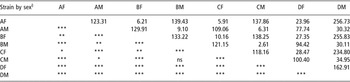
The pairwise squared Mahalanobis’ distances and the probability of a significant effect of contrasts, by the F-test (P < 0.05), between treatments are presented in Table 2.
Pairwise squared Mahalanobis’ distancesFootnote † and probability values for the contrastsFootnote ‡ between treatments

† The squared Mahalanobis’ distances are above the diagonal line.
‡ The probability values for the contrasts by the F-test (*P < 0.05; **P < 0.01; ***P < 0.001 and ns = non significant) are below the diagonal line.
§ A = Arbor Acres; B = AgRoss 308; C = Cobb 500; D = RX; F = female; M = male.
The smallest and largest distances were observed between Cobb 500 and AgRoss 308, within males, and between Arbor Acres females and RX males, respectively (Table 2). This demonstrates that Cobb 500 and AgRoss 308 males presented similar results when the six traits were analysed jointly, as confirmed by the F-test, with a non-significant probability (P = 0.3587); in contrast, Arbor Acres females and RX males presented the largest dissimilarity as evidenced by their multivariate means. Other treatments were significantly dissimilar, according to the squared Mahalanobis’ distances (Table 2).
Large distances between strains, within sex, were found among the commercial strains (Arbor Acres, AgRoss 308 and Cobb 500) and the experimental strain (RX). This difference is supported by the work of Berri et al. (Reference Berri, Wacrenier, Millet and Le Bihan-Duval2001), who studied the effect of selection for improved body composition on muscle and meat characteristics and of Fonseca et al. (Reference Fonseca, Torres Filho, Torres, Peixoto, Pires, Carneiro, Souza, Bueno, Lopes and Euclydes2002), who used the Fisher linear discriminant function associated with a Roy’s test to compare the multivariate means for carcass traits. Our results showed that the experimental strain (RX) showed lower multivariate performance than the commercial strains. The strategy used to select RX has been based on the univariate analysis for high breast and leg weights, which might partially explain the worst multivariate performance of RX.
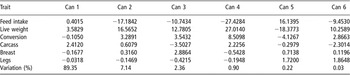
Table 3 presents the total-sample standardised canonical coefficients and total variation explained by each canonical variable. The first canonical variable (Can 1), or Fisher linear discriminant function, explained 89.35% of total variation, which can be considered reasonable and Can 2 explained 7.14% of total variation. From the six original traits, only two canonical variables were necessary to explain 96.49% of total variation. Indeed, reduction of the number of traits facilitated the evaluation of the broiler chicken performance because it is very difficult to weigh adequately each original trait in a general index. In our study, canonical discriminant analysis showed this suitable feature, weighing each original trait according to its contribution on each canonical variable.
Total-sample standardised canonical coefficients and total variation explained by each canonical variable (Can)

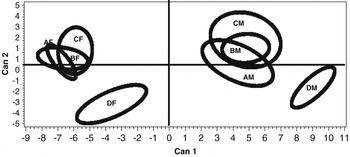
Higher weighing of the average live weight and carcass weight was observed in the process of extracting Can 1, as well as a contrast between average feed intake and average live weight, in addition to a smaller, but relevant weighing of feed conversion in the process of extracting Can 2 (Table 3). The two first canonical variables presented high weighing for average live weight, demonstrating that this trait is very important both to discriminate and to classify treatments. Average live weight is also an important trait when the univariate analysis is used to evaluate broiler chicken performance. Based on the mean classes of Can 1 and Can 2 (not shown), we obtained Figure 1, which explains 96.49% of total variation and presents the 95% confidence ellipses of the multivariate mean vectors for each treatment. The confidence ellipses allowed a clear discrimination of four treatment groups: Arbor Acres, AgRoss 308 and Cobb 500, within females; females RX; Arbor Acres, AgRoss 308 and Cobb 500, within males; males RX. Sexes were also clearly separated. Can 1 had higher discriminant power than Can 2, because Can 1 axis showed higher distinction and dispersion of values between treatments than Can 2 axis. Consequently, if Can 1 mainly weighs the average live weight and carcass weight (Table 2), then we were able to infer that these traits allowed for a clear distinction between treatments. In turn, the classification of treatments was possible through Can 2, which weighed the contrast between average live weight and average feed intake plus feed conversion (Table 2). The latter has high economical importance for the classification of broiler chicken performance because feed comprises 65% to 75% of poultry production costs (Food and Agriculture Organization of the United Nations, 2006).
The 95% confidence ellipses of the mean vectors of each treatment according to the first and second canonical variables (Can 1 and Can 2). Commercial strains: A = Arbor Acres; B = AgRoss 308; C = Cobb 500; Experimental strain: D = RX; F = female; M = male.

Arbor Acres, AgRoss 308 and Cobb 500 males presented higher average live weight, lower feed intake and better feed conversion than RX males, which presented the smallest average live weight, the highest average feed intake and the poorest feed conversion (Figure 1). This classification of strains also held true for females, in agreement with reports by Rosário et al. (Reference Rosário, Silva, Savino, Coelho and Moraes2005), who evaluated the same strains under the univariate repeated-measures approach across a 6-week period, using only feed conversion to classify them.
The best multivariate performance mean was found for Cobb 500 and AgRoss 308 males (Table 2 and Figure 1). These treatments, in addition to Arbor Acres, presented better multivariate performance than RX males, because these are commercial strains whose their dam and sire lines were selected for traits of economic interest for a longer time, as compared with RX, which is still an experimental, developing strain.
Canonical discriminant analysis allowed an understanding of broiler chicken performance taking into account the total (co)variation between traits jointly, which is biological and physiologically accepted, because performance traits are naturally correlated. Although the practical interpretation of the canonical variables is difficult at first, their process of extracting is based on the distinguished weighing of original traits, which normally have biological and economic importance. This fact was extremely important to elucidate the practical interpretation of these variables and made the evaluation of treatments easier.
Also, another important comparison between our results with those of Rosário et al. (Reference Rosário, Silva, Savino, Coelho and Moraes2005) is the possibility to evaluate the same strains and sexes a single time at 42 days under multivariate analysis, using canonical discriminant analysis, rather than collecting performance data during several weeks and analysing them under univariate analysis within each week or period. This would decrease the cost of evaluation of poultry strains.
Multivariate analyses have been used in studies about genetic divergence among laying hens (Barbosa et al., Reference Barbosa, Regazzi, Lopes, Breda, Sarmento, Torres and Torres Filho2005) and among broilers (Carneiro et al., Reference Carneiro, Fonseca, Pires, Torres Filho, Torres, Peixoto, Lopes and Euclydes2002) from Brazilian lines using cluster analysis associated with canonical variables. Pires et al. (Reference Pires, Carneiro, Torres Filho, Fonseca, Torres, Euclydes, Lopes and Barbosa2002) obtained canonical variables to study the genetic divergence among six Leghorn lines. Principal components analysis was applied by Liu et al. (Reference Liu, Lyon, Windham, Lyon and Savage2004), who studied the physical, colour and sensory characteristics of chicken breasts deboned 2, 4, 6 and 24 h post mortem and by Pinto et al. (Reference Pinto, Packer, Melo, Ledur and Coutinho2006), who studied the performance and carcass traits of two Brazilian chicken experimental populations designed to map quantitative trait loci. According to our study, we are proposing that canonical discriminant analysis may also be used to evaluate broiler chicken performance.
This study demonstrates the viability of canonical discriminant analysis to evaluate broiler chicken performance, discriminating and classifying strains and sexes with the highest productive potential. Thus, we encourage researchers in the animal science to analyse their performance data sets using this approach.
Conclusions
Multivariate analysis based on the canonical discriminant analysis is suitable to evaluate broiler chicken performance because there was a reduction from six original traits to only two canonical variables. Average live weight and carcass weight were the most important traits to discriminate treatments, whereas the contrast between average feed intake and average live weight plus feed conversion were used to classify them. There was a clear distinction between strains, within sex, where Cobb 500 and AgRoss 308 presented the highest multivariate performance mean. This distinction was also found between sexes, within strain, where males were better than females.
Acknowledgements
We are grateful to two anonymous referees for their suggestions and to A. S. A. M. T. Moura, from Faculdade de Medicina Veterinária e Zootecnia/UNESP – Brazil, for her kind contribution in the proofreading of the text.