





Introduction
Recent soybean production trends suggest that planting in early April can help maximize soybean yield (De Bruin and Pedersen Reference De Bruin and Pedersen2008; Egli and Cornelius Reference Egli and Cornelius2009; Heatherly and Elmore Reference Heatherly, Elmore, Heatherly and Elmore2004; Knott et al. Reference Knott, Herbek and James2019; Potter et al. Reference Potter, Cerrudo and Naeve2025; Robinson et al. Reference Robinson, Conley, Volenec and Santini2009; Rowntree et al. Reference Rowntree, Suhre, Weidenbenner, Wilson, Davis, Naeve, Casteel, Diers, Esker, Specht and Conley2013). Multistate research by Egli and Cornelius (Reference Egli and Cornelius2009) in the Midwest found that soybean yield increased when it was planted in April compared with later, and an approximately 1% decrease in soybean yield occurred with each day of planting after May 30. Yield data from 1999 to 2023 reported by Potter et al. (Reference Potter, Cerrudo and Naeve2025) demonstrated consistently higher yields, but greater variability, when soybean was planted in April compared with May. Additionally, Knott et al. (Reference Knott, Herbek and James2019) observed consistently higher yield from soybean planted in April compared with crops planted in May or later, despite increased stand loss and a longer interval between planting and soybean emergence.
Early planting of indeterminate soybean cultivars can result in a greater number of plant nodes and pods due to the extended period of vegetative and reproductive growth (Fehr and Caviness Reference Fehr and Caviness1977; Pedersen and Lauer Reference Pedersen and Lauer2004; Wilcox and Frankenberger Reference Wilcox and Frankenberger1987). Moreover, early planted soybean plants enter the reproductive stage before the summer solstice, leading to a seed fill period (i.e., the R5 to R6 growth stages) during longer days, which likely results in a higher grain weight (Pedersen and Lauer Reference Pedersen and Lauer2004). Beatty et al. (Reference Beatty, Eldridge and Simpson1982) reported a 30% increase in soybean plant height and a 16% increase in seed weight when a soybean crop was planted in April compared with July.
Despite the potential for higher grain yield from early planted soybean, adverse environmental conditions can occur during early spring that may affect crop development (Arsenijevic et al. Reference Arsenijevic, Dewerff, Conley, Ruark and Werle2022; Taylor-Lovell et al. Reference Taylor-Lovell, Wax and Nelson2001). Additionally, in early spring, a greater severity of soybean cyst nematode (SCN) and sudden death syndrome (SDS) can occur (Westphal et al. Reference Westphal, Li, Xing, McKay and Malvick2014). Management of soilborne pathogens includes the use of SCN-tolerant cultivars and effective SDS seeds that have been treated with a fungicide such as fluopyram (Kandel et al. Reference Kandel, Mueller, Legleiter, Johnson, Young and Wise2018). In Michigan, planting in mid-April resulted in smaller soybean stands compared with crops planted in mid-May, and the absence of a residual herbicide at planting resulted in only minimal stand reduction, which was likely due to weed competition during early soybean growth (Goddard et al. Reference Goddard, Singh and Sprague2025). Colder temperatures and wet soil increase the likelihood of crop injury from soil-residual herbicides that inhibit protoporphyrinogen oxidase (PPO) and photosystem II (PSII) in weeds that grow among early planted soybean crops (Bierman et al. Reference Bierman, Riechers, Sprague, Bollero and Pedersen2006; Moomaw and Martin Reference Moomaw and Martin1978; Niekamp et al. Reference Niekamp, Johnson and Smeda1999; Osborne et al. Reference Osborne, Shaw and Ratliff1995; Poston et al. Reference Poston, Nandula, Koger and Matt Griffin2008; Taylor-Lovell et al. Reference Taylor-Lovell, Wax and Nelson2001). Crop injury potential can be minimized by using a lower rate of a residual herbicide at planting (Harre et al. Reference Harre, Young, Hager and Young2021; Miller et al. Reference Miller, Landau, Williams and Hager2025). However, applying a lower rate shortens the duration of residual herbicide activity in the soil, potentially leading to subsequent weed flushes and reduced weed control compared with applying herbicides at full rates (i.e., field-use rates recommended by the product label), as well as increased selection pressure for weeds that become resistant to postemergence herbicides (Beckie Reference Beckie2006; Harre et al. Reference Harre, Young, Hager and Young2021; Poston et al. Reference Poston, Nandula, Koger and Matt Griffin2008).
Published literature is limited on the effects of using soil residual herbicides in early planted soybean on crop establishment, growth, and grain yield in Indiana. Furthermore, variation of soybean planting date can change the spectrum and density of difficult-to-control weed species present during early soybean growth stages and when postemergence herbicides are applied, requiring adjustments to the types of herbicides applied and when they are to be applied to achieve effective control of the most predominant weeds while minimizing crop injury. Therefore, we conducted experiments to evaluate the effect of soybean planting date and soil residual herbicide rate on weed density at postemergence herbicide application, weed density at soybean harvest, weed biomass at soybean harvest, soybean injury, soybean stand, soybean canopy coverage, and grain yield.
Materials and Methods
Field Experiments
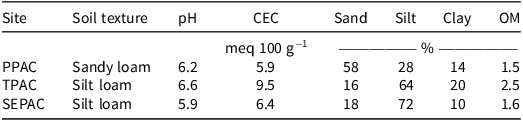
Field experiments were conducted at three latitude representative of agricultural regions in Indiana—north, central, and south—with distinct soil properties, environmental conditions, and weed spectrum, in 2024 and 2025, at three Purdue University agricultural centers (PACs): the Pinney PAC (PPAC) near Wanatah (41.44342°N, 86.92378°W); the Throckmorton PAC (TPAC) near Lafayette (40.37358°N, 86.90431°W), and the Southeast PAC (SEPAC) near Butlerville (39.03311°N, 85.52953°W)]. Soil properties for each site are described in Table 1. Trials were established using a two-way factorial design, comprising three herbicide programs and four planting dates. At TPAC, a split-plot design was used, with planting date as the main plot and herbicide program randomized within each main plot, replicated four times, resulting in a total of 48 experimental plots. At PPAC and SEPAC, a randomized complete block design with four replications was used. The trial design at each location was based on the available area for field trial establishment. Plots were 6 m wide and 30 m long at TPAC and 6 m wide and 91 m long at PPAC and SEPAC. Soybean cultivars were selected based on the preferred maturity group for each region: 3140E3 (Beck’s Hybrids, Atlanta, IN) at PPAC, 34EA12 (Stine Seed Company, Adel, IA) at TPAC, and P37A18E (Pioneer Hi-Bred International, Des Moines, IA) at SEPAC. All the soybean cultivars that were selected are resistant to 2,4-D, glufosinate, and glyphosate. The seed treatment packages were as follows: at PPAC, metalaxyl + azoxystrobin + thiabendazole (Escalate; Beck’s); at TPAC, azoxystrobin + fludioxonil + metalaxyl + thiabendazole (XP Complete 2.0; Stine); and at SEPAC, oxathiapiprolin (Lumisena; Corteva Agriscience, Indianapolis, IN) + penflufen + prothioconazole + metalaxyl (EverGol Energy; Bayer CropScience, St. Louis, MO) + Bacillus subtilis + Bacillus pumilus (L-2030G; BASF Corporation, Research Triangle Park, NC) + fluopyram (ILeVO; BASF). Soybean experiments were planted in 76-cm rows at a seeding rate of 345,000 seeds ha−1 in all three sites. All field sites were tilled using a field cultivator 7 d before the first planting date to prepare the soil. Additionally, a burndown application using glyphosate at 1,345 ae ha−1 + glufosinate at 656 ai ha−1 was performed to the plots assigned to the third and fourth planting dates at the time of the third planting date in all three locations to create a weed-free environment at planting comparable to the first two planting dates.
Soil properties at the 0- to 20-cm layer depth at the three trial locations.a

Table 1. Long description
The table presents soil properties at three agricultural sites in Indiana: PPAC, TPAC, and SEPAC. It includes data on soil texture, pH, cation exchange capacity (CEC), and the percentage of sand, silt, clay, and organic matter (OM) at each site. The table has 3 rows and 8 columns. Column headers are Site, Soil texture, pH, CEC, Sand, Silt, Clay, and OM. Row 1: PPAC, Sandy loam, 6.2, 5.9 meq 100 g-1, 58 percent, 28 percent, 14 percent, 1.5 percent. Row 2: TPAC, Silt loam, 6.6, 9.5 meq 100 g-1, 16 percent, 64 percent, 20 percent, 2.5 percent. Row 3: SEPAC, Silt loam, 5.9, 6.4 meq 100 g-1, 18 percent, 72 percent, 10 percent, 1.6 percent.
a Abbreviations: CEC, cation exchange capacity; OM, soil organic matter; PPAC, Pinney Purdue Agricultural Center (Wanatah, IN); SEPAC, Southeast Purdue Agricultural Center (Butlerville, IN); TPAC, Throckmorton Purdue Agricultural Center (Lafayette, IN).
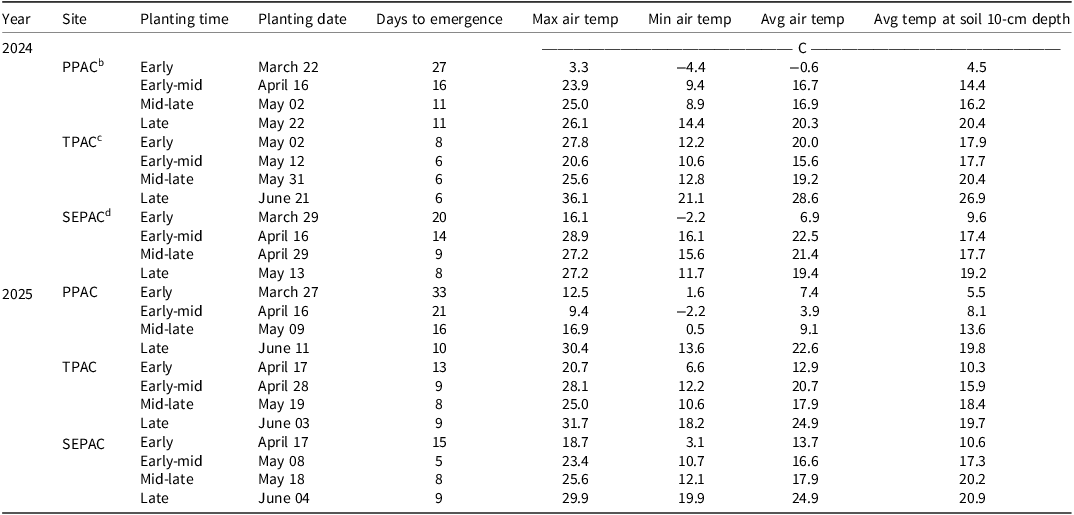
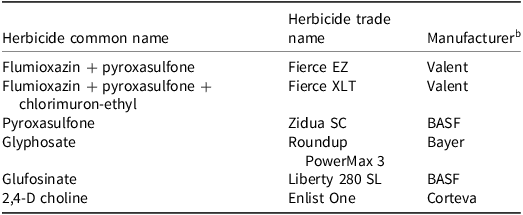
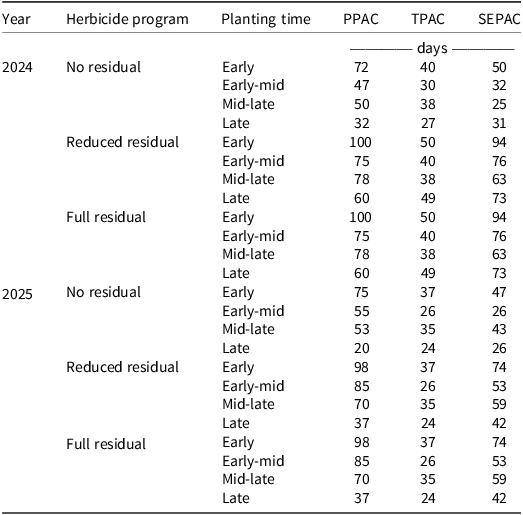
Four planting dates were established at each location, referred to as early, early-mid, mid-late, and late planting. The planting dates, soil and air temperatures, and relative humidity for each location are shown in Table 2. The herbicide programs consisted of 1) a full rate (1× of the field-use rate) of soil residual herbicide applied at planting (preemergence), followed by a postemergence herbicide application; 2) a reduced rate (2/3 of full labeled rate) of soil residual herbicide applied preemergence, followed by postemergence herbicide application; and 3) only a postemergence herbicide application (no residual). All postemergence herbicides were applied when weeds reached 10 to 16 cm in height. The herbicides used in this study are described in Table 3. The herbicides were selected based on effective active ingredients for the most predominant weeds at each location, and the rate of soil residual herbicide was determined according to label recommendations for each soil type, as described in Table 4. The predominant species at each site included common lambsquarters at PPAC; giant ragweed at TPAC; and waterhemp at SEPAC. Days between soybean planting and postemergence application are described in Table 5. Herbicide treatments were applied using a spray boom measuring 6 m and equipped with 12 AIXR11002 nozzles (TeeJet Spraying Systems Co., Wheaton, IL) spaced 50 cm apart mounted to an all-terrain vehicle. The sprayer was calibrated to deliver 140 L ha−1 while traveling at 5.6 km h−1 and operating at 276 kPa for both preemergence and postemergence applications.
Soybean planting date, days to emergence, and weather conditions at planting time.a

Table 2. Long description
The table presents data on soybean planting dates, days to emergence, and weather conditions at planting time for different sites and years. It includes columns for Year, Site, Planting time, Planting date, Days to emergence, Max air temp, Min air temp, Avg air temp, and Avg temp at soil 10-cm depth. The table has 28 rows and 9 columns. The sites include PPAC, TPAC, and SEPAC, with planting times categorized as Early, Early-mid, Mid-late, and Late. The data spans the years 2024 and 2025. Each row provides specific values for the planting date, days to emergence, and various temperature measurements. Notable trends include variations in temperature and emergence times across different planting dates and sites.
a Abbreviations: Avg, average; Max, maximum temperature; Min, minimum; temperature, PPAC, Pinney Purdue Agricultural Center; SEPAC, Southeast Purdue Agricultural Center; TPAC, Throckmorton Purdue Agricultural Center.
b Soybean variety 3140E4 (Beck’s Hybrids, Atlanta, IN), seeding rate = 345,000 seeds ha−1.
c Soybean variety 34EA12 (Stine Seed Company, Adel, IA), seeding rate = 345,000 seeds ha−1.
d Soybean variety 37A18E (Pioneer Hi-Bred International, Des Moines, IA), seeding rate = 345,000 seeds ha−1.
Source of herbicides used in the study.a

Table 3. Long description
A table with three columns and six rows, detailing herbicides used in a study. The columns are labeled ‘Herbicide common name’, ‘Herbicide trade name’, and ‘Manufacturer’. Row 1: Flumioxazin + pyroxasulfone, Fierce EZ, Valent. Row 2: Flumioxazin + pyroxasulfone + chlorimuron-ethyl, Fierce XLT, Valent. Row 3: Pyroxasulfone, Zidua SC, BASF. Row 4: Glyphosate, Roundup, Bayer. Row 5: Glufosinate, PowerMax 3, Bayer. Row 6: 2,4-D choline, Liberty 280 SL, BASF. Row 7: 2,4-D choline, Enlist One, Corteva.
a Specimen labels for each product and mailing and website addresses of each manufacturer can be found at www.cdms.net.
b Manufacturer locations: BASF Corporation, Research Triangle Park, NC; Bayer CropScience, St. Louis, MO; Corteva Agriscience, Indianapolis, IN; Valent U.S.A. Corporation, Walnut Creek, CA.
Herbicide mixtures and rates applied.a

Table 4. Long description
A table comparing herbicide mixtures and rates applied at different sites during preemergence and postemergence stages. The table has three rows and three columns. The columns are labeled Preemergence, Postemergence, and Site. The rows are labeled PPAC, TPAC, and SEPAC. Each cell contains specific herbicide mixtures and rates applied at each site. Row 1: PPAC, Preemergence: Flum + pyrox, Full rate: 70 + 89, Reduced rate: 47 + 59, Postemergence: Gly + gluf + 2,4-D, Rate: 1,345 + 656 + 1,065. Row 2: TPAC, Preemergence: Flum + pyrox + chlor, Full rate: 69 + 87 + 19, Reduced rate: 46 + 58 + 13, Postemergence: Gly + gluf + 2,4-D, Rate: 1,345 + 656 + 1,065. Row 3: SEPAC, Preemergence: Flum + pyrox + chlor, Full rate: 77 + 98 + 21, Reduced rate: 51 + 65 + 14, Postemergence: Gly + 2,4-D, Rate: 1,345 + 656 + 1,065, 1,345 + 1,065.
a Abbreviations: chlor, chlorimuron-ethyl; flum, flumioxazin; gluf, glufosinate; gly, glyphosate; PPAC, Pinney Purdue Agricultural Center; pyrox, pyroxasulfone; SEPAC, Southeast Purdue Agricultural Center; TPAC, Throckmorton Purdue Agricultural Center.
b Ammonium sulfate (Amsol; WinField United, Arden Hills, MN) at 50 mL L−1 was included in the tank mixture with all postemergence applications.
c At SEPAC, when a residual herbicide was applied at planting, pyroxasulfone at 30 g ai ha−1 was added to the POST application. Glufosinate (881 g ai ha−1) was applied a second time when the subsequent weed flush reached 10 to 15 cm in height when no residual herbicide had been applied.
Days from planting to postemergence herbicide applications in 2024 and 2025.a

Table 5. Long description
A table comparing days from planting to postemergence herbicide applications across different herbicide programs and planting times for the years 2024 and 2025. The table has 12 rows and 6 columns. The columns are labeled Year, Herbicide program, Planting time, PPAC, TPAC, and SEPAC. The rows are grouped by year and herbicide program, with planting times listed under each herbicide program. The values in the PPAC, TPAC, and SEPAC columns represent the number of days from planting to postemergence herbicide application. For 2024, under the No residual herbicide program, the days range from 32 to 72 for PPAC, 27 to 40 for TPAC, and 25 to 50 for SEPAC. Under the Reduced residual herbicide program, the days range from 60 to 100 for PPAC, 49 to 50 for TPAC, and 49 to 94 for SEPAC. Under the Full residual herbicide program, the days range from 60 to 100 for PPAC, 49 to 50 for TPAC, and 49 to 94 for SEPAC. For 2025, under the No residual herbicide program, the days range from 20 to 75 for PPAC, 24 to 37 for TPAC, and 26 to 47 for SEPAC. Under the Reduced residual herbicide program, the days range from 37 to 98 for PPAC, 24 to 37 for TPAC, and 42 to 74 for SEPAC. Under the Full residual herbicide program, the days range from 37 to 98 for PPAC, 24 to 37 for TPAC, and 42 to 74 for SEPAC.
a Abbreviations: PPAC, Pinney Purdue Agricultural Center; SEPAC, Southeast Purdue Agricultural Center; TPAC, Throckmorton Purdue Agricultural Center.
Data collection included soybean stand counts (number of plants per meter) recorded at the V3 growth stage in four 1-m random representative locations per plot. Soybean herbicide injury ratings consisted of visual assessments on a scale ranging from 0% (no injury) to 100% (complete plant death) at 14 d after emergence. Weed counts of predominant weed species were conducted prior to postemergence application using a 0.25-m2 quadrant at four random locations within each plot. Weed density data were combined within each plot, yielding a total measured area of 1 m2 per plot for analysis. Weed density and biomass (0.5 m2 quadrat per plot) were measured at harvest. To determine biomass, aboveground weeds were collected, placed in paper bags, and dried in a drying oven at 40 C for 7 d. To assess soybean canopy coverage (%), five photos were taken from the two center rows of each experimental unit when soybean at the early planting date reached the R2 growth stage (full bloom). Photos were captured using an inverted L-shaped pole 1.5 m in height, paired with an iPhone 14 Pro (Apple Inc., Cupertino, CA), and processed using Canopeo software (Oklahoma State University, https://www.canopeoapp.com) to estimate soybean green canopy coverage following the methodology explained by Arsenijevic et al. (Reference Arsenijevic, Dewerff, Conley, Ruark and Werle2022). To avoid miscalculation of soybean canopy coverage in weedy plots, photos were edited in Paint 3D (Microsoft, Richmond, WA; https://www.paint-3d.com) to remove the weed canopy before soybean canopy coverage estimation (Figure 1). Additionally, soybean grain yield was determined by harvesting all rows, excluding the border rows, from each plot at physiological maturity. Grain yield was adjusted to a standard moisture content of 13%. Soybean grain yield and moisture were collected using a small-plot combine using the H3 GrainGage system (HarvestMaster, Logan, UT). Data were analyzed to determine treatment differences on soybean stand, weed density at postemergence and harvest, weed biomass at harvest, soybean canopy coverage, and soybean yield.
Schematic representation of canopy coverage estimation: 1) Photographs with the background eliminated using Paint 3D software. 2) Photographs were uploaded into Canopeo software to estimate the percentage of soybean canopy coverage over bare soil.

Data Analysis
Data were subjected to ANOVA using the mixed function in RStudio (2025.05.1+513; Posit team 2025) and analyzed individually by location. Data from PPAC and SEPAC were analyzed with planting date, herbicide program, and year treated as fixed effects, and replication treated as a random effect. For the TPAC site, data were analyzed as a split-plot design with planting date as the main plot factor and herbicide program as the subplot factor, with year treated as a fixed effect and replication as a random effect. Assumptions of normality and homogeneity of variance were evaluated by visual assessment of residual plots. When the Shapiro–Wilk test indicated that the residuals were not normally distributed, common data transformations were evaluated. Weed density and biomass data were log-transformed, while soybean injury and canopy coverage were arcsine-transformed. However, back-transformed mean values are presented. Treatment means were separated using a Tukey HSD test at α = 0.05. A Pearson correlation analysis was conducted between canopy coverage and weed density at harvest, weed biomass at harvest, and soybean yield using the cor.test() function in RStudio.
Results and Discussion
Soybean Injury
At PPAC, the northernmost site, the most evident injury symptom was soybean leaf crinkling, likely caused by the active ingredient pyroxasulfone (Shaner Reference Shaner and Shaner2014a). Slightly increased soybean injury occurred at the early planting date when the residual herbicide was applied at either the full (15%) or reduced rate (10%) compared with later planting dates at either application rate (8%; data not shown). Soybean injury differences between early and later planting ranged from 5 to 7 percentage points at full rates, and from 4 to 5 percentage points at reduced rates. At SEPAC, the difference in soybean injury between planting dates did not exceed 4% (7% and 3% at early and late planting dates, respectively). The most evident visual symptoms from the residual herbicide application in SEPAC were soybean stunting and stem necrosis, likely caused by the active ingredients chlorimuron and flumioxazin, respectively (Shaner Reference Shaner and Shaner2014b, Reference Shaner and Shaner2014c). Higher levels of soybean injury from preemergence applications of flumioxazin followed by lower air temperatures have been reported in the literature (Niekamp et al. Reference Niekamp, Johnson and Smeda1999; Taylor-Lovell et al. Reference Taylor-Lovell, Wax and Nelson2001). Symptomology from the current field trials shows that visual injury was more associated with chlorimuron-ethyl and flumioxazin at SEPAC and with pyroxasulfone at PPAC.
At the site with the greatest injury, the difference between full and reduced residual rates at the early planting date was a difference of only 5 percentage points, demonstrating minimal negative effects on soybean seedling development from the use of full rates of residual herbicides. Summarized over sites, approximately 10% greater soybean injury occurred with residual herbicide application at early planting and application of full labeled rates compared with residual herbicide applications at later planting dates and reduced rates. At PPAC, the interaction between planting date and herbicide program on soybean injury may have been influenced by the coarser soil texture and cooler temperatures at this site compared with TPAC and SEPAC, where coarser soils typically result in greater herbicide concentrations in the soil solution for a short period after application (Green Reference Green1974).
Soybean Stand
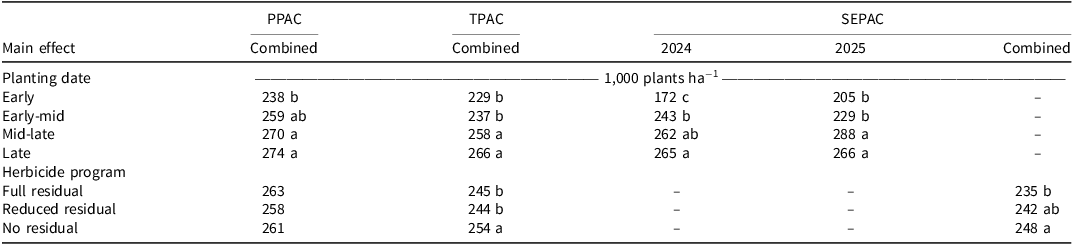
Early planting resulted in 13% to 35% lower soybean stand compared with late planting (Table 6). The greatest percentage stand reduction occurred with early planting at SEPAC in 2024, which could be attributed to a sharp decrease in temperature during the extended period following soybean planting. At TPAC and SEPAC, the use of a full rate of residual herbicide at planting resulted in a maximum of 5% reduction in stand compared with plants that received no residual herbicide (Table 6). Taylor-Lovell et al. (Reference Taylor-Lovell, Wax and Nelson2001) reported 19% to 52% soybean stand reduction from a preemergence application of flumioxazin that was primarily attributed to cool and dry soil conditions before and during soybean emergence. Results from the present study demonstrated less stand reduction from residual herbicide at planting compared with results reported by Taylor-Lovell et al. (Reference Taylor-Lovell, Wax and Nelson2001).

Table 6. Long description
A table comparing soybean stand based on planting date and herbicide program across different locations and years. The table has 10 rows and 7 columns. The columns are labeled as PPAC Combined, TPAC Combined, SEPAC 2024, SEPAC 2025, and SEPAC Combined. The rows are labeled with different planting dates (Early, Early-mid, Mid-late, Late) and herbicide programs (Full residual, Reduced residual, No residual). Each cell contains numerical values representing the soybean stand. Row 1: Early, 238 b, 229 b, 172 c, 205 b, -. Row 2: Early-mid, 259 ab, 237 b, 243 b, 229 b, -. Row 3: Mid-late, 270 a, 258 a, 262 ab, 288 a, -. Row 4: Late, 274 a, 266 a, 265 a, 266 a, -. Row 5: Full residual, 263, 245 b, -, -, 235 b. Row 6: Reduced residual, 258, 244 b, -, -, 242 ab. Row 7: No residual, 261, 254 a, -, -, 248 a.
a Abbreviations: PPAC, Pinney Purdue Agricultural Center; SEPAC, Southeast Purdue Agricultural Center; TPAC, Throckmorton Purdue Agricultural Center.
b Means followed by the same letter or no letter within a main effect and within the same column are not different at the α = 0.05 significance level according to a Tukey HSD test.
Reduced soybean stands (13% to 35%) with early planting compared with late planting were typically due to cold soil conditions after planting. Full rates of residual herbicides produced minimal stand reduction (<5%) compared with no residual herbicides and resulted in stands similar to those observed with reduced-rate residual herbicide applications, demonstrating no trade-off between adoption of best management practices for herbicide resistance management and soybean stand establishment (Harre et al. Reference Harre, Young, Hager and Young2021; Norsworthy et al. Reference Norsworthy, Ward, Shaw, Llewellyn, Nichols, Webster, Bradley, Frisvold, Powles, Burgos, Witt and Barrett2012).
Canopy Coverage
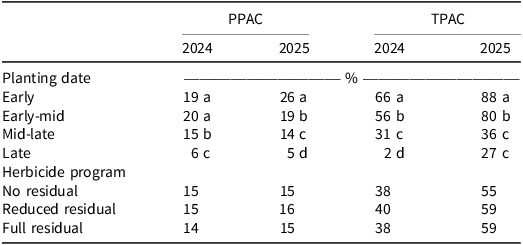
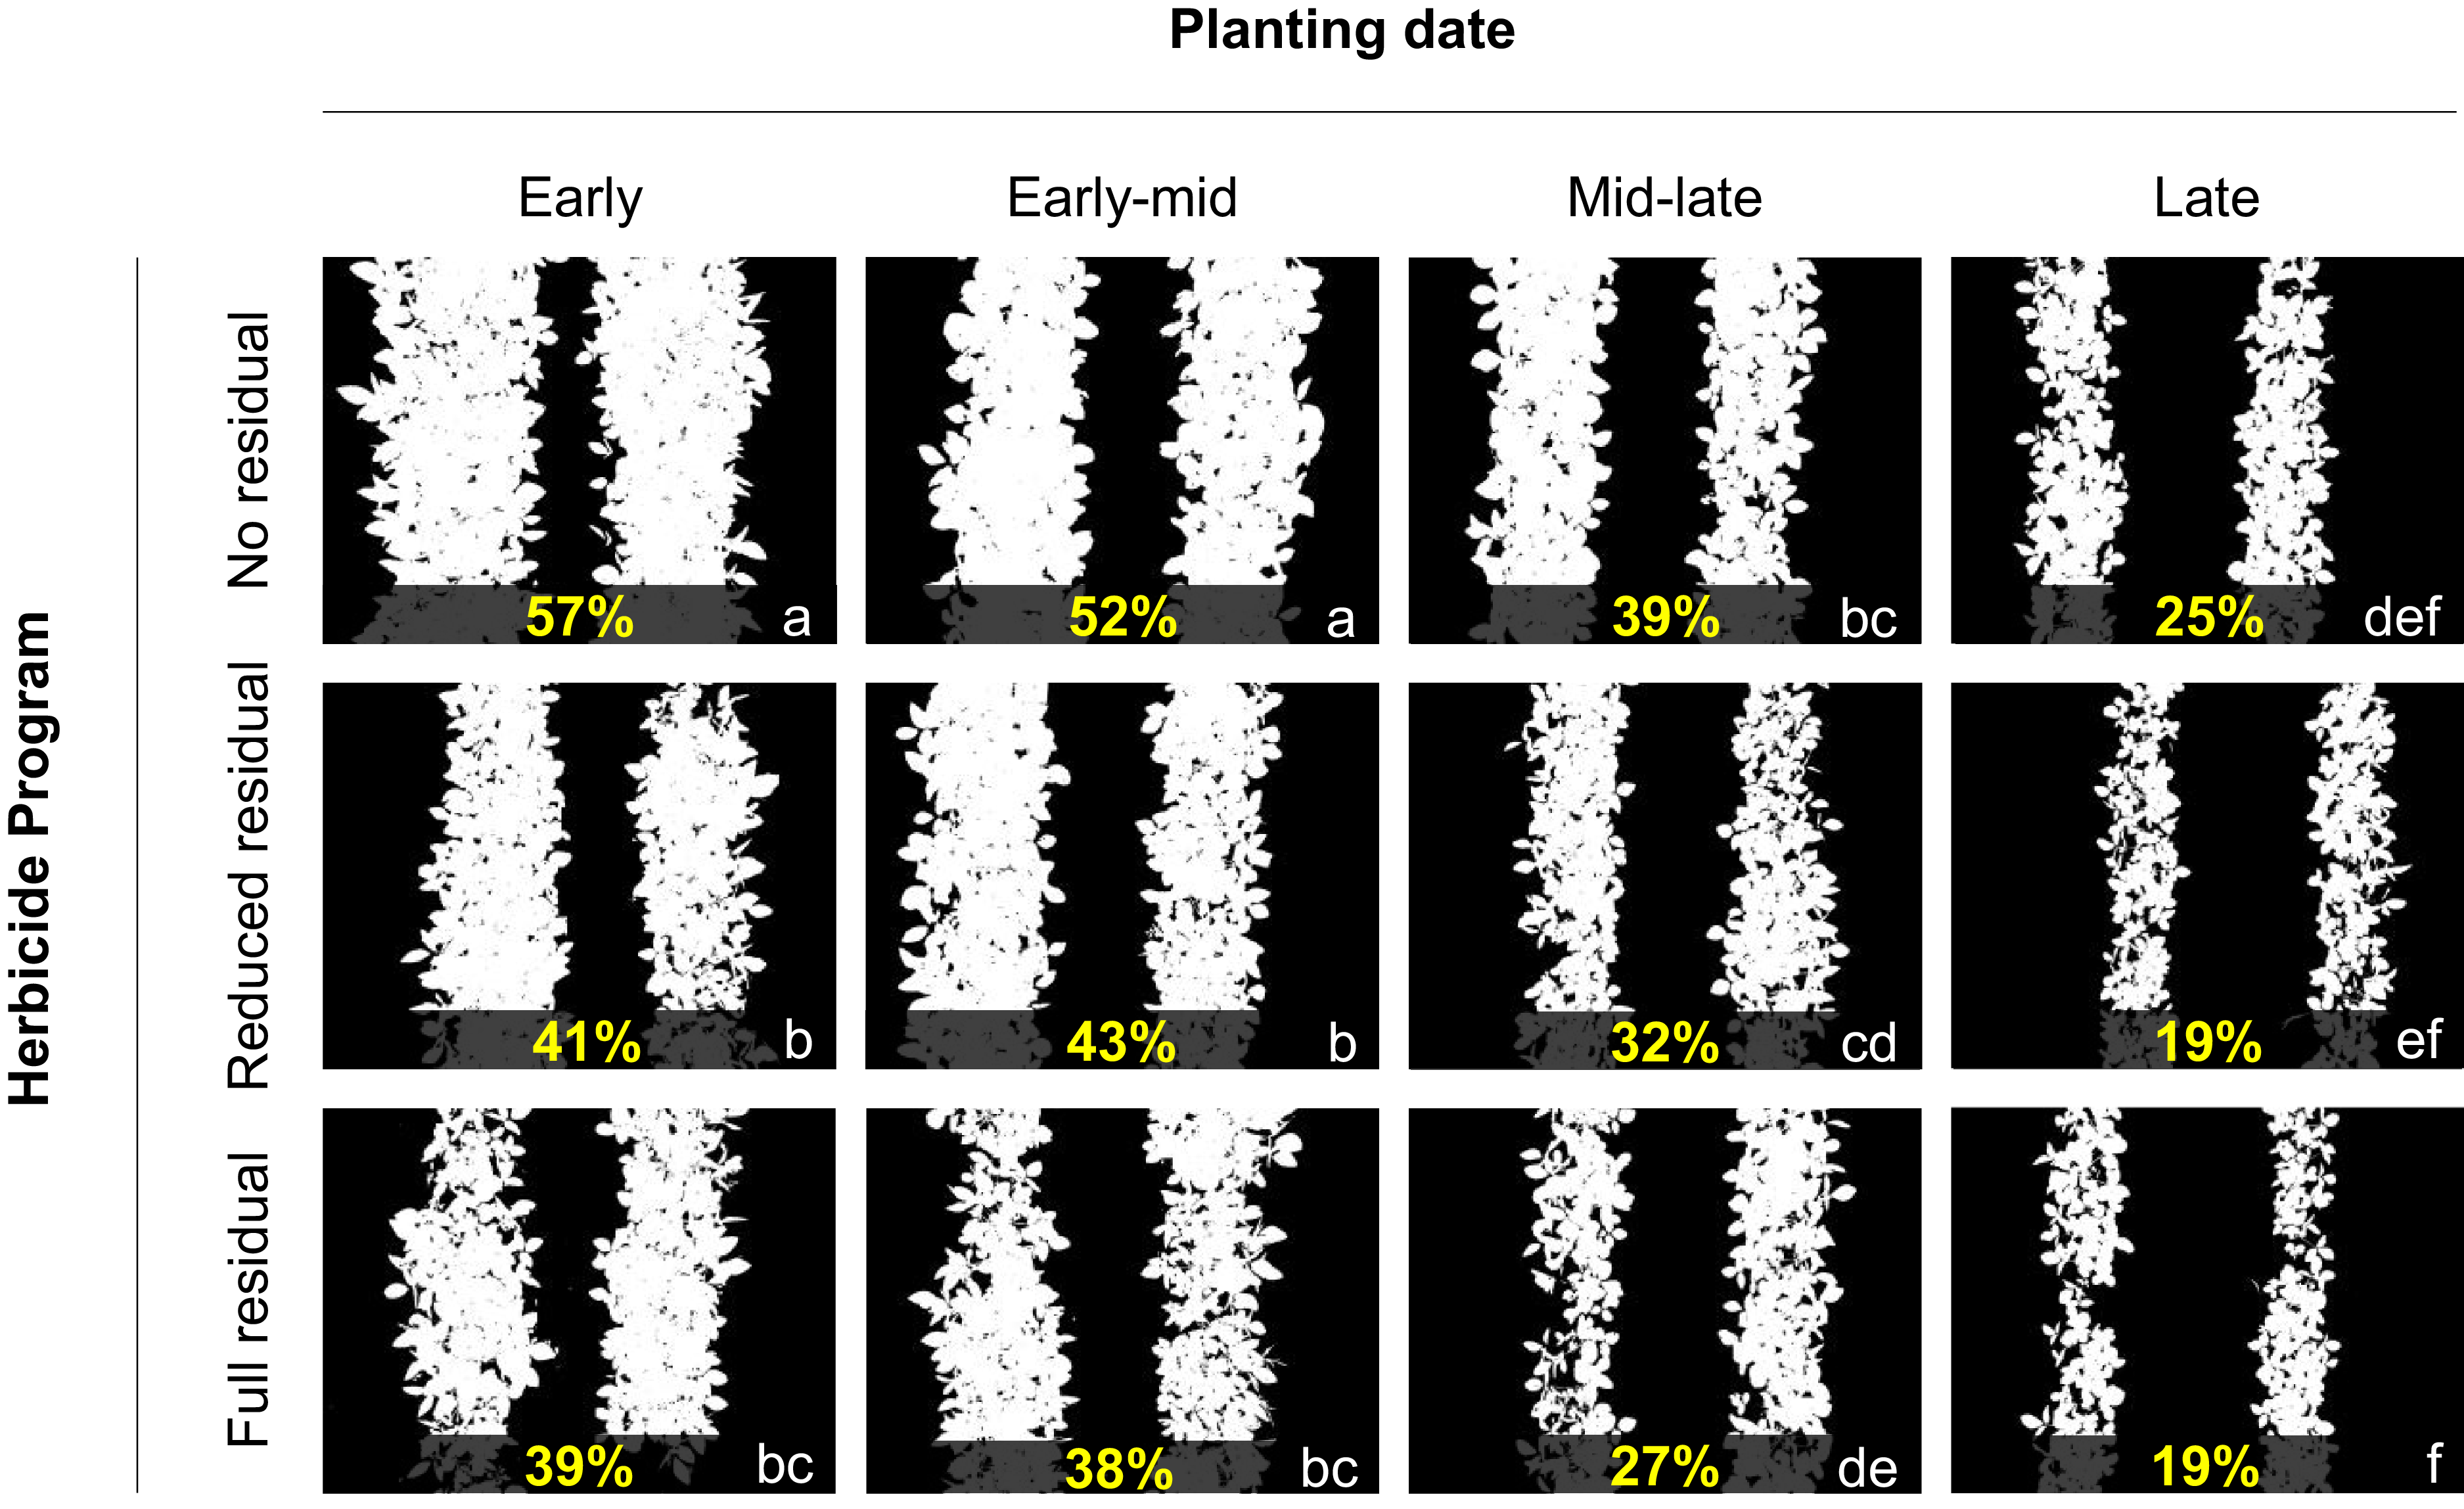
At PPAC and TPAC early planting resulted in greater soybean canopy coverage (Table 7), while at SEPAC, full and reduced rate herbicide applications at early planting led to lower soybean canopy coverage (Figure 2). In 2024 at PPAC, the early planting date resulted in canopy coverage similar to the early–mid planting date (19% and 20%, respectively), likely due to the delayed interval between soybean planting and emergence under early planting conditions (Table 2). At TPAC and in 2025 at PPAC, canopy coverage decreased as soybean planting was delayed (Table 7). Early planted soybean have a higher potential for greater canopy coverage early in the season (Arsenijevic et al. Reference Arsenijevic, Dewerff, Conley, Ruark and Werle2022; Goddard et al. Reference Goddard, Singh and Sprague2025; Robinson et al. Reference Robinson, Conley, Volenec and Santini2009).
Effect of planting date and herbicide program on soybean canopy coverage when early planted time reached the R2 growth stage.a,b

Table 7. Long description
A table comparing soybean canopy coverage based on planting date and herbicide program at PPAC and TPAC in 2024 and 2025. The table has 8 rows and 5 columns. The columns are labeled PPAC 2024, PPAC 2025, TPAC 2024, and TPAC 2025. The rows are labeled with planting dates (Early, Early-mid, Mid-late, Late) and herbicide programs (No residual, Reduced residual, Full residual). Row 1: Early, 19 a, 26 a, 66 b, 88 a. Row 2: Early-mid, 20 a, 19 b, 56 b, 80 b. Row 3: Mid-late, 15 b, 14 c, 31 c, 36 c. Row 4: Late, 6 c, 5 d, 2 d, 27 c. Row 5: No residual, 15, 15, 38, 55. Row 6: Reduced residual, 15, 16, 40, 59. Row 7: Full residual, 14, 15, 38, 59.
a Abbreviations: PPAC, Pinney Purdue Agricultural Center; TPAC, Throckmorton Purdue Agricultural Center.
b Means followed by the same letter or no letter within the same column are not different at the α = 0.05 significance level according to a Tukey HSD test.
Interaction effects of planting date and herbicide program on soybean canopy coverage (%) at the R2 growth stage for early planting at the Southeast Purdue Agricultural Center, near Butlerville, Indiana. Soybean canopy pictures with the same lowercase letters indicate no statistical difference at α = 0.5.

Figure 2. Long description
The image contains one diagram. The diagram is a grid of images showing soybean canopy coverage under different conditions. The grid is organized into rows and columns. The rows represent different herbicide programs: No residual, Reduced residual, and Full residual. The columns represent different planting dates: Early, Early-mid, Mid-late, and Late. Each cell in the grid contains an image of soybean canopy coverage with a percentage value indicating the coverage. The percentage values are accompanied by lowercase letters indicating statistical differences. The diagram shows that early planting dates generally result in higher canopy coverage percentages. The highest coverage is observed in the Early planting date with No residual herbicide program at 57 percent. The lowest coverage is observed in the Late planting date with Full residual herbicide program at 19 percent. The letters indicate that there are statistical differences between some of the treatments. For example, the Early planting date with No residual herbicide program (57 percent) is statistically different from the Late planting date with Full residual herbicide program (19 percent). The diagram suggests that planting date and herbicide program interact to affect soybean canopy coverage, with early planting and no residual herbicide generally resulting in higher coverage.
At SEPAC, application of residual herbicides resulted in similar canopy coverage at the late planting date, while at early and early–mid planting dates, residual herbicides applied full or reduced rates resulted in lower soybean canopy coverage (Figure 2). Reduced canopy coverage at SEPAC after residual herbicides were applied likely resulted from combined herbicide injury, fluopyram seed treatment injury, and high amounts of rain after planting (Arsenijevic et al. Reference Arsenijevic, Dewerff, Conley, Ruark and Werle2022; Kandel et al. Reference Kandel, Mueller, Legleiter, Johnson, Young and Wise2018).
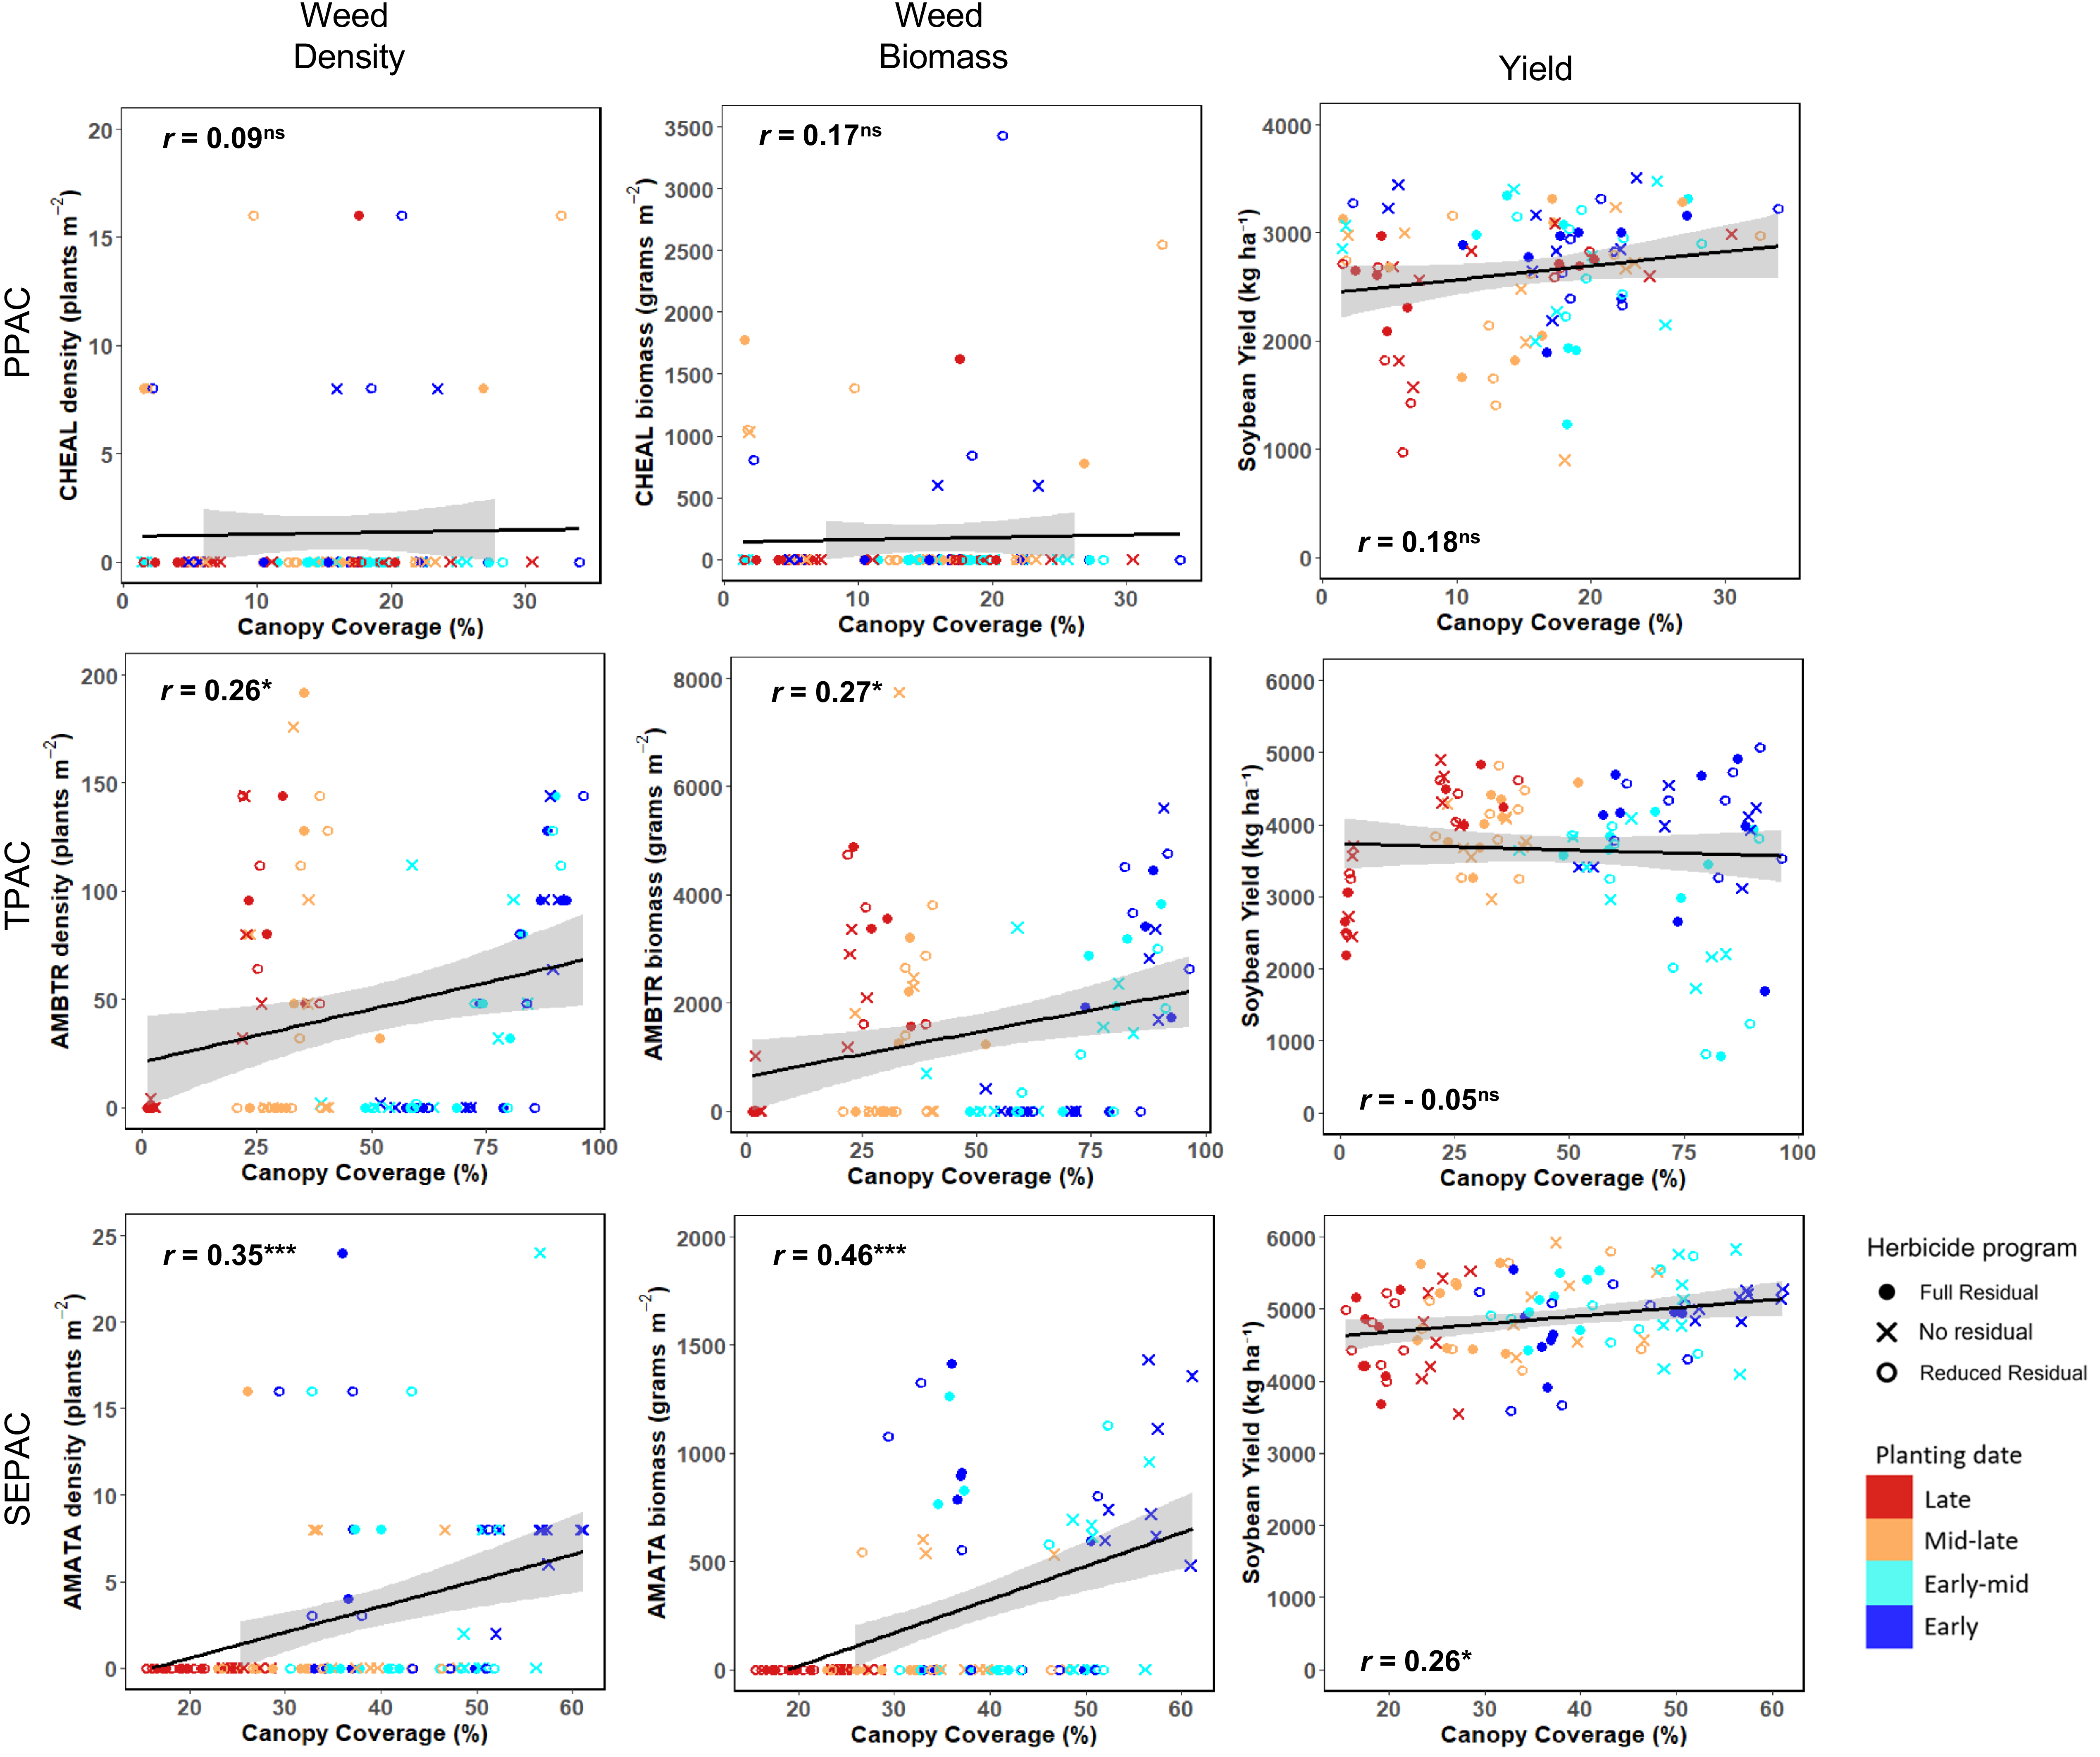
Despite early planting dates resulting in greater canopy coverage earlier in the season compared with later planting dates, weeds in early planted soybean reached the target height for postemergence herbicide application sooner, leading to weed escapes at soybean harvest due to continued weed emergence and growth after the postemergence application (Table 5) (Davis et al. Reference Davis, Clay, Cardina, Dille, Forcella, Lindquist and Sprague2013; Wu and Owen Reference Wu and Owen2014; Young et al. Reference Young, Young, Matthews, Owen, Zelaya, Hartzler, Wax, Rorem and Bollero2003). The earlier timing of postemergence herbicide applications at early planting compared with late planting was also reported by Goddard et al. (Reference Goddard, Singh and Sprague2025) and Miller et al. (Reference Miller, Landau, Williams and Hager2025). Soybean canopy coverage correlation results are supported by previous literature showing that early postemergence applications result in increased late-season weed escapes (DeWerff et al. Reference DeWerff, Conley, Colquhoun and Davis2015). The canopy coverage correlation results represent the first report showing that despite increased canopy development under early planting with no residual herbicide, this can lead to greater waterhemp escapes at soybean harvest (Figure 3).
Pearson’s correlation coefficients (r) between canopy coverage and weed density at harvest, weed biomass at harvest, and soybean yield. Coefficients were either nonsignificant at α = 5% (ns) or significant at P < 0.05 (*), P < 0.01 (**), or P < 0.001 (***).

Early planting resulted in greater canopy coverage earlier in the growing season compared with later planting dates. However, under conditions of drastic and prolonged cold weather, soybean emergence may be delayed, potentially offsetting the benefits of early planting for canopy development compared with later planting dates under warmer soil temperatures.
Weed Density at Postemergence Application
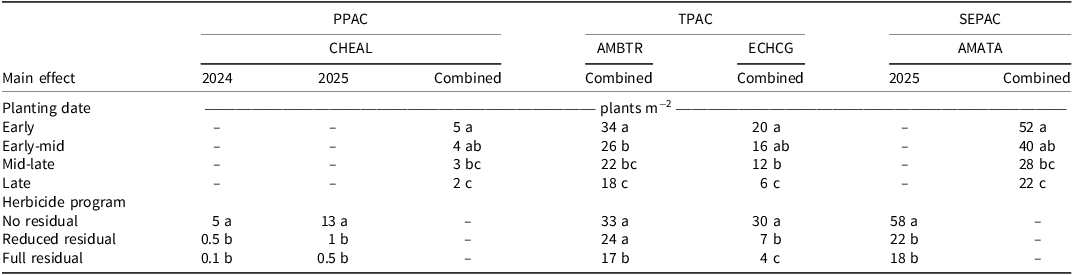
The early planting date resulted in greater common lambsquarters density at postemergence (5 plants m−2) compared with the mid-late and late planting dates (Table 8). Because common lambsquarters is an early emerging species, delaying soybean planting can reduce weed competition from the initial flush, which can be managed with burndown herbicide applications or mechanical weed control methods (Chudzik et al. Reference Chudzik, Nunes, Arneson, Dewerff, Ferreira, Proctor, Stoltenberg, Conley and Werle2025; Goddard et al. Reference Goddard, Singh and Sprague2025; Werle et al. Reference Werle, Sandell, Buhler, Hartzler and Lindquist2014). The early planting date resulted in greater giant ragweed density at postemergence compared with the early-mid, mid-late, and late planting dates (34, 26, 22, and 18 plants m−2, respectively). Application of a residual herbicide at the full rate resulted in a 49% reduction in giant ragweed density following postemergence application. The early planting date resulted in a similar waterhemp density at postemergence as the early-mid planting date (52 and 40 plants m−2, respectively), but higher than the mid-late and late planting dates (28 and 22 plants m−2, respectively).

Table 8. Long description
The table compares weed density at postemergence herbicide application across different planting dates and herbicide programs. It has 10 rows and 10 columns. The columns are labeled PPAC CHEAL 2024, PPAC CHEAL 2025, PPAC CHEAL Combined, TPAC AMBTR Combined, TPAC ECHCG Combined, and SEPAC AMATA 2025, SEPAC AMATA Combined. The rows are labeled Main effect, Planting date, Early, Early-mid, Mid-late, Late, Herbicide program, No residual, Reduced residual, and Full residual. Row 1: Main effect, Row 2: Planting date, Row 3: Early, Row 4: Early-mid, Row 5: Mid-late, Row 6: Late, Row 7: Herbicide program, Row 8: No residual, Row 9: Reduced residual, Row 10: Full residual. Column 1: PPAC CHEAL 2024, Column 2: PPAC CHEAL 2025, Column 3: PPAC CHEAL Combined, Column 4: TPAC AMBTR Combined, Column 5: TPAC ECHCG Combined, Column 6: SEPAC AMATA 2025, Column 7: SEPAC AMATA Combined. Row 3: Early, 5 a, 34 a, 20 a, 52 a. Row 4: Early-mid, 4 ab, 26 b, 16 ab, 40 ab. Row 5: Mid-late, 3 bc, 22 bc, 12 b, 28 bc. Row 6: Late, 2 c, 18 c, 6 c, 22 c. Row 8: No residual, 5 a, 33 a, 30 a, 58 a. Row 9: Reduced residual, 0.5 b, 24 a, 7 b, 22 b. Row 10: Full residual, 0.1 b, 17 b, 4 c, 18 b.
a Abbreviations: AMATA, Amaranthus tuberculatus (Moq.) Sauer; AMBTR, Ambrosia trifida L.; CHEAL, Chenopodium album L.; ECHCG, Echinochloa crus-galli L.; PPAC, Pinney Purdue Agricultural Center; SEPAC, Southeast Purdue Agricultural Center; TPAC, Throckmorton Purdue Agricultural Center.
b Means followed by the same lowercase letters within a main effect indicate no statistical difference in weed density based on a Tukey HSD test at α = 0.05.
Reducing selection pressure giant ragweed biotypes in soybean systems that are resistant to glyphosate-, 2,4-D, and glufosinate can be achieved by delaying soybean planting, allowing the first flushes to be controlled with tillage or burndown applications using herbicides in which herbicide-resistant biotypes is rare, such as paraquat, epyrifenacil, trifludimoxazin, and saflufenacil (Haarmann Reference Haarmann2023; Hawkes Reference Hawkes2014; Norsworthy et al. Reference Norsworthy, Ward, Shaw, Llewellyn, Nichols, Webster, Bradley, Frisvold, Powles, Burgos, Witt and Barrett2012; Parra Rapado et al. Reference Parra Rapado, Kölpin, Zeyer, Anders, Piccard, Porri and Asher2024; Sada et al. Reference Sada, Jin, Hikosaka and Ido2025; Steppig et al. Reference Steppig, Johnson and Young2024). Waterhemp results represent the first report of the effect of soybean planting date on density at the time of postemergence application. Early planting resulted in greater weed density when postemergence herbicides were applied for both weed species that typically germinate early and have a narrow germination window and those with later and wider germination windows. Differences in weed suppression between full and reduced herbicide rates were dependent on weed species, site, and year.
Weed Density and Biomass at Soybean Harvest
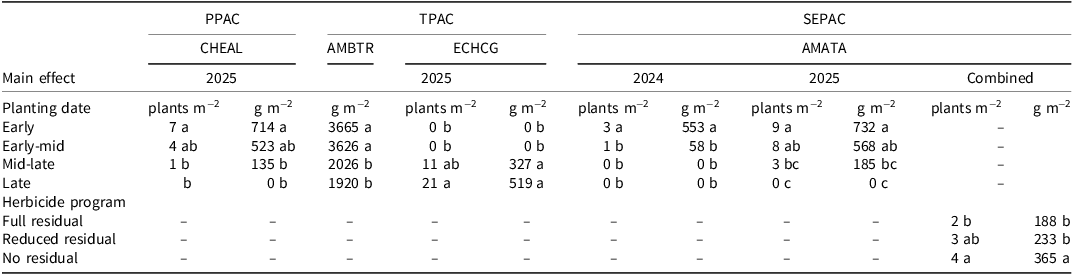
At PPAC in 2025, the early planting date resulted in higher common lambsquarters density and biomass at harvest compared with later planting dates (Table 9). At TPAC, the early and early-mid planting dates resulted in greater giant ragweed biomass (3,665 and 3,626 g m−2, respectively) at harvest than the mid-late and late planting dates (2,026 and 1,920 g m−2, respectively; Table 9).

Table 9. Long description
A table comparing weed density and biomass at soybean harvest across different planting dates and herbicide programs. The table has 12 rows and 12 columns, including headers. The columns are grouped under three main effects: PPAC, TPAC, and SEPAC, with subcategories CHEAL, AMBTR, ECHCG, and AMATA. The rows are labeled with planting dates (Early, Early-mid, Mid-late, Late) and herbicide programs (Full residual, Reduced residual, No residual). The columns show weed density (plants per square meter) and biomass (grams per square meter) for each combination of planting date and herbicide program. Row 1: Early planting date, PPAC CHEAL, 7 plants m^-2, 714 g m^-2; TPAC AMBTR, 0 plants m^-2, 3665 g m^-2; TPAC ECHCG, 0 plants m^-2, 0 g m^-2; SEPAC AMATA, 3 plants m^-2, 553 g m^-2; Combined, 9 plants m^-2, 732 g m^-2. Row 2: Early-mid planting date, PPAC CHEAL, 4 plants m^-2, 523 g m^-2; TPAC AMBTR, 0 plants m^-2, 3626 g m^-2; TPAC ECHCG, 0 plants m^-2, 0 g m^-2; SEPAC AMATA, 1 plant m^-2, 58 g m^-2; Combined, 8 plants m^-2, 568 g m^-2. Row 3: Mid-late planting date, PPAC CHEAL, 1 plant m^-2, 135 g m^-2; TPAC AMBTR, 11 plants m^-2, 2026 g m^-2; TPAC ECHCG, 327 plants m^-2, 519 g m^-2; SEPAC AMATA, 0 plants m^-2, 0 g m^-2; Combined, 3 plants m^-2, 185 g m^-2. Row 4: Late planting date, PPAC CHEAL, 0 plants m^-2, 0 g m^-2; TPAC AMBTR, 21 plants m^-2, 1920 g m^-2; TPAC ECHCG, 0 plants m^-2, 0 g m^-2; SEPAC AMATA, 0 plants m^-2, 0 g m^-2; Combined, 0 plants m^-2, 0 g m^-2. Row 5: Full residual herbicide program, SEPAC AMATA, 2 plants m^-2, 188 g m^-2; Combined, 3 plants m^-2, 233 g m^-2. Row 6: Reduced residual herbicide program, SEPAC AMATA, 3 plants m^-2, 233 g m^-2; Combined, 4 plants m^-2, 365 g m^-2. Row 7: No residual herbicide program, SEPAC AMATA, 4 plants m^-2, 365 g m^-2; Combined, 4 plants m^-2, 365 g m^-2.
a Abbreviations: AMATA, Amaranthus tuberculatus (Moq.) Sauer; AMBTR, Ambrosia trifida L.; CHEAL, Chenopodium album L.; ECHCG, Echinochloa crus-galli L.; PPAC, Pinney Purdue Agricultural Center; SEPAC, Southeast Purdue Agricultural Center; TPAC, Throckmorton Purdue Agricultural Center.
b Weed density is measured by the number of plants per square meter (plants m−2) and biomass is measured in grams per square meter (g m−2).
c Means followed by the same lowercase letters indicate no statistical difference in weed denisty and biomass based on a Tukey HSD test at α = 0.05.
At SEPAC in 2024, the early planting date resulted in higher waterhemp density and biomass at harvest (Table 9). In 2025, the early planting date resulted in similar density and biomass as the early-mid planting date but was higher than that of the mid-late and late planting dates (Table 9). Applying the full rate of a residual herbicide resulted in lower waterhemp density at harvest. Full and reduced-rate residual herbicides resulted in lower waterhemp biomass. Current results showing greater weed density and biomass indicate that early planting leads to greater long-term weed persistence and increased selection pressure for herbicide-resistant biotypes (Norsworthy et al. Reference Norsworthy, Ward, Shaw, Llewellyn, Nichols, Webster, Bradley, Frisvold, Powles, Burgos, Witt and Barrett2012).
Weed density and biomass at harvest followed the same trend as weed density at postemergence, with early planting resulting in greater weed escapes compared with late planting. Greater late-season weed control with field-use rates over reduced rates was dependent on weed species but generally favored full rates. Reduced rates of residual herbicides resulted in waterhemp densities at harvest that were similar to those when no residual herbicide was applied, reinforcing the recommendation to use rates listed on the product label for long-term weed control and to reduce genetic variability in the weed seedbank (Hager et al. Reference Hager, Wax, Bollero and Simmons2002).
Soybean Yield
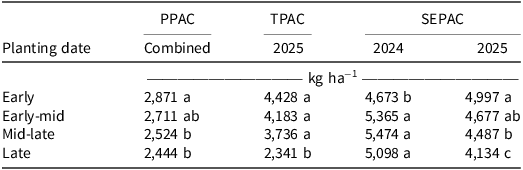
Early planting resulted in a higher yield, with the exception of SEPAC in 2024, where early planting resulted in a 35% stand reduction (Table 10). Herbicides had no effect on soybean yield (data not shown). Yield increases from early planting over late planting ranged from 15% to 47%. As the interval between planting dates decreased, yield differences also decreased, ranging from 12% to 44% between early-mid and late planting, and from 8% to 37% between mid-late and late planting (Table 10). Similar results reported by Egli and Cornelius (Reference Egli and Cornelius2009) demonstrated that soybean yield in upper Midwest states declines linearly when planting occurs after May.

Table 10. Long description
The table presents data on soybean yield based on planting date across different locations and years. It has four rows and three columns. The column headers are PPAC Combined, TPAC 2025, and SEPAC. The row labels are Planting date, Early, Early-mid, Mid-late, and Late. The values in the table are as follows: Row 1: Planting date, Combined, 2025, 2024, 2025. Row 2: Early, 2,817 a, 4,428 a, 4,673 b, 4,997 a. Row 3: Early-mid, 2,711 ab, 4,183 a, 5,365 a, 4,677 ab. Row 4: Mid-late, 2,524 b, 3,736 a, 5,474 a, 4,487 b. Row 5: Late, 2,444 b, 2,341 b, 5,098 a, 4,134 c. The table shows that early planting generally results in higher yields, with some exceptions and variations across different locations and years.
a Abbreviations: PPAC, Pinney Purdue Agricultural Center; SEPAC, Southeast Purdue Agricultural Center; TPAC, Throckmorton Purdue Agricultural Center.
b Means followed by the same lowercase letters indicate no statistical difference in soybean yield based on a Tukey HSD test at α = 0.05.
Greater yields from early planting occurred in all site-years, except when drastic stand reductions occurred. Overall, planting soybean in late March or early April results in greater yields than planting in May. However, in some scenarios, unfavorable weather after planting can cause severe stand loss and, consequently, yield penalties. Despite concerns over the use of soil residual herbicides on early planted soybean, the current results represent the first report of no interactive effect between residual herbicides and soybean planting date on soybean yield.
Practical Implications
Injury from full rates of soil residual herbicides applied to early planted soybean was minimal and temporary. Current results show greater yield from early planted soybean and no interaction between herbicides and planting date on soybean yield. Although early planting resulted in a lower soybean stand, stand density remained above the threshold typically associated with yield loss. Since growers typically prioritize planting corn during its optimum planting window, soybean is often planted when the soil is cold, which increases the risk for reduced stand establishment in early planted soybean. The use of soil-residual herbicides at full rates listed on the product label resulted in a maximum of 5% stand reduction compared with no use of residual herbicides.
Early planting resulted in greater canopy coverage early in the season compared with late planting; however, this increased canopy coverage did not contribute to improved weed suppression. Weed control with postemergence herbicides was more challenging when the crop was planted early than later because early planting resulted in higher weed density at the time of postemergence herbicide application. Weed density and biomass at soybean harvest were also greater when the crop was planted early than late primarily because postemergence herbicides were applied earlier in the season, allowing for sequential weed emergence before soybean canopy closure. Early planting resulted in greater soybean yield but it created more challenges for weed control. This suboptimal weed management scenario in early planted soybean may lead to increased persistence of difficult-to-control weeds in the field and, consequently, greater selection pressure for herbicide-resistant weed biotypes.
Acknowledgments
We thank the graduate students, faculty, and staff at Purdue University for their assistance with this study.
Funding
United Soybean Board provided partial support for this research.
Competing Interests
The authors declare they have no competing interests.



 Open access

