Introduction
The BLUP genetic evaluation method enables the evaluation of animals of different herds jointly and allows the comparison of estimated breeding values (EBVs) of animals in different herds. However, the accuracy of such comparison depends on the degrees of connectedness between herds. The higher the connectedness, the more accurate the comparisons. Therefore, it is important to measure the degree of connectedness among herds, and bring it to a level that allows across-herd comparisons of EBVs with reasonable accuracy.
Several methods have been developed to measure the degree of connectedness. Foulley et al. (Reference Foulley, Bouix, Goffinet and Elsen1990 and Reference Foulley, Hanocq and Boichard1992) proposed a connectedness index (CI). Laloë (Reference Laloë1993) introduced the concept of generalized coefficient of determination (CD). Fries (Reference Fries1998) suggested measuring connectedness using the number of direct genetic links between herds due to common sires and dams, which, although very simple, generally underestimates the connectedness because it ignores the indirect links and the links due to common environment. Since the objective of measuring connectedness is to obtain an indication of the accuracy as well as the bias of comparisons between EBVs in different herds, Kennedy and Trus (Reference Kennedy and Trus1993) suggested that the most appropriate measure of connectedness would be the average prediction error variance (PEV) of differences in EBVs between animals in different management units. Laloë et al. (Reference Laloë, Phocas and Ménissier1996) compared PEV with CI and CD and concluded that CD combines aspects of genetic variability and PEV, and is thus a method of choice to assess the connectedness. Kuehn et al. (Reference Kuehn, Lewis and Notter2007) also argued that CD was a perfect indicator of potential bias remaining when comparing individuals in separate units. However, if the primary objective of measuring connectedness is to identify herds where EBVs are poorly estimated in comparison to those of other herds so that remedial action can be taken, then a method that assesses only the accuracy of such comparisons would be most appropriate. Therefore, PEV was often chosen as the standard against which to evaluate all other methods (e.g. Mathur et al., Reference Mathur, Sullivan and Chesnais2002; Roso et al., Reference Roso, Schenkel and Miller2002; Huisman et al., Reference Huisman, Tier and Brown2006). The calculation of PEV (and CD) requires the inverse corresponding to the animal effects in the coefficient matrix of the mixed model equations (MME). This matrix is usually huge and its inverse is very difficult to be calculated even with the most modern computer. A simulation study by Kennedy and Trus (Reference Kennedy and Trus1993) suggested that the PEV of the differences between herds (PEVD) had a high correlation (0.995) with average PEV of differences in EBVs between animals, and can be used as an effective measure of the degree of connectedness between herds. However, the computational problem remains for large populations with many management units. In addition, PEVD depends on the size and structure of herds. Mathur et al. (Reference Mathur, Sullivan and Chesnais1998 and Reference Mathur, Sullivan and Chesnais2002) proposed using connectedness rating (CR), expressed as the correlation between the estimates of herd effects, to approximately estimate PEV. The authors proved CR is strongly related to PEV and less depends on herd size and variation than PEVD, and thus can be used to estimate connectedness. This method has been used routinely in the national swine genetic evaluation in Canada.
In China, a national swine improvement program was initiated in 1998 (Fu, Reference Fu2005) with the main aim of setting up a national joint swine breeding system. The key point of the system is cross-herd genetic evaluation. The connectedness among herds has to be taken into account in this program. The objective of this study is to estimate the degree of connectedness among pig herds in China using the CR method of Mathur et al. (Reference Mathur, Sullivan and Chesnais1998).
Material and methods
Data
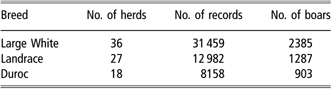
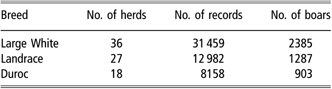
Three data sets, which consist of records on age at 100 kg of three pig breeds from different herds, were used to study the connectedness between herds. The herds included in the data sets represent the major pig breeding farms in China. The pigs producing these records were born between 1998 and 2005. The numbers of animals and herds in each data set are shown in Table 1.
Number of records, herds and boars in three data sets
Model
The data sets were analyzed for each breed using the following linear animal model:

where y is the vector of records on age at 100 kg, h is the vector of herd effects, a is the vector of random animal additive genetic effects, p is the vector of random litter effects, and X, Z and T are incidence matrices for h, a and p, respectively.
The expectation and variance matrix of the random variables are defined as
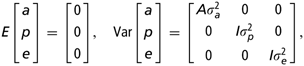
where  and
 represent additive genetic variance, litter variance and residual variance, respectively, and A is the additive genetic relationship matrix for animals. The MME corresponding to this model is
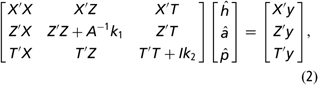
where  and
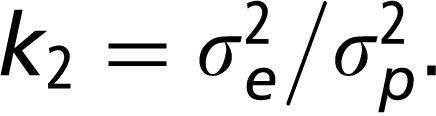 . For analyzing the connectedness, only the coefficient matrix is needed.
Calculation of connectedness ratings
The CR between herd i and herd j is defined by the following formula (Mathur et al., Reference Mathur, Sullivan and Chesnais1998):
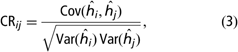
where  and
 are the estimated effects of herd i and herd j, respectively, obtained from the MME. The average CR for one herd is defined as the average of its CRs with all other herds.
The calculation of the variances and covariances in formula (3) requires the elements of the inverse of the coefficient matrix of MME corresponding to the herd effects. It is very difficult to obtain the inverse directly when the data set is large. Hence, Mathur et al. (Reference Mathur, Sullivan and Chesnais1998) applied the following procedure:
Since

therefore

where W′W is the coefficient matrix of MME, I is an identity matrix, (W′W)i is a vector of W′W corresponding to herd i and Ii is a vector of the identity matrix corresponding to herd i. Solving equations
(4)for herd i and herd j separately, the required elements for calculation of the variances and covariances in formula (3) can be obtained. The program for calculating CR using this approach can be found at the website of the Canadian Center for Swine Improvement (http://www.ccsi.ca/connectedness).
Result and discussion
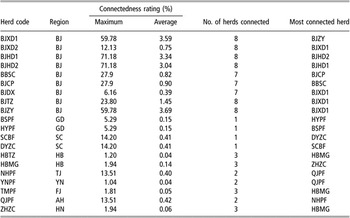
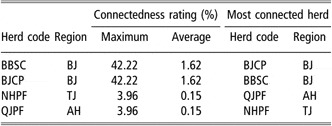
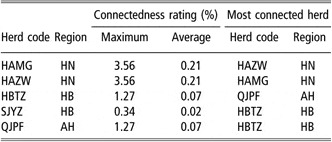
The average CR values for Large White, Landrace and Duroc are given in Tables 2–4, respectively. Only the herds with an average CR greater than zero are listed in Tables 2–4 as they are connected with at least one other herd.
Average connectedness rating between herds in Large White

Average connectedness rating between herds in Landrace

Average connectedness rating between herds in Duroc

In Large White, of the 36 herds analyzed there are 20 herds with average CR greater than zero. The highest CR (71.18%) was observed between herd BJHD1 and BJHD2. A further inspection into the data revealed that these herds shared 76 common sires that have 72.3% of their progeny in BJHD1 and 21.4% in BJHD2. Herd BJXD1 has the highest average CR because it shares its boars with four other herds. However, most of the other herds have strong genetic links with only one or few herds, but no or very weak connections with other herds. In general, the higher connectedness was observed between herds within the same region.
In Landrace and Duroc, of the 27 and 18 herds analyzed, respectively, only four Landrace and five Duroc herds were found to have connectedness with other herds. They are all connected with just one herd.
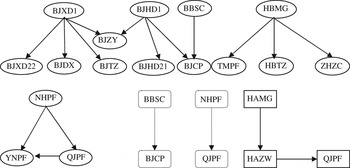
A certain degree of connectedness between herds is a precondition for comparing EBVs of different herds with reasonable accuracy. However, as can be seen in the results, most major pig breeding herds in China have no or very weak connectedness with other herds. The major reason for this is that there is very limited use of artificial insemination (AI) in the swine industry in China. The existing connectedness between the few herds is mainly due to the importation of breeding animals from a same foreign farm or sales of breeding animals from one farm to another. Figure 1 shows the flow of boars among herds that are connected to each other. As can be seen, the superior boars often came from same herds and the flow directions are unexceptionally unidirectional. There are some herds between which there is no direct link due to boars but still some connectedness exists, e.g., herds BSPF and HYPF. This may be due to sales of sows between them.
Flow of boars among herds that are connected to each other. Ellipses represent herds for Large White, rectangles for Duroc and rounded rectangles for Landrace.

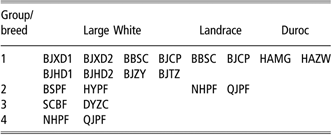
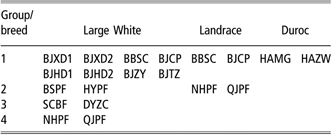
By analyzing the field data from the Canadian national swine database, Mathur et al. (Reference Mathur, Sullivan and Chesnais1998) recommended that for backfat and age at 100 kg, a minimum average CR of 3% would be required to ensure a reasonably accurate comparison of EBVs of a herd with that of the other herds. According to this criterion, only for a few groups of herds as shown in Table 5, within which the average CR of one herd with other herds is greater than 3%, the EBVs of animals of one herd are comparable with that of other herds of the same group with reasonable accuracy. This means that the cross-herd genetic evaluation has to be limited within these groups and a large-scale cross-herd genetic evaluation is not practicable at present. To implement the national joint genetic evaluation, great efforts are needed for improving the connectedness among herds in China. Schemes to increase the connectedness generally involve either the use of common sires across herds or the use of central test stations. In China, currently there are only a few test stations, but contrary to the situation in most countries of north America and Europe, where the numbers of test stations have declined, the number of test stations has increased in recent years and will be further increased in the near future. However, due to the limited scale of test stations, the role of test stations in increasing connectedness is limited. Therefore, the key point is to increase the use of common boars through extending the use of AI in the swine industry in China. Based on an extensive AI system, the connectedness can be improved by exchanging semen between herds or by forming a pool of superior AI boars, using AI boars with high CRs, and obtaining a sufficient proportion of progeny from these animals. Enough progeny of every reference sires is important to permit accurate comparisons of animals across herds. Increasing the proportion of progeny from the common sires can improve connectedness (Mathur et al., Reference Mathur, Sullivan and Chesnais1998), and reduced the bias of comparisons (Kuehn et al., Reference Kuehn, Lewis and Notter2007).
Herds for which joint genetic evaluation can be conducted based on their connectedness rating
Conclusions
The levels of connectedness between pig breeding herds in China are generally low. Most herds are connected with only one or a few other herds. National or regional cross-herd genetic evaluation is not feasible currently. The cross-herd genetic evaluation can be conducted only for a few herds that have average CRs greater than 3% between them. Great efforts are needed to establish and enhance the connectedness between herds by means of extensively using AI in the swine industry in China. This will help to increase the accuracy and effectiveness of across-herd genetic evaluations as well as to increase the rate of genetic improvement in China.
Acknowledgments
This study is financially supported by the 948 Project of the Ministry of Agriculture (Grant No. 2004-Q3) and the National Key Technology R&D Program of China (Grant No. 2006BAD10A02-01).