

1. Introduction
There is a wealth of research on farm investment behaviour (e.g. Bakucs et al., Reference Bakucs, Fertő and Fogarasi2009; Benjamin and Phimister, Reference Benjamin and Phimister2002; Bierlen and Featherstone, Reference Bierlen and Featherstone1998; Bojnec and Latruffe, Reference Bojnec and Latruffe2011; Bokusheva et al., Reference Bokusheva, Bezlepkina and Lansink2009; Hüttel et al., Reference Hüttel, Musshoff and Odening2010; Kallas et al., Reference Kallas, Serra and Gil2012; Latruffe, Reference Latruffe2005; Latruffe et al., Reference Latruffe, Davidova, Douarin and Gorton2010; Petrick, Reference Petrick2004a, Reference Petrick2004b; Zinych and Odening, Reference Zinych and Odening2009). However, studies that deal with Kornai's work (Reference Kornai1979, Reference Kornai1980, Reference Kornai1986) on soft budget constraints (SBCs) in a new institutional framework in agriculture are generally limited to one country and exclude cross-country comparisons, except for Benjamin and Phimister (Reference Benjamin and Phimister2002), and Fertő et al., (Reference Fertő, Bakucs, Bojnec and Latruffe2017). Kornai (Reference Kornai1979) specified that SBCs exist when a funding source – e.g. a bank or government – finds it impossible to maintain an enterprise within a fixed budget; i.e. whenever an enterprise can extract ex post a bigger subsidy or loan than would have been considered efficient ex ante (Maskin, Reference Maskin1996). From four different variants of Kornai's SBCs for firms – soft subsidies, soft taxation, soft credit and soft administrative prices – the focus in this paper is on potential soft investment subsidies and soft credit.
Previous research provides evidence of capital market imperfections in Central and Eastern European (CEE) countries during transition and after accession to the European Union (EU) (Bojnec and Fertő, Reference Bojnec and Fertő2016; Bojnec and Latruffe, Reference Bojnec and Latruffe2011; Latruffe, Reference Latruffe2005). Some papers have described analyses that tested the hypothesis of the persistence of SBCs in transition economies. However, SBCs may also persist once countries have shifted to market economies, leading to the postponement of restructuring (Kornai, Reference Kornai2001; Kornai et al., Reference Kornai, Maskin and Roland2003). SBCs may be more important in the agricultural sector, since the government support that farms receive is generally much greater than is the case with firms in the manufacturing sector.
This paper describes an investigation of the presence of SBCs and credit market imperfections in Estonian, Hungarian and Slovenian farms. An Euler equation model in a dynamic panel setting is applied as a methodological approach. The historical development and the evolution of farms in the EU vary by country, and also within the CEE region. The nominal rate of protection has been found to be highest during the initial stage of transition from a centrally planned to a market economy in Slovenia, followed by Hungary and Estonia (Bojnec and Swinnen, Reference Bojnec and Swinnen1997). In CEE countries, differentials in farm size and growth are legacies of an earlier communist system and the institutional and policy reforms of the 1990s. During the communist era, Estonian and Hungarian agriculture was collectivised and average farm size in these two countries was – and still is – among the largest in Europe. In Slovenia communist collectivisation failed and a small-scale farm structure persisted, thus average farm size is among the smallest in Europe (Bojnec and Latruffe, Reference Bojnec and Latruffe2013). The evolution of farm structure in the EU is shaped by policy support, in particular by Common Agricultural Policy (CAP) measures (Piet et al., Reference Piet, Latruffe, Le Mouël and Desjeux2012). The transition from a centrally planned to a market economy in Slovenia has further strengthened the development of small-scale family farms, while in Estonia and Hungary a bimodal farm structure has emerged with a greater number of small-scale family farms and less numerous large-scale corporate farms. The proportion of small farms in Slovenian agriculture is much higher than in Estonia and Hungary. Therefore, our comparative analysis includes three countries with different historical-institutional legacies and different farm structures: small-scale farms in Slovenia, and a bimodal structure with small-scale and large-scale farms in Estonia and Hungary.
Our study contributes to the literature related to Kornai's (Reference Kornai1979, Reference Kornai1980, Reference Kornai1986) SBC theory, originally developed for a socialist economy, wherein the origin of shortages is considered to be SBCs. In this era, large, state-owned companies had to meet investment goals and received unlimited financing. As a consequence, SBCs created shortages in the markets for consumer goods. The transition from centrally planned to market economies led to the elimination of shortages of consumer goods due to economic and trade liberalisation and transformation, with the associated restructuring of economies. We describe here empirical aspects of investment behaviour and financial constraints – particularly SBCs – in CEE agricultural farms in Estonia, Hungary and Slovenia. Previous research has investigated the issue of investment–cash flow sensitivity. Bakucs et al., (Reference Bakucs, Fertő and Fogarasi2009), Bojnec and Latruffe (Reference Bojnec and Latruffe2011), Bojnec and Fertő (Reference Bojnec and Fertő2016) and Fertő et al., (Reference Fertő, Bakucs, Bojnec and Latruffe2017) found evidence of capital market imperfections in Hungary and Slovenia during times of transition, but no study has focused on whether such imperfections persisted after 2007, or examined how these vary between countries with different farming structures and historical-institutional legacies. Our comparative paper thus seeks to fill this gap in micro farm-level data and the concept of SBCs (Kornai, Reference Kornai1979, Reference Kornai1980, Reference Kornai1986, Reference Kornai2001; Lizal and Svejnar, Reference Lizal and Svejnar2002; Kornai et al., Reference Kornai, Maskin and Roland2003) using an applied econometric approach, thereby contributing to the literature about SBCs in a new institutional economics framework with a focus on different organisational forms and historical-institutional legacies that affect farm investment (Aoki, Reference Aoki2001; Bojnec et al., Reference Bojnec, Fertő and Fogarasi2014; Brousseau and Glachant, Reference Brousseau and Glachant2008; Martino et al., Reference Martino, Karantininis, Pascucci, Dries and Codron2017; Ménard and Shirley, Reference Ménard and Shirley2008, Reference Ménard and Shirley2014) in three countries – Estonia, Hungary and Slovenia. We have applied comparative approach to explain the diversity of farm investment behaviour across countries, where farm organisational structures and institutions with CAP measures play an important role. Our results indicate that SBCs have persisted in farms in new EU member states irrespective of the different forms of organisational farming and institutions with CAP measures.
The remainder of the paper has the following structure: in section 2 we describe the importance of the topic of analysis, the need for the study and how we derived our research questions. In section 3 we explain the Euler equation used in econometric estimations, while in section 4 we discuss our data and provide descriptive statistics about the sample of farms in Estonia, Hungary and Slovenia. In section 5 we present econometric empirical results. Last, section 6 summarises the main findings, discusses implications for agri-food policy, and offers suggestions for further work.
2. Theoretical background
The issue of agricultural SBCs in new EU member states is important for (at least) the following three reasons: first, the three countries under analysis share an institutional-historical legacy of SBCs with some similarities and differences in the initial conditions of the former communist system and transition from a centrally planned to a market economy. Estonia, part of the former Soviet Union and Hungary belonged to the Council for Mutual Economic Assistance (1949–1991), while Slovenia was a part of former Yugoslavia, which aimed to develop a self-managed economy. However, the common property of these socialist societies was SBCs, internal contradictions and a state of inefficiency (Kornai, Reference Kornai1992). Second, during the socialist period agriculture was one of the most heavily subsidised sectors and government transfers to agriculture continued and were strengthened further by the introduction and implementation of the CAP. Therefore, in spite of the transition to a market economy with trade and market liberalisation and privatisation, there may still exist significant agricultural SBCs. Finally, the possible presence of SBCs may make these economies less efficient and competitive not only in the long term, but also in the short-to-medium term. The potential presence of SBCs could limit market selection processes and the restructuring of inefficient farms and agricultural enterprises due to the less efficient allocation of limited resources leading to income redistribution. Therefore, in the study of SBCs this topic is still relevant and important not only from the perspective of the institutional-historical legacies that might affect farm investment, but also for investment behaviour in the context of the EU’s CAP and is of relevance to farm-enterprise managers, policymakers, business analysts and government officials in terms of fostering an understanding of farm investment behaviour in the EU, particularly in new member states.
A body of literature has emerged about firm/farm investment behaviours, financial constraints and SBCs. Fazzari et al., (Reference Fazzari, Hubbard and Petersen1988) started the debate about whether a high level of sensitivity of firm investment to cash flow can be interpreted as a sign of firm financial constraints. This was followed by intense debate about the extent to which firm/farm investment is constrained by the availability of financing, and whether a positive and statistically significant relationship between investment and cash flow can be seen as an indicator of financial constraints (e.g. Bojnec and Latruffe, Reference Bojnec and Latruffe2011; Fertő et al., Reference Fertő, Bakucs, Bojnec and Latruffe2017; Hubbard, Reference Hubbard1998; Schiantarelli, Reference Schiantarelli1995).
The concept of financial constraints was initially applied to Western market economies in terms of how firms face financial constraints and their ability to deal with financial distress. Guariglia (Reference Guariglia2008) found that the effects of internal financial constraints (i.e. the availability of internal firm cash flow and coverage ratio of funds) are weaker than the effects of external financial constraints (access to external finance proxied by firm size and age) on firm investment, suggesting that investment may be significantly constrained by access to external finance.
Kornai's (Reference Kornai1980, Reference Kornai1986, Reference Kornai2001) concept of SBCs was integrated into the literature about investment models. SBCs describe the paternalistic behaviour of the state in centrally planned economies in terms of the provision of large subsidies to unprofitable firms or granting them credit on soft terms. The SBC concept argues that government subsidies eliminate the threat of bankruptcy for firms, which may thus continue to operate inefficiently. Furthermore, SBCs may prevent unprofitable or inefficient units from restructuring, and labour being reallocated to more efficient uses (Kornai et al., Reference Kornai, Maskin and Roland2003).
The presence and consequences of SBCs have been investigated in CEE transition economies, more frequently for different samples of firms than for different samples of farms. Research has identified an underdeveloped credit market and weaknesses in firms’ formal channels for obtaining financial capital related to an ineffective regulatory system, an underdeveloped financial system, and government corruption (Li and Ferreira, Reference Li and Ferreira2011). The persistence of SBCs prevents restructuring due to a reluctance to shed surplus labour to avoid unemployment (Li, Reference Li2008; Zinych and Odening, Reference Zinych and Odening2009). Lizal and Svejnar (Reference Lizal and Svejnar2002) confirmed the existence of SBCs in Czech firms during the 1990s in cases when firm investment was negatively related to firm-level profitability. Colombo and Stanca (Reference Colombo and Stanca2006) identified SBCs in large Hungarian state-owned firms, while Hobdari et al., (Reference Hobdari, Jones and Mygind2009) identified SBCs relating to the investments of financially constrained Estonian firms.
Zinych and Odening (Reference Zinych and Odening2009) report the presence of SBCs in large Ukrainian farms, while Bakucs et al., (Reference Bakucs, Fertő and Fogarasi2009) have provided evidence of the existence of SBCs in Hungarian farms. Bojnec and Latruffe (Reference Bojnec and Latruffe2011) found that SBCs were not important in Slovenian family farms, but investment decisions were constrained by the availability of finance. Fertő et al., (Reference Fertő, Bakucs, Bojnec and Latruffe2017) find evidence of financial constraints on Hungarian farms and the existence of SBCs in farms in France. The availability of finance can hinder farms from making crucial investments, while an increase in input prices and a decrease in output prices may reduce farm profits and thus their financial resources (Bojnec and Latruffe, Reference Bojnec and Latruffe2011). Empirical evidence of financial obstacles to farm investment has been provided, for example, for farms in Poland (Petrick, Reference Petrick2004a, Reference Petrick2004b; Latruffe, Reference Latruffe2005), Hungary (Bakucs et al., Reference Bakucs, Fertő and Fogarasi2009), Lithuania (Latruffe et al., Reference Latruffe, Davidova, Douarin and Gorton2010), Russia (Bokusheva et al., Reference Bokusheva, Bezlepkina and Lansink2009), Ukraine (Zinych and Odening, Reference Zinych and Odening2009) and Slovenia (Bojnec and Fertő, Reference Bojnec and Fertő2016; Bojnec and Latruffe, Reference Bojnec and Latruffe2011).
The issue of government support for relaxing financial constraints and promoting business investment has become a challenging topic, particularly during the most recent financial and economic crisis when the credit market sometimes failed to provide firms/farms with the necessary funds (Bojnec and Latruffe, Reference Bojnec and Latruffe2011). Government support in the form of subsidies on the credit market for relaxing businesses capital constraints may have adverse effects such as attracting (or supporting) low-quality business operators (Hoff and Stiglitz, Reference Hoff and Stiglitz1998) or halting labour shedding on farms (Petrick and Zier, Reference Petrick and Zier2012). Accordingly, the literature suggests several types of policy intervention and related farm assistance programmes. A distinction should be made between government subsidies (money given for free) and private sector support in the form of credit provision or advance payment by the private sector: the latter does not involve government subsidies, but is rather part of a system of interlinked contracts whereby farmers receive some inputs, but this is taken into account when the output price is determined (Dries and Swinnen, Reference Dries and Swinnen2004).
In the Estonian, Hungarian and Slovenian farming sectors, specific agricultural and rural development policies have targeted investments by farms and other economic businesses in rural areas. Investment support for the restructuring of agriculture and for rural development has been one of the most important measures of rural development policy in these countries. Bojnec and Latruffe (Reference Bojnec and Latruffe2011) found that investment subsidies in Slovenian agriculture during the time of transition did not help farms to overcome their financial constraints, but operational subsidies for production may be helping farms to invest.
This paper investigates the presence of SBCs and credit market imperfections in the financial constraints of Estonian, Hungarian and Slovenian farms and provides insight into potential obstacles to farm investment with policy and business implications. Following Fertő et al., (Reference Fertő, Bakucs, Bojnec and Latruffe2017), the paper provides insights into investment and financial constraints in farms using in-depth evidence from Estonia, Hungary and Slovenia, and addresses four main research questions: (1) Did farms in the three new EU member states face binding constraints during the adoption of CAP that impeded them from restructuring or fostering investment? (2) If so, what types of constraints did they mainly face (SBCs and/or financial constraints on investment)? (3) Were farms faced with a position of non-separability between investment and borrowing decisions? (4) Can investment subsidy policies help relax financial constraints and enhance farm investment?
3. Methodology
We start with the model developed by Bond and Meghir (Reference Bond and Megir1994), which assumes that farm investment behaviour is a dynamic process and describes capital accumulation rates in individual periods. Thus, our baseline investment or adjustment costs model specification is defined by the following Euler equation:
 $$\eqalign{\left( {\displaystyle{{\rm I} \over {\rm K}}} \right)_{{\rm it}} & = {\rm \alpha} _0 + {\rm \alpha} _1\left( {\displaystyle{{\rm I} \over {\rm K}}} \right)_{{\rm it}-1} \, + \; {\rm \alpha} _2\left( {\displaystyle{{\rm I} \over {\rm K}}} \right)_{{\rm it}-1}^2 \, + \; {\rm \alpha} _3\left( {\displaystyle{{{\rm CF}} \over {\rm K}}} \right)_{{\rm it}-1} \cr & \quad + {\rm \alpha} _4\left( {\displaystyle{{\rm S} \over {\rm K}}} \right)_{{\rm it}-1} \, + \; {\rm d}_{\rm t} + {\rm \beta} _{\rm i} + {\rm v}_{{\rm it}},} $$
where the investment (I) of farm i in a particular year t is defined not only by sales growth (S) and farm liquidity proxied by cash flow (CF) in the year t–1, but also by farm investment in the year t–1. All variables are normalised using capital (K). From the theoretical model we can derive the following hypotheses: It is expected that the regression coefficient of the lagged investment term α1 will be positive and greater than one if a farm's real discount rate is positive. The regression coefficient of the squared investment term α 2 is predicted to be negative and greater than one in absolute value, reflecting costs of adjustment that increase and are convex in terms of the size of investment. The sign of the regression coefficient of the cash flow term α 3 should be negative or not significant under the assumption that the farm can raise as much money as it desires at a given cost. A positive and significant cash flow regression coefficient is usually interpreted as a sign of credit rationing and thus an indicator of financial constraints (Fazzari et al., Reference Fazzari, Hubbard and Petersen1988). Lizal and Svejnar (Reference Lizal and Svejnar2002) have suggested that the regression coefficient α 3 should be considered an indication of the presence of SBCs, and proposed two interpretations for the latter: first, a weak version when the regression coefficient α 3 is zero, when firms have access to credit for investment irrespective of their profitability; and second, a strong version of SBCs when coefficient α 3 is negative, when firms with poor financial performance can access bank loans more easily. Under conditions of perfect competition and constant return to scale the regression coefficient α 4 = 0, thus a positive sign for the sales variable implies the presence of imperfect competition in the output market.
Second, we include in the Euler equation investment model the quadratic term for the debt (D) variable (Rizov, Reference Rizov2004):
 $$\eqalign{\left( {\displaystyle{{\rm I} \over {\rm K}}} \right)_{{\rm it}} & = {\rm \alpha} _0 + {\rm \alpha} _1\left( {\displaystyle{{\rm I} \over {\rm K}}} \right)_{{\rm it}-1} \,+ \; {\rm \alpha} _2\left( {\displaystyle{{\rm I} \over {\rm K}}} \right)_{{\rm it}-1}^{\! 2} \,+ \; {\rm \alpha} _3\left( {\displaystyle{{{\rm CF}} \over {\rm K}}} \right)_{{\rm it}-1} \cr & \quad + {\rm \alpha} _4\left( {\displaystyle{{\rm S} \over {\rm K}}} \right)_{{\rm it}-1} \,+ \; {\rm \alpha} _5\left( {\displaystyle{D \over K}} \right)_{\rm it-1}^{\! 2} \,+ \; {\rm d}_{\rm t} \,+ \; {\rm \beta} _{\rm i} \,+ \; {\rm v}_{{\rm it}}.} $$
The specification of equation (2) allows for testing of non-separability between investment and borrowing decisions (Bond and Meghir, Reference Bond and Megir1994). The regression coefficient of the D variable, α 5, is expected to be zero under conditions of perfect capital markets (α 5 = 0). It may be positive and significant (α 5 > 0), signalling that a farm relies on borrowing to finance its investment, while if it is negative (α 5 < 0) it can be interpreted as an indicator of bankruptcy costs.
Third, we include the investment subsidy (X) as a controlling explanatory variable into the model as derived in the previous steps. Thus we estimate the augmented investment model using the form:
 $$\eqalign{\left( {\displaystyle{{\rm I} \over {\rm K}}} \right)_{{\rm it}} & = {\rm \alpha} _0 + {\rm \alpha} _1\left( {\displaystyle{{\rm I} \over {\rm K}}} \right)_{{\rm it}-1} \, + \; {\rm \alpha} _2\left( {\displaystyle{{\rm I} \over {\rm K}}} \right)_{{\rm it}-1}^2 \, + \; {\rm \alpha} _3\left( {\displaystyle{{{\rm CF}} \over {\rm K}}} \right)_{{\rm it}-1} \cr & \quad + {\rm \alpha} _4\left( {\displaystyle{{\rm S} \over {\rm K}}} \right)_{{\rm it}-1} \, + \; {\rm \alpha} _5\left( {\displaystyle{D \over K}} \right)_{\rm it-1}^2 \, + \; {\rm \alpha} _6\left( {\displaystyle{{\rm X} \over K}} \right)_{{\rm it}} \, + \; {\rm d}_{\rm t} \, + \; {\rm \beta} _{\rm i} + {\rm v}_{{\rm it}}.} $$
Two definitions of investment subsidy are used in the empirical procedure: first, a continuous variable (X/K it), and second, a dummy (DX it), which takes a value of one if a farm has received an investment subsidy in a given year, and zero otherwise.
In investigating SBCs our main interest is in the cash flow variable. In the case of developed market economies, low cash flow investment sensitivity (α 3 ≤ 0) is usually interpreted as evidence of perfect capital markets. However, this conclusion is not appropriate for agriculture where the existence of policy support is typical. The presence of generous agricultural subsidies may imply a soft financial environment in which unprofitable farms have access to credit. This provision of money allows for the realisation of investments independent of cash flow. Consequently, these farms exhibit lower cash flow investment sensitivity, which translates into a non-significant cash flow parameter in the Euler equation. This implies a non-positive cash flow parameter that may indicate the presence of the SBC phenomenon rather than perfect capital market conditions. Thus, significant sensitivity of investment with regard to cash flow (α 3 > 0) may reflect the process of hardening budget constraints, or binding liquidity constraints.
It is important to note that SBCs are a complex phenomenon that may create serious challenges for empirical analyses. The literature identifies several sources of SBCs, including soft investment subsidies and soft credit (see Kornai et al., Reference Kornai, Maskin and Roland2003). Due to this complexity, it is difficult to establish a clear relationship between the presence of SBCs and a farm's financial strategy. Zinych and Odening (Reference Zinych and Odening2009) emphasise that analysis of the investment–financing relationship in a simple linear fashion, as in equation (2), is obviously inadequate because of the non-linearity implied by the different financial situations of farms. Besides borrowing farms that are considered a priori unconstrained, other farms do not receive loans and thus are differently sensitive to investment demand with regards to capital structure. Thus, it is difficult to differentiate between firm- or farm-specific effects on investment and the effects of financial constraints (Kaplan and Zingales, Reference Kaplan and Zingales1997). To do this requires determining exogenously the premium on external finance, and furthermore, whether a firm/farm is confronted with more or less severe market imperfections.
Thus, following Rizov (Reference Rizov2004) and Zinych and Odening (Reference Zinych and Odening2009) we divide our total sample into two subsamples according to their financial status. We employ an indicator for the availability of external funds (that is, financial status) as the time-specific dummy variable z. This variable equals one when no new borrowing is present, and is zero otherwise. More specifically, farms are considered unconstrained if they borrow for at least two consecutive years. The dummy interacts with the other variables from equation (2) for the constrained regime and expresses the difference between the two financial regimes. Because the level of new borrowing is implicitly included in the debt-to-capital ratio, we omit the latter variable in the specification with sample separation. Thus we estimate the following model:
 $$\eqalign{\left( {\displaystyle{{\rm I} \over {\rm K}}} \right)_{{\rm it}} & = {\rm \alpha} _0 + {\rm \alpha} _1\left( {\displaystyle{{\rm I} \over {\rm K}}} \right)_{{\rm it}-1} \, + \; {\rm \alpha} _2\left( {\displaystyle{{\rm I} \over {\rm K}}} \right)_{{\rm it}-1}^2 \, + \; {\rm \alpha} _3\left( {\displaystyle{{{\rm CF}} \over {\rm K}}} \right)_{{\rm it}-1} \cr & \quad + {\rm \alpha} _4\left( {\displaystyle{{\rm S} \over {\rm K}}} \right)_{{\rm it}-1} \, + \; {\rm \alpha} _5z\left( {\displaystyle{{\rm I} \over {\rm K}}} \right)_{{\rm it}-1} \, + \; {\rm \alpha} _6z\left( {\displaystyle{I \over K}} \right)_{\rm it-1}^2 \cr & \quad + {\rm \alpha} _7z\left( {\displaystyle{{{\rm CF}} \over {\rm K}}} \right)_{{\rm it}-1} \, + \; {\rm \alpha} _8z\left( {\displaystyle{{\rm S} \over {\rm K}}} \right)_{{\rm it}-1} \, + \; {\rm \alpha} _9\left( {\displaystyle{{\rm X} \over K}} \right)_{{\rm it}} \, + \; {\rm d}_{\rm t} + {\rm \beta} _{\rm i} + {\rm v}_{{\rm it}}.} $$
We employ the generalised method of moments (GMM) estimator developed by Arellano and Bover (Reference Arellano and Bover1995) and Blundell and Bond (Reference Blundell and Bond1998), also referred to as the GMM-system estimator. Windmeijer (Reference Windmeijer2005) proposes a finite sample correction that provides more accurate estimates of the variance of the two-step GMM estimator (GMM-SYS). As the t-tests based on these corrected standard errors have been found to be more reliable, the paper estimates regression coefficients using a finite sample correction.
In addition, we impose an outlier rule by removing farms from the econometric estimation if their investment-to-capital ratio is above 99% in absolute terms (as in Benjamin and Phimister, Reference Benjamin and Phimister2002).
4. Data
Our analysis is based on Estonian, Hungarian and Slovenian individual farm-level data. These data are extracted from national Farm Accountancy Data Network (FADN) databases which provide homogeneous accounting data for farms throughout the EU. Only farms above a specific size threshold are included in the FADN, the threshold being two European Size Units (ESUs; one ESU is equivalent to 1,200 euros of gross margin). FADN implements a yearly survey of farm businesses that employ bookkeeping, with a rotating panel of about five years. It follows that our panel datasets are unbalanced. The time span of the unbalanced panel dataset used for the analysis is the period 2007–2015 for each of the three countries under analysis.
The variables that are used are available from the FADN database (European Commission, 2006). Gross investment on fixed assets is the FADN variable coded SE516 (‘gross investment’), defined as the difference between purchases and sales of fixed assets plus breeding livestock change of valuation (SE516 gross investment on fixed assets = purchases – sales of fixed assets + breeding livestock change of valuation), while SE521 net investment on fixed assets = gross investment on fixed assets – depreciation. The cash flow variable is the FADN variable coded SE526 (‘cash flow’), defined as the difference between the farm receipts and expenditure for the accounting year, not taking into account operations related to capital, debts and loans. The investment subsidy variable is the FADN variable coded SE406 (‘subsidies on investment’); such subsidies include subsidies on agricultural land, buildings, rights, forest land including standing timber, machinery and equipment, and circulating capital. The sale growth variable is proxied by the change in total output between two consecutive years; total output is the FADN variable coded SE131 (‘total output’), defined as the total of output of crops and crop products, livestock and livestock products and other output. Debt is defined as the sum of short-term (SE490) and long-term (SE495) loans. All the above-listed variables are related to capital, which is the FADN variable coded SE436 (‘total assets’), including fixed and current assets owned by the farm. The FADN variables are deflated by price indices, which are obtained from the national statistical offices of Estonia, Hungary and Slovenia.
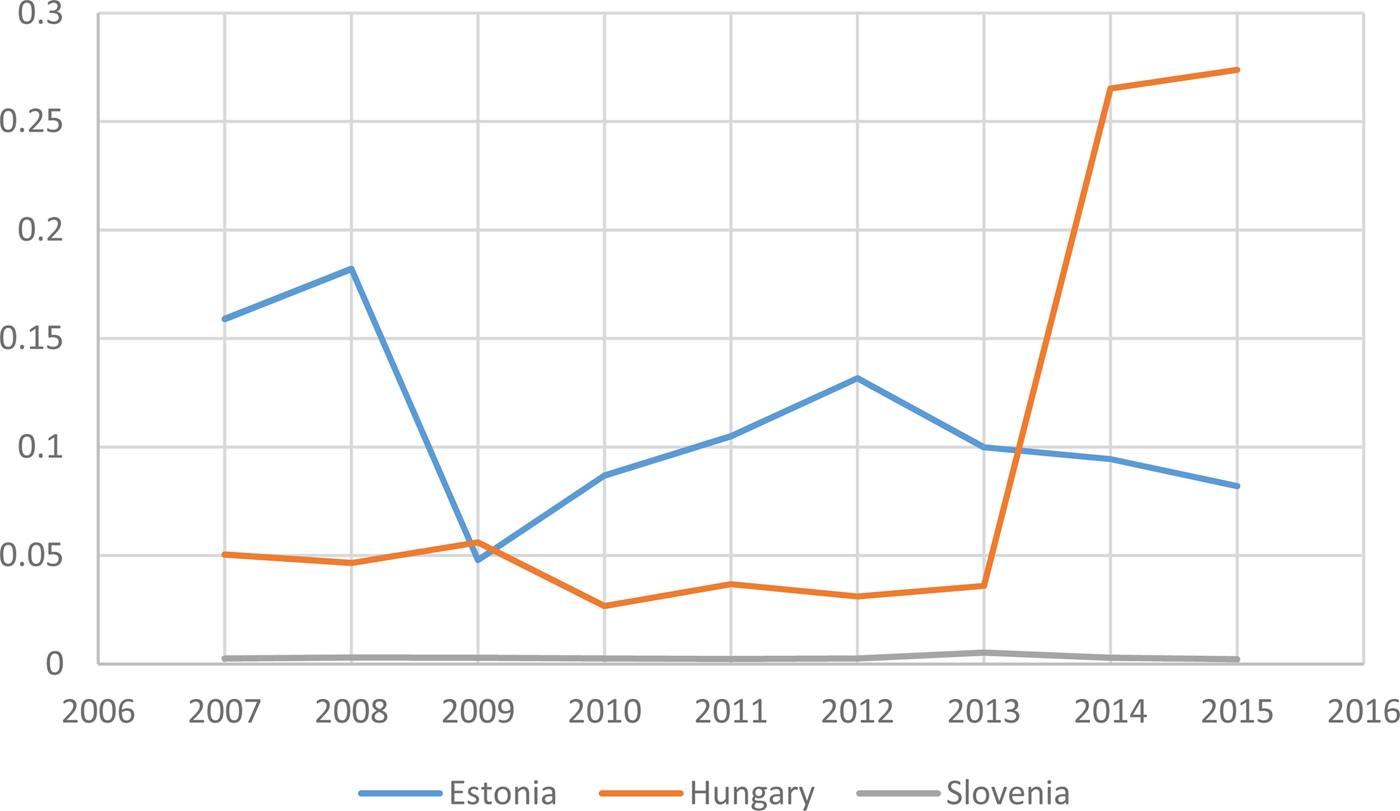
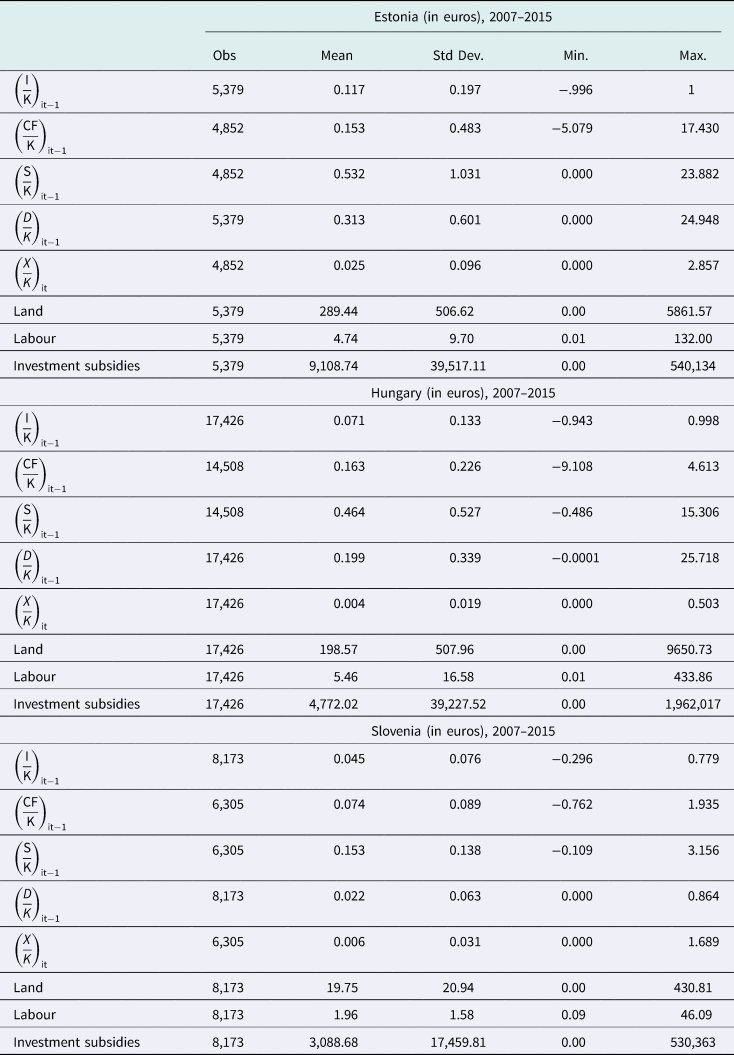
Table 1 presents descriptive statistics for the former data. Gross investment to capital is the highest for Estonian farms and the lowest for Slovenian farms, on average. The data show disinvestment by some farms in Estonia, Hungary and Slovenia. Dynamically over time, gross investment to capital has been rather stable at a lower level for Slovenian farms, but has undergone a cyclical pattern of development for Estonian farms, and increased rapidly for Hungarian farms since 2013 (Figure 1).
Mean of investment capital ratios, 2007–2015

Descriptive statistics (whole period averages)

Source: Authors’ calculations based on FADN data for Estonia, Hungary and Slovenia.
Growth in real sales to capital is highest for Estonian farms and lowest for Slovenian farms, on average. As for real cash flow to capital, this is highest for Estonian farms and lowest for Slovenian farms on average. Except for growth in real sales to capital in Estonia, growth in real sales to capital, and real cash flow to capital vary within the samples from negative to positive values in each of the three countries under analysis.
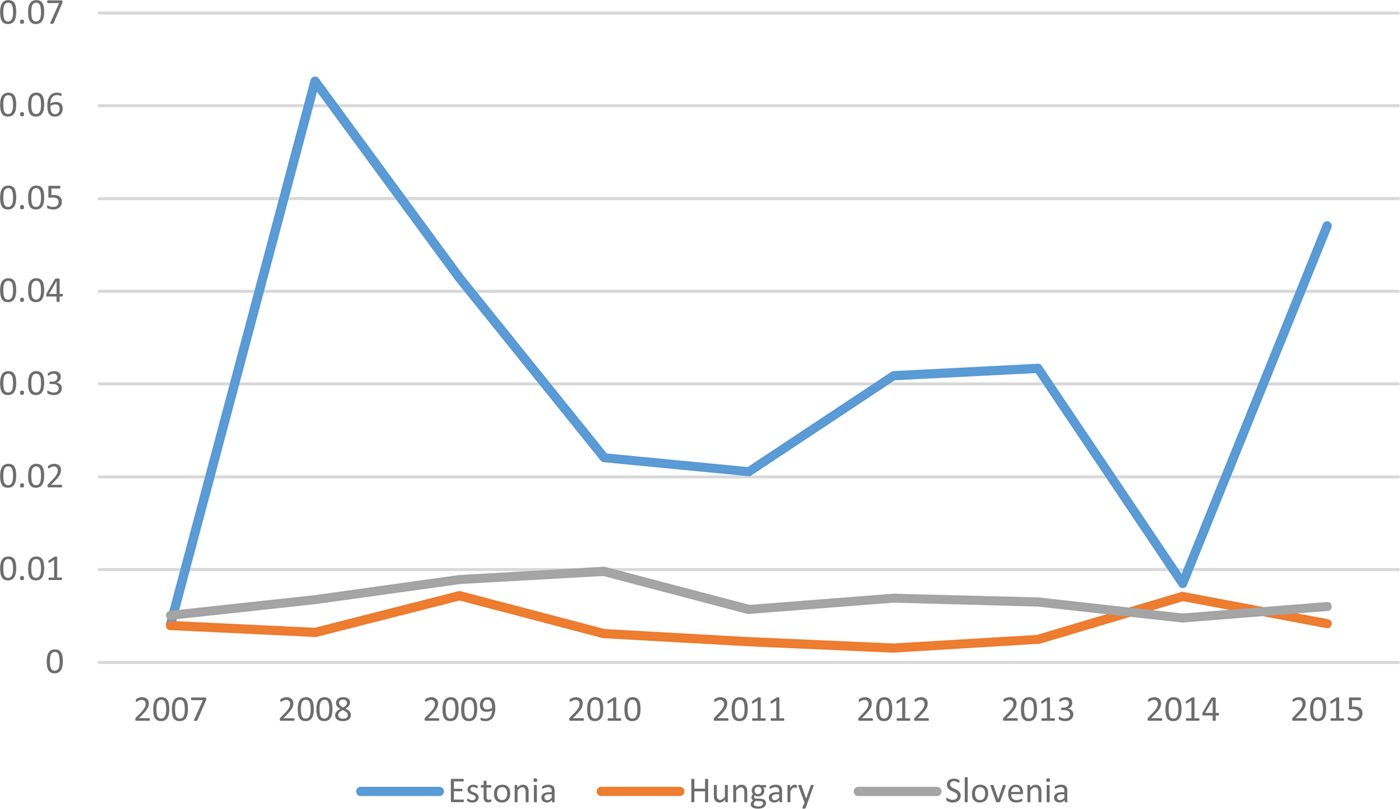
Public investment subsidy in period t–1 to capital is on average similar at a lower level for Hungarian and Slovenian farms, but slightly higher for Estonian farms. While the evolution in the development of public investment subsidies in period t–1 to capital has been rather stable for Hungarian and Slovenian farms, it has undergone substantial cyclical oscillations for Estonian farms (Figure 2).
Mean of investment subsidy capital ratios, 2007–2015

Debt is highest for Estonian and, to a lesser extent, Hungarian farms, and lowest for Slovenian farms.
Farm size (land area) is largest in Estonia, followed by Hungary, while farms in Slovenia are much smaller. The largest differentials in land farm size are found in Hungary and Estonia, but are much less common in Slovenia, as can be seen from the maximum values in land farm size.
The average number of full-time employees is the highest in Hungarian farms, followed by Estonian farms. The differential between these two countries can be explained by the farm types and different technology used therein, as well as the possible retention of labour in employment in Hungarian farms. Slovenian farms are on average much smaller, also according to average number of employees.
Finally, investment subsidies per farm are the highest in Estonia, followed by Hungary, which experiences the largest gap between minimum and maximum value of investment subsidy per farm. Interestingly, in spite of large differences in land farm size and average employment per farm, on average the size of investment subsidy per farm in Slovenia is closer to those found in Estonia and Hungary.
5. Econometric results
Econometric results are presented in two steps: first, we describe the dynamic panel model (GMM-SYS) estimation. Second, in the GMM-SYS estimations we include sample selection with comparisons of financially constrained and financially unconstrained farms.
GMM-SYS estimation
Our econometric results suggest that the current farm investments are significantly and positively associated with lagged farm investments, but the regression coefficients are less than one in absolute terms, a finding which is valid for each country in the analysis (Table 2).
Dynamic Panel Model (GMM-SYS) estimations

Note: Outlier farms are farms for which the investment-to-capital ratio is above 99% in absolute value. All explanatory variables except subsidy are divided by capital. Estimations include time and farming sectors fixed effects. N: number of observations. ***/**/*: statistically significant at the 1%, 5% and 10% levels, respectively.
The regression coefficient of the squared investment term is significantly positive for Estonian and significantly negative for Hungarian and Slovenian farms, but less than one in absolute terms for each of the countries’ model specifications. The small regression coefficients of the squared investment term for Estonian farms indicate that under unstable macroeconomic conditions (such as economic crisis, and Russian export embargo) farms use large discount rates in investment planning. These mixed results imply complexity in investment adjustment costs in relation to the size of investment.
Our estimations confirm the positive and significant association between gross farm investment and growth in real farm sales for each country, implying that the investment behaviour of farms is driven by the presence of competitive output market conditions and farms’ ability to sell output and invest in such a market environment. These results are in line with findings in previous studies from Hungary and Slovenia for both before (Bakucs et al., Reference Bakucs, Fertő and Fogarasi2009; Bojnec and Latruffe, Reference Bojnec and Latruffe2011) and during the early years following EU accession (Bojnec and Fertő, Reference Bojnec and Fertő2016; Fertő et al., Reference Fertő, Bakucs, Bojnec and Latruffe2017). Real farm sales may depend on the variety and the complexity of the organisational forms that exist in agri-food value chains (Martino et al., Reference Martino, Karantininis, Pascucci, Dries and Codron2017). One such organisational form is the agricultural cooperative which reduces the supervision- and monitoring-related transaction costs of family farms, which lack the ability to benefit from economies of scale and/or to develop market power in their upstream and downstream trading partner relations (Valentinov, Reference Valentinov2007).
Gross farm investment is negatively and significantly associated with cash flow for Estonian farms, confirming the presence of the strong version of SBCs when farms with poor financial performance can access bank loans more easily. Results are insignificant for Hungarian and Slovenian farms. Insignificant cash flow coefficients imply weak SBCs for Hungary and Slovenia when farms have access to credit for investment, irrespective of their profitability. Note that earlier studies find a positive and significant regression coefficient estimate for lagged cash flow for Hungary and Slovenia between 2004 and 2008, suggesting that the validity of SBCs should be rejected, but confirming strong financing–investment relationships across farms and therefore the presence of capital market imperfections (Bojnec and Fertő, Reference Bojnec and Fertő2016; Fertő et al., Reference Fertő, Bakucs, Bojnec and Latruffe2017).
The significantly positive regression coefficients of the squared debt variable suggest that investment and financing decisions cannot be separated in Slovenia as farms may rely on borrowing from (their own) family resources to finance investment (Bojnec and Latruffe, Reference Bojnec and Latruffe2011), thereby confirming findings from an earlier period about the underdeveloped capital markets in agriculture (Bojnec and Fertő, Reference Bojnec and Fertő2016; Fertő et al., Reference Fertő, Bakucs, Bojnec and Latruffe2017). The latter finding is similar to that of Bokusheva et al., (Reference Bokusheva, Bezlepkina and Lansink2009) and Zinych and Odening (Reference Zinych and Odening2009) for farm investment behaviour in Russian and Ukrainian agriculture, respectively. The significantly negative regression coefficients of the squared debt variable as an indicator of bankruptcy costs suggest that investment and financing decisions pertain to capital structure, the arrangement of which is dependent on financing through debt and/or the use of private (farm) cash in Estonia. As in an earlier study (Fertő et al., Reference Fertő, Bakucs, Bojnec and Latruffe2017), we find the insignificant regression coefficients of the squared debt variable to be close to zero, implying perfect capital markets in Hungary.
Finally, gross farm investment is found to be positively and significantly associated with public investment subsidies for each of the countries under analysis, confirming the findings of earlier research (Fertő et al., Reference Fertő, Bakucs, Bojnec and Latruffe2017). The regression coefficient is greater than one for Hungary and less than one for Slovenia and Estonia. Public investment subsidies can mitigate capital market imperfections in the short term. In the long run, a farm's ability to successfully compete in the output market by selling produce and securing a sufficient cash flow for investment is crucial.
GMM-SYS estimation with sample selection
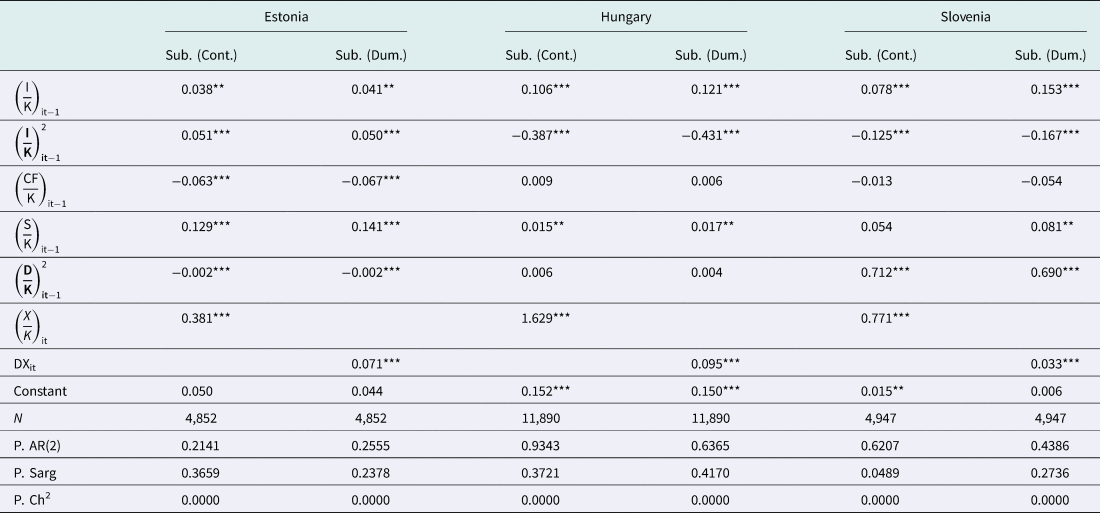
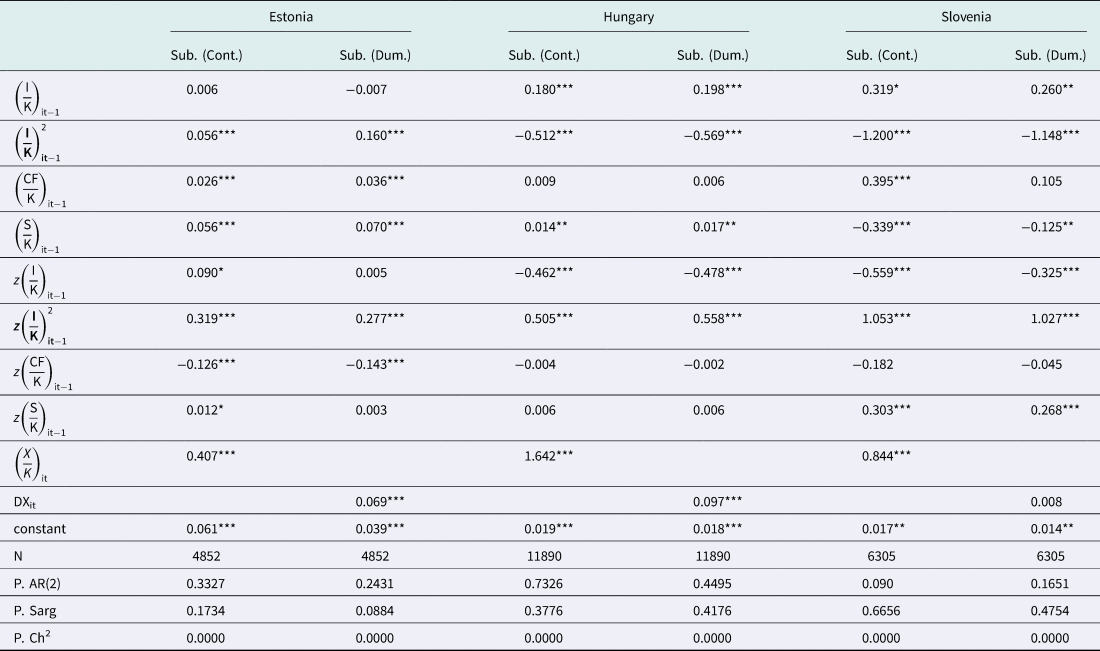
The general specification of the Euler investment equation does not account for different financial regimes that imply the unequal sensitivity of farm investment to financial restrictions. Now we turn to investigating the impact of an ex-ante sample separation into two financial regimes (Table 3). The first four coefficients relate to the subsample for which the basic Euler equation is expected to be valid even in the presence of market imperfections, while the remaining four coefficients estimate the difference between the coefficients for each variable across the two subsamples.

We find significantly positive regression coefficients for the cash flow variable in Estonia and Slovenia with continuous subsidy specification, while the regression coefficients of cash flow are insignificant for Hungary in the unconstrained sample. The positive and significant relationship in Estonia, and partly in Slovenia, contradicts the hypothesis that financial constraints are absent from this group and hence investment decisions are independent of the availability of internal funds. Even more striking is the negative cash flow regression coefficient for the constrained subsample in Estonia, similarly to Ukrainian farms (Zinych and Odening, Reference Zinych and Odening2009). In addition, regression coefficients for cash flow are insignificant in Hungary and Slovenia. The latter econometric results do not support the rejection of the validity of strong SBCs for Estonian farms and weak SBCs for Hungarian and Slovenian farms.
How can we explain these mixed results? First, one should note that farms in the a priori constrained group have lower investment-to-capital rates than those in the unconstrained group in Estonia (0.05 and 0.14), and to a lesser extent in Slovenia (0.04 and 0.06) and Hungary (0.05 and 0.07). In the presence of investment subsidies, relatively small amounts of credit are probably required for investment expenditure, and the role of cash flow as a proxy for net worth (collateral) is questionable. Thus cash flow may not play a crucial role in investment decisions in any country.
In contrast, a priori unconstrained farms invest more on average, especially in Estonia, and therefore require additional capital volume for growth. In addition, the volume of subsidies is similar in Estonia in both subsamples. Hubbard (Reference Hubbard1998) points out that if capital demand can be covered by debt capital, the availability of internal finance is required. In addition, a low proportion of subsidies cannot compensate for financial constraints. Hence, the role of cash flow is significant at a higher level for the unconstrained subsample, which is expressed in terms of a positive cash flow regression coefficient in the investment equation. In contrast, the insignificant cash flow regression coefficients in Hungary, implying SBCs, can be explained by the relatively lower level investment rate with a higher level of subsidies. We find mixed results for Slovenia with strongly positive and insignificant cash flow estimates.
Regarding other control variables, we observe considerable differences between the two subsamples in each country. Current farm investment is significantly and positively associated with lagged farm investment for Hungary and Slovenia for the unconstrained sample, but significantly and negatively associated with lagged farm investment for financially constrained farms. The regression coefficients for Hungary and Slovenia remain less than one in absolute terms. For Estonia, the regression coefficients are largely insignificant, except with unconstrained farms with continuous subsidy specification.
The regression coefficients of the squared investment term are significantly positive for Estonian financially constrained and unconstrained farms, significantly negative for financially constrained farms, and significantly positive for financially unconstrained farms in Hungary and Slovenia. The regression coefficients for Slovenian farms are greater than one in absolute terms, implying adjustment costs that are increasing and convex relative to the size of investment.
In general, our estimations confirm the positive and mostly significant association between gross farm investment and growth in real farm sales for financially unconstrained farms in Estonia and Hungary, confirming that the investment behaviour of farms is driven by the presence of perfect competitive output market conditions and farm ability to sell output and invest in such a market environment. There is a considerable difference in the sign of the regression coefficient between financially constrained and unconstrained farms in Slovenia, while findings are similar for Estonia in both subsamples.
Gross farm investment remains– except for Slovenian farms with a dummy – positively and mostly significantly associated with public investment subsidies for each of the analysed countries. Investment subsidies provide the incentive for investing in farm restructuring, farm modernisation activities such as purchasing advanced machinery and equipment, and farm growth. This implies that investment subsidies are important for farm investment decisions as they can mitigate some capital market imperfections such as interest rate volatility. The regression coefficient remains greater than one only for Hungary, and less than one for Slovenia and Estonia.
In summary, similarly to Rizov (Reference Rizov2004), Bokusheva et al., (Reference Bokusheva, Bezlepkina and Lansink2009) and Zinych and Odening (Reference Zinych and Odening2009), our estimations suggest that there are significant differences in the investment behaviour of subsamples of farms that are classified according to their financial status in each of the three countries under analysis.
6. Conclusion
This paper contributes to Kornai's SBC theory in the framework of new institutional economics by investigating agricultural SBCs in new EU member states. From an investigation of farmers’ investment behaviour in Estonia, Hungary and Slovenia, which uses the Euler equation model, we find evidence of strong SBCs in Estonian farms and weak SBCs in Hungarian and Slovenian farms during the period following the EU accession period, the financial crisis and the most recent CAP reforms. The reasons why differences across countries exist can be explained by the historical-institutional legacies of income redistribution in agriculture towards large farms in Estonia, the trade-off between emerging small-scale family and large-scale farms in Hungary, and the existence of small-scale family farms in Slovenia that lack the organisational structure and institutional framework for more efficiently integrating into food supply chains, but for whom investment to a greater extent relies on private family resources in underdeveloped capital markets for agriculture. SBCs are more likely to persist in an enabling environment dominated by larger corporate and cooperative farms that have been privatised and/or transformed from former state and collective farms (e.g. in Estonia and Hungary) than smaller family farms (e.g. in Slovenia). These differences in SBCs across the countries under study are predictable due to the greater lobbying and administration capacity of larger farms vis-à-vis smaller family farms.
Gross farm investment is positively associated with growth in real farm sales, particularly in Estonia, suggesting that farm investment decisions are based on market conditions. The ability to sell farm products in competitive markets is crucial for farm investment and farm survival.
Gross farm investment is positively associated with public investment subsidies. Public programmes that support farm investment with subsidies appear to be successful at enhancing investment in these countries in the short term. However, farm investment behaviour pertaining to investment subsidies is more conservative in the long term. This implies that investment subsidies can mitigate some capital market imperfections such as interest rate volatility, but that in the long term what is crucial is farm competitiveness and farm ability to compete successfully on the output market: i.e. making sales and creating sufficient cash flow to enable investment and thus ensure competitive survival and farm growth. In the long term, improving farm profitability can play an important role in the vertical integration of farms into the agri-food value chain (Grau and Reig, Reference Grau and Reig2015).
We also show that a version of the estimated model that takes account of differential financial status across financially constrained and financially unconstrained farms is able to confirm the heterogeneity of farm investment decisions. The differences in farm investment behaviour between the subsamples and across the three countries confirm the unequal sensitivity of farm investments to financial restrictions. Therefore, among the issues recommended for further research is that of SBCs and the financial constraints across different farming structures such as farm size, ownership and management structures, and among different farm types or farming sectors such as dairy, crop and mixed farming, among others.
The fact of major state intervention in the agriculture of developed countries is well known. In the EU, for example, the cost of the CAP amounts to about half of the EU budget. During the period under study, Estonian, Hungarian and Slovenian farmers were able to benefit from investment subsidies provided through CAP. Whilst previous studies found financial constraints in Hungary and Slovenia for the early years of the EU accession (Bakucs et al., Reference Bakucs, Fertő and Fogarasi2009; Bojnec and Fertő, Reference Bojnec and Fertő2016; Fertő et al., Reference Fertő, Bakucs, Bojnec and Latruffe2017), our paper provides evidence of strong SBCs for Estonian farms and weak SBCs for Hungarian and Slovenian farms. Our results highlight the role of the state in shaping farm investment behaviour and the farming structure of the three countries. Therefore, SBCs for CEE agriculture may persist after full adoption of CAP. State subsidies in agriculture help farms to cover their investment costs in the short term and therefore contribute to their survival. But, in contrast to the situation with SBCs, investment subsidies in the period that we studied were not freely provided to farms: farmers needed to supplement their subsidy applications with a detailed business plan, and usually obtained only a specific share of subsidies (generally, half) to cover investment costs. While state subsidisation of farm investment may be partly justified (the production of food is of crucial importance to countries; farms help maintain economic activity in isolated areas; subsidies can incentivise farmers to create positive environment externalities), it is nevertheless costly for taxpayers. Further research could therefore investigate whether less costly subsidisation alternatives are possible, such as zero-interest loans from the state. The potential role of different micro-financial institutions for small-scale farms and banking institutions may also be significant.