




No CrossRef data available.
Article contents
Parasite communities as indicators of recovery from pollution: parasites of roach (Rutilus rutilus) and perch (Perca fluviatilis) in Central Finland
Published online by Cambridge University Press: 10 November 2003
Abstract
We compared parasite communities in fish taken from a polluted lake (L. Vatia) and two control lakes before (1986) and after (1995) nine years of markedly reduced chemical and nutrient loading from a pulpmill in central Finland. Discriminant analyses of the 1995 data, using a function based on the 1986 data, showed that the parasite communities in the fish from the two control lakes had changed relatively little, whereas those from L. Vatia had converged on those from the mesotrophic control lake, indicating substantial recovery from the effects of pollution. Only a few species of parasites provided evidence for recovery. These were anodontid glochidia, which had increased markedly in perch, Rhipidocotyle fennica in roach and R. campanula in both fish species. This suggests that the recovery of the polluted lake involved increased populations of anadontid clams in shallow waters. On the other side decrease of Dermocystidium percae on perch fins and Ichthyophthirius multifiliis on roach indicate increased immune responses in the fish, reflecting better water quality. Other parts of the system have apparently not yet recovered.
Information
- Type
- Research Article
- Information
- Copyright
- © 2003 Cambridge University Press
INTRODUCTION
Chemical pollution has had serious effects on aquatic ecosystems over the past 50 or more years. Societal pressures have led industry and governments to minimize the release of toxins into the environment, and even to institute recovery programmes. In central Finland, as in many other places in the world, much of the chemical pollution has involved organochlorines released by pulp and paper mills. In Finland, improved technology over the past 20 years has markedly reduced loadings of both organochlorines and nutrients from these mills, despite several-fold increases in production (Granberg, 1996; Kaplin, Hemming & Holmbom, 1997; Rantio, 1997). Current obligate monitoring systems in Finland evaluate water quality, primary productivity, benthic and planktonic communities, and fish populations; they are very time-consuming and expensive. We are evaluating the usefulness of data on parasite communities in freshwater fishes as a cheaper, but informative monitoring system.
To be valuable as a monitoring system parasite communities should respond to changes occurring in as many parts of the aquatic system as possible, should be easy and cheap to perform and should pinpoint where recovery (or damage) is occurring, and where it is not. Parasite communities can reflect changes in the population dynamics of the definitive hosts, the population dynamics of a variety of invertebrate hosts or the direct effects of chemicals on both the free-living stages of the parasites and the immune systems of the vertebrate hosts (see reviews in Khan & Thulin, 1991; Valtonen, Holmes & Koskivaara, 1997).
Valtonen et al. (1997) (henceforth abbreviated VHK) showed that the extensive parasite communities in freshwater fishes (roach, Rutilus rutilus, and perch, Perca fluviatilis) in central Finland can be good indicators of pollution. Some species of parasites were markedly increased while others decreased in the most polluted waters. Consequently, community-level analyses, particularly discriminant function analyses, were the most revealing. Characteristics (such as the life cycle) of individual indicator species suggested mechanisms and identified those parts of the ecosystem that were particularly impacted. VHK also showed that monitoring several of the indicator species could detect significant changes after several years of reduced pollutant loading but did not have the data to use the community-level analyses.
Here, we report on a more extensive follow-up study of the same system, focusing particularly on the community-level analyses. We demonstrate that the parasite communities can be sensitive indicators of the extent of recovery and can pinpoint those parts of the system that are, and those that are not, recovering.
MATERIALS AND METHODS
Study Area
We investigated parasite communities in roach and perch in three of the lakes studied by VHK (Fig. 1). Our monitoring efforts were focused on Lake Vatia, the lake most affected by chemical pollution and eutrophication from the pulp mills at Aänekoski, 15 km upstream. Natural variation in the system was monitored in two lakes. Lake Peurunka (oligotrophic, unpolluted) flows into L. Vatia, and has been unaffected by changes in effluent loading from the mills. The northern part of Lake Saravesi receives water from L. Vatia, is mesotrophic and has been moderately affected by pollution. Communities of parasites in this lake were indistinguishable (discriminant function analysis, VHK) from those in the downstream Lake Leppävesi; it is used as the mesotrophic control lake.

Fig. 1. The study area in central Finland. The three study lakes Peurunka, Vatia and Saravesi are shown and their connections to other parts of the chain of lakes and obstacles to fish migration.
Chemical emissions from the mills were high through the early 1980s, then decreased markedly after 1985; solids and nutrient loading decreased less rapidly (Fig. 2). A high proportion of the solids and most of the organochlorines sedimented out above (and in) Lake Vatia (Maatela et al. 1990); some of this material is resuspended whenever water currents in the rapids above the lake reach 84 m3/sec (Pohjonen, 1989); these conditions occur frequently during spring flooding (Kai Granberg, personal communications). Construction of a channel bypassing rapids between L. Vatia and L. Saravesi in 1994 also resulted in significant resuspension that year (Fig. 2; best seen in the solids data).

Fig. 2. Production of pulp and amount of effluents from the Äänekoski mill. Data from the Environmental Protection Division, Metsä-Sellu Oy. Legends: BOD7, biological oxygen demand; P, total phosphorous; AOX, adsorbable organic halogens, production is pulp produced in tons per year.
VHK's samples were taken in 1986, and reflected the pollution from the previously high emission rates. Our samples are from 1995 and reflect the lower emission rates (and resuspension rates) of the intervening 9 years.
Sampling and examination of fish
In 1995, 15 adult roach and 15 adult perch were collected from each lake each month (bimonthly during the period of ice-cover), as in VHK; a total of 257 roach and 261 perch were examined. Each fish was examined by the methods of VHK, except that the musculature was not examined, the kidneys were not examined for protozoans, nor were the fins examined for Neoergasilus japonicus. The gills were examined in toto for large parasites, but only a single scrape sample was examined for small monogeneans; as a result, data on dactylogyrids on roach were not comparable to those of VHK, and are thus not used.
Data presented here for 1986 are limited to those species recoverable by the methods used in 1995; prevalence data have been presented in VHK and are presented here for ease of comparison. In this paper, we use intensity data (parasites per infected fish), rather than the abundance data (parasites per examined fish) used in VHK.
Analyses
Infracommunity and component community measures are those used by VHK; data for 1986 were recalculated, omitting species not covered by the examinations in 1995. Differences in prevalence were tested by the maximum likelihood G-test, differences in other measures by the Kruskal-Wallis non-parametric analysis of variance, using programs in Systat (Wilkinson, 1990). Unless otherwise stated, significance was at the 5% level, using Bonferroni corrections for multiple testing.
Discriminant function analyses were calculated on transformed intensity data [ln(x+1)] using the programs in BMDP. Analyses were done on the recalculated 1986 data, the 1995 data, and once more on the 1995 data, using the discriminant function calculated from the 1986 data.
RESULTS
Overall, only 23 parasite species were found in roach in 1995, compared with 31 in 1986; all species found in 1986 were also present in at least some of the lakes in 1995 (Table 1). In perch, 31 species were found in 1995, compared with 34 species in 1986; one species present in 1995 (Dactylogyrus sp.) was not present in 1986 (Table 2). Eleven of the 15 species present in only one year were rare (prevalence in any lake less than 10%), the others had maximum prevalences of less than 20%.


The total number of parasite species found in each host in each lake also decreased from 1986 to 1995 (Table 3), although in each lake, species not found in 1986 were found in 1995 (Tables 1 and 2). Despite this reduction in total numbers of species found, mean numbers of species per fish increased in 1995 in L. Vatia in both roach and perch, and did not change in the other two lakes (or dropped, in roach from L. Peurunka; Table 3). There was a significant increase in total numbers of parasites per fish in both roach and perch in L. Vatia, and in L. Saravesi, whereas in L. Peurunka, numbers in roach decreased and there was no change in numbers in perch (Table 3). Mean diversities decreased significantly in roach in L. Vatia, but did not differ elsewhere.
Discriminant function analyses on the revised data sets for 1986 correctly classified 87% of the roach and 82% of the perch (91% and 96% of the fish from L. Vatia) (Table 4). Discriminant analyses of the 1995 data also correctly classified a high proportion of the fish (88% of the roach, 87% of the perch; 86% and 87% of those from L. Vatia) (not shown). Species included in the discriminant functions for these two years overlapped broadly, but with different rankings; in addition, some species differed (Table 5). In each year, therefore, the parasite communities in each fish species clearly differed among lakes, but the distinguishing parasites differed somewhat.


Discriminant analyses of the 1995 data using the discriminant functions from the 1986 data correctly classified only 58% of the roach and 69% of the perch; fish from lakes Peurunka and Saravesi were correctly classified at about the same percentages as in 1986, whereas only 1% of the roach and 52% of the perch from Lake Vatia were correctly classified (Table 4). Individual fish from lakes Vatia and Saravesi formed a single cloud of points, almost entirely within the range predicted by the 1986 analysis for L. Saravesi (roach) or spanning the predicted ranges from both lakes (perch), and quite distinct from the fish from L. Peurunka (not shown). Centroids of the data for both years from fish from lakes Peurunka and Saravesi were fairly close together and within the ranges predicted for those lakes by the 1986 data; however, centroids for the 1995 data from fish from L. Vatia were within the area predicted for L. Saravesi, well within data from roach, just inside data from perch (Fig. 3). Thus, in terms of the parasites that most clearly distinguished the polluted lake, L. Vatia had, by 1995, converged toward the mesotrophic control lake, whereas the other lakes had remained fairly stable.

Fig. 3. Locations of group centroids of parasite infracommunities in roach and perch from three lakes in Central Finland in 1986 and 1995. Lines separate areas classified by maximum likelihood as L. Peurunka (P), L. Vatia (V) or L. Saravesi (S), based on discriminant function analyses of parasites from fish from 1986. Centroids labelled 95 are for 1995 data analysed by the 1986 discriminant function.
The most obvious changes in the parasites in L. Vatia were the marked increases in anadontid glochidia and in the two species of Rhipidocotyle (Tables 1 and 2). These parasites (prevalence and intensity of R. fennica in roach and of anadontid glochidia in perch, prevalence of R. campanula in both roach and perch) were significantly lower in L. Vatia than in L. Saravesi in 1986, but not in 1995 (Tables 1 and 2).
Other notable changes (all in perch) were the increases in prevalence and intensity of I. variegatus and in prevalences of T. clavata and C. lacustris, and the decreases in prevalences of A. lucii and E. sieboldi. All (except T. clavata and E. sieboldi) differed significantly between lakes Vatia and Saravesi in 1986, but not in 1995.
DISCUSSION
The data, especially those from the discriminant function analyses, suggest that the communities of parasites in roach and perch from lakes Peurunka and Saravesi changed relatively little between 1986 and 1995, but that those from Lake Vatia changed considerably, and converged with those from fish from Lake Saravesi. Given that all evidence indicates that Lake Saravesi is much less affected by pollutants (see review in VHK), this pattern indicates that the marked reductions in organochlorine and nutrient emissions over the intervening 9 years has resulted in considerable recovery from the effects of pollution in Lake Vatia.
We do not intend to imply that there were no changes in the parasite communities in the two control lakes. In each lake, some of the less common parasites occurred in only one year, and there were significant differences in prevalence or intensity of some of the more common species. Temporal variation does occur. In some cases (such as the apparent disappearance of some species, the increases in metacercariae of Rhipidocotyle spp. in roach, and the increases in intensity of I. variegatus or prevalence of Apiosoma spp. in perch) this variation was consistent across lakes and appeared to reflect some feature that affected the entire system. In other cases, there was significant variation only in one of the control lakes (as in the intensity of T. clavata in roach), or changes were in different directions in the two control lakes (as in T. clavata in perch). These changes appeared to reflect the random variation seen in other systems (Janovy & Hardin, 1988; Kennedy, 1993).
However, in the control lakes, temporal variation was not sufficient to markedly shift their centroids when the 1986 discriminant function was applied to data sets from both years. In contrast, changes in L. Vatia were adequate to shift the 1995 centroid, reflecting much more extensive and pervasive changes.
In 1986, fish from L. Vatia were characterized by markedly lower numbers of glochidia and trematodes than in fish from the other lakes (details in VHK). Roach from L. Vatia were also characterized by higher numbers of dactylogyrids, whereas perch were characterized by higher numbers of D. percae and A. lucii and lower numbers of cestodes and A. percarum.
The most obvious changes in the parasites of fish from L. Vatia in 1995 involved marked increases in anodontid glochidia and the two species of Rhipidocotyle, which use Anodonta piscinalis as first intermediate hosts (Taskinen, Valtonen & Gibson, 1991). All three had shown increases in prevalence in roach, but not perch, in 1994 (Valtonen et al. 1997). Anodonta piscinalis is located primarily in shallow, vegetated littoral areas (Haukioja & Hakala, 1974; Taskinen, 1992; Saarinen & Taskinen, 2003), is known to concentrate organic pollutants (Herve, Paasivirta & Heinonen, 2001), and were absent, or at very low levels of abundance, in L. Vatia in 1986 (J. Taskinen, U. Jyväskylä, personal communication). The recovery of these three parasites to levels indistinguishable from those in L. Saravesi is undoubtedly due to recovery of the anodontid population in L. Vatia.
Metacercariae of Ichthyocotylurus variegatus in perch also increased significantly in 1995 (and in prevalence in 1994, VHK). There was an apparent system-wide increase in this species, but the increase in L. Vatia was markedly greater, to levels indistinguishable from those in the other two lakes. Valvata piscinalis, the first intermediate host of I. variegatus (Bell, Sommerville & Gibson, 1999) did not occur in lake Vatia in the 1980s although it was common in nearby lakes of the same water system (Hynynen, 1987). There was also an increase in the prevalence of T. clavata metacercariae in perch (but not in roach) in L. Vatia; this was not seen in the 1994 data of VHK. These changes could indicate an increase in the populations of Valvata and other snails, but the system-wide pattern for I. variegatus, or the inconsistent pattern for T. clavata, make any such conclusion problematic. Note that there were no significant increases in numbers of any of the other trematodes.
The prevalence of D. percae in perch in L. Vatia also decreased to a level equivalent to that in L. Saravesi and prevalences of I. multifiliis in roach decreased in both lakes. Changes in the protozoans may indicate improved immune function in the fish due to lower concentrations of organochlorines, and perhaps other chemicals, in the effluents (cf. Lehtinen, 1989; Khan et al. 1994). Jokinen, Aaltonen & Valtonen (1995) showed that serum immunoglobulin levels of roach originating from L. Peurunka decreased when fish were transferred to L. Vatia and that the peak response of fish immunized against bovine gamma globulin was lower in the fish transferred to L. Vatia than in those kept in L. Peurunka. In addition, Aaltonen, Valtonen & Jokinen (1997) showed that roach exposed to bleached pulp and paper mill effluents (BKME) in the laboratory had decreased numbers of immunoglobulin-secreting cells in the spleen compared to control fish and that the antigen-specific response of bovine gamma globulin-immunized roach exposed to BKME was significantly lower than that in control fish. Interestingly, Aaltonen et al. (1997) also showed that the immunosuppression caused by BKME was reversible when fish were transferred back to clean water. In retrospect, it is unfortunate that our methods did not allow us to compare levels of infection with dactylogyrids in roach, for which there is the most convincing evidence of the importance of an impaired immune response in L. Vatia in 1986 (see Bagge & Valtonen, 1996 and Siddall, Koskivaara & Valtonen, 1997).
Our results suggest, therefore, that the decreased toxicant loadings in effluents since 1986 have allowed some recovery in L. Vatia. This recovery has involved general water quality (the improved immune responses, and perhaps the presence of the copepod A. percarum in perch – see Anikieva, 1982) and an increase in population of anadontid clams, and perhaps some other molluscs in shallow, inshore waters. However, the continued paucity of trematodes indicates that populations of most molluscs have not recovered as yet.
The clearest evidence for recovery is the convergence of the parasite communities in fish in L. Vatia with those in fish from L. Saravesi when the 1995 data are examined using the 1986 discriminant functions. The strong convergence in roach suggests that further use of the 1986 function with data from roach may not be instructive, although the 1986 function may still be useful in assaying further recovery in perch. However, 1995 functions still separate fish from these two lakes; further recovery may be tracked using these functions.
In addition, it is clear that the additional information provided by careful examinations of gills for dactylogyrids (in roach) would justify the added expense. In roach, dactylogyrids were the main positive indicator of adverse effects from pollution, which has been shown to be due to an impaired immune response (references above). Monitoring dactylogyrids might be an inexpensive way to monitor the status of the immune response in roach.
ACKNOWLEDGEMENTS
We thank Dr K. Granberg for help with background material, and Environmental Protection Division, Metsä-Sellu Oy, for data on effluent loadings. The project has been financed by the Finnish Academy of Science, Board of Environmental Sciences, including grants to JCH to work in Finland. JCH is also supported by NSERC Canada.
References
REFERENCES
AALTONEN, T.,
VALTONEN, E. T. &
JOKINEN, E. I.
(1997).
Immunoreactivity of roach, Rutilus rutilus, following laboratory exposure to bleached pulp and paper mill effluents. Ecotoxicology and Environmental Safety 38, 266–271.CrossRefGoogle Scholar
ANIKIEVA, L. V.
(1982). The use of helminthological data for estimating the state of water reservoirs. In
Ekologia parasitichesich organizmore v biogeoconozach severa, pp. 78–83.
Nauka,
Petrozavodsk. (In Russian.)
BAGGE, A. &
VALTONEN, E. T.
(1996).
Experimental study on the influence of water pollution on the gill parasite communities of roach (Rutilus rutilus).
Parasitology
112, 499–508.CrossRefGoogle Scholar
BELL, A. S.,
SOMMERVILLE, C. &
GIBSON, D. I.
(1999).
Cercarial emergence of Ichthyocotylurus (Strigeidae): contrasting responses to light[ratio ]dark cycling.
Parasitological Research
85, 387–392.CrossRefGoogle Scholar
GRANBERG, K.
(1996).
Finns beating forest industry pollution.
European Water and Environment.
Autumn, 1996.
HAUKIOJA, E. &
HAKALA, T.
(1974).
Vertical distribution of freshwater mussels (Pelecypoda, Unionidae) in Southwestern Finland.
Annales Zoologici Fennici
11, 127–130.Google Scholar
HERVE, S.,
PAASIVIRTA, J. &
HEINONEN, P.
(2001).
Trends of organochlorine compounds in Finnish inland waters, results of mussel incubation monitoring 1984–1998. ESPR-Environment Science Pollution Research 8, 19–26.CrossRefGoogle Scholar
HYNYNEN, J.
(1987).
Snails and small mussels (Sphaeriidae) of Lake Päijänne and some adjacent lakes.
Research Reports of the Hydrobiological Research Centre, University of Jyväskylä
10, 115–118.Google Scholar
JANOVY, J. Jr &
HARDIN, E. L.
(1988).
Diversity of the parasite assemblage of Fundulus zebrinus in the Platte River of Nebraska.
Journal of Parasitology
74, 207–213.CrossRefGoogle Scholar
JOKINEN, E. I.,
AALTONEN, T. &
VALTONEN, E. T.
(1995).
Subchronic effects of pulp and paper mill effluents on the immunoglobulin synthesis of roach Rutilus rutilus.
Ecotoxicology and Environmental Safety
32, 219–225.CrossRefGoogle Scholar
KAPLIN, C.,
HEMMING, J. &
HOLMBOM, B.
(1997).
Improved water quality by process renewal in pulp and paper mill.
Boreal Environment Research
2, 239–246.Google Scholar
KENNEDY, C. R.
(1993).
The dynamics of intestinal helminth communities in eels Anguilla anguilla in a small stream: long-term changes in richness and structure.
Parasitology
107, 71–78.CrossRefGoogle Scholar
KHAN, R. A.,
BARKER, D. E.,
WILLIAMS-RYAN, K. &
HOOPER, R. G.
(1994).
Influence of crude oil and pulp and paper mill effluent on mixed infections of Trichodina cottidarum and T. saintjohnsi (Ciliophora) parasitizing Myoxocephalus octodecemspinosus and M. scorpius. Canadian Journal of Zoology
72, 247–251.Google Scholar
KHAN, R. A. &
THULIN, J.
(1991).
Influence of pollution on parasites of aquatic animals.
Advances in Parasitology
30, 201–238.CrossRefGoogle Scholar
LEHTINEN, K.-J.
(1989).
Survival, growth and disease of three-pined stickleback, Gasterosteus aculeatus L., brood exposed to bleached kraft mill effluents (BKME) in mesocosms.
Annales Zoologica Fennica
26, 133–144.Google Scholar
MAATELA, J.,
PAASIVIRTA, J.,
SÄRKKÄ, J. &
PAUKKU, R.
(1990).
Organic chlorine compounds in lake sediments. II. Organically bound chlorine.
Chemosphere
21, 1343–1354.Google Scholar
POHJONEN, M.
(1989).
Dynamics of solids and nutrients in Äänekoski water system polluted by pulp and paper mill effluents. MSc thesis, University of Helsinki, Department of Limnology (in Finnish).
RANTIO, T.
(1997).
Chlorohydrocarbons in pulp mill effluents and their fate in environment. Research Report 57, Department of Chemistry, University of Jyväskylä.
SAARINEN, M. &
TASKINEN, J.
(2003).
Burrowing and crawling behaviour of three species of Unionidea in Finland.
Journal of Molluscan Studies
69, 81–86.CrossRefGoogle Scholar
SIDDALL, R.,
KOSKIVAARA, M. &
VALTONEN, E. T.
(1997).
Dactylogyrus (Monogenea) infections on the gills of roach (Rutilus rutilus) experimentally exposed to pulp and paper mill effluent.
Parasitology
114, 439–446.CrossRefGoogle Scholar
SOKAL, R. R. &
ROHLF, F. J.
(1995).
Biometry: The Principles and Practice of Statistics in Biological Systems.
New York,
W.H. Freeman and Co.
TASKINEN, J.
(1992).
On the ecology of two Rhipidocotyle species (Digenea: Bucephalidae) from two Finnish lakes.
Biological Research Reports from the University of Jyväskylä
27, 1–31.Google Scholar
TASKINEN, J.,
VALTONEN, E. T. &
GIBSON, D. I.
(1991).
Studies on bucephalid digeneans parasitising molluscs and fishes in Finland. I. Ecological data and experimental studies.
Systematic Parasitology
19, 81–94.Google Scholar
WILKINSON, L.
(1990). SYSTAT: The system for statistics.
Evanston,
IL, Systat Inc.
VALTONEN, E. T.,
HOLMES, J. C. &
KOSKIVAARA, M.
(1997).
Eutrophication, pollution and fragmentation: effects on parasite communities in roach (Rutilus rutilus) and perch (Perca fluviatilis) in four lakes in central Finland.
Canadian Journal of Fisheries and Aquatic Science
54, 572–585.CrossRefGoogle Scholar

Fig. 1. The study area in central Finland. The three study lakes Peurunka, Vatia and Saravesi are shown and their connections to other parts of the chain of lakes and obstacles to fish migration.
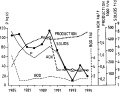
Fig. 2. Production of pulp and amount of effluents from the Äänekoski mill. Data from the Environmental Protection Division, Metsä-Sellu Oy. Legends: BOD7, biological oxygen demand; P, total phosphorous; AOX, adsorbable organic halogens, production is pulp produced in tons per year.

Table 1. Parasites of roach from three lakes in Central Finland, 1986 and 1995. Data from 1995 in bold are significantly different from 1986 data, data from L. Vatia in italics are significantly different from data from L. Saravesi (P<0·05 with Bonferroni correction). Number of fish studied see, Table 3

Table 2. Parasites of perch from three lakes in Central Finland, 1986 and 1995. Data from 1995 in bold are significantly different from 1986 data, data from L. Vatia in italics are significantly different from data from L. Saravesi (P<0·05 with Bonferroni correction). Number of fish studied, see Table 3

Table 3. Data on communities of parasites in roach and perch from three lakes in Central Finland, 1986 and 1995. Data from 1995 in bold are significantly different from 1986 data, data from L. Vatia in italics are significantly different from data from L. Saravesi (P<0·05 with Bonferroni correction)

Table 4. Classification of individual fish by the discriminant function based on 1986 data. Classified distributions of the 1995 fish shown in bold are significantly different (G-test for homogeneity, Sokal & Rohlf, 1995) from 1986 distributions (P<0·01)
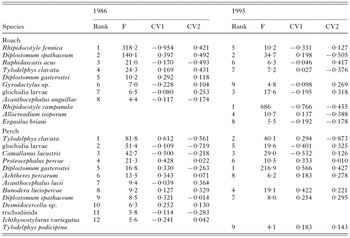
Table 5. Discriminating parasites and their coefficients for the first two canonical discriminant variables (CV1, CV2) that separate roach or perch from three lakes in Central Finland. Variables are ranked in order of addition by the stepwise analysis run on log-transformed intensity data
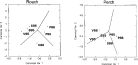
Fig. 3. Locations of group centroids of parasite infracommunities in roach and perch from three lakes in Central Finland in 1986 and 1995. Lines separate areas classified by maximum likelihood as L. Peurunka (P), L. Vatia (V) or L. Saravesi (S), based on discriminant function analyses of parasites from fish from 1986. Centroids labelled 95 are for 1995 data analysed by the 1986 discriminant function.
 You have
Access
- 52
- Cited by