INTRODUCTION
Radiocarbon (14C) is not only an excellent dating tool, but also a great tracer in atmospheric and oceanic circulations. It is produced naturally by the reaction of cosmic-ray neutron and 14N (Equation 1) in the troposphere and stratosphere. The 14C atom is quickly oxidized into 14CO2 and diffuses into the biosphere. The concentration of 14C in air closely correlates to the cosmic ray flux and heliospheric modulation before the industrial revolution (Stuiver et al. Reference Stuiver, Braziunas, Becker and Kromer1991; Usoskin et al. Reference Usoskin, Mursula, Solanki, Schussler and Alanko2004). Modern human activities have had significant effects on the 14C concentration since the industrial revolution. Extensive use of fossil fuel significantly lowers the atmospheric 14CO2 value by contributing 14C-free CO2 to the atmosphere, which is called the Suess Effect (Suess Reference Suess1955; Guilderson et al. Reference Guilderson, Cole and Southon2005; Pazdur et al. Reference Pazdur, Nakamura, Pawelczyk, Pawlyta, Piotrowska, Rakowski, Sensula and Szczepanek2007). Another anthropogenic influence is the nuclear weapon tests from the 1950s to 1960s, which increased the atmospheric 14CO2 concentration by ~980‰ in Δ14C (Nydal and Lovseth Reference Nydal and Lovseth1983; Levin and Hesshaimer Reference Levin and Hesshaimer2000; Hua and Barbetti 2013). After the Nuclear Test Ban Treaty was signed in 1963, the 14CO2 concentration has been decreasing due to the exchange between the atmosphere and other carbon reservoirs (Levin and Kromer Reference Levin and Kromer2004).
Nuclear power plants (NPPs) can produce 14C by thermal neutrons and/or fast neutrons reactions (Equations 1–5), and impact the 14C concentration in surrounding environments (Davis Reference Davis1977; Yim and Caron Reference Yim and Caron2006):
 $${\rm n{\plus}}^{{{\rm 14}}} {\rm N}\!\to^{{{\rm 14}}} \!{\rm C{\plus}p}$$
 $${\rm n{\plus}}^{{{\rm 13}}} {\rm C}\!\to^{{{\rm 14}}} \!{\rm C{\plus}\gamma }$$
 $${\rm n{\plus}}^{{{\rm 17}}} {\rm O}\!\to^{{{\rm 14}}} \!{\rm C{\plus}}^{{\rm 4}} {\rm He}$$
 $${\rm n{\plus}}^{{{\rm 15}}} {\rm N}\!\to^{{{\rm 14}}} {\rm \!C{\plus}}^{{\rm 2}} {\rm D}$$
 $${\rm n{\plus}}^{{{\rm 16}}} {\rm O}\!\to^{{{\rm 14}}} {\rm \!C{\plus}}^{{\rm 3}} {\rm He}$$
There are six major types of reactors: pressurized water reactor (PWR), boiling water reactor (BWR), pressurized heavy water reactor (PHWR), gas-cooled reactor (GCR), light water graphite-moderated reactor (LWGR), and fast breeder reactor (FBR) (Pieroni et al. Reference Pieroni and Kang2008). Production of 14C from NPPs differs depending on the types of reactors. Equations (3) and (5) usually occur when water is used as coolant (e.g. light water reactors PWR and BWR) or oxides exist in the fuel and moderators (Davis Reference Davis1977; Molnar et al. Reference Molnar, Szanto, Svingor, Palcsu and Futo2002). As a result, there is likely more 14C in the form of hydrocarbon in the liquid effluent from light water reactors than others. Equation (2) is only significant in high-temperature GCR. Equations (1) and (4) will happen in reactors with N2 in the fuel, moderator or coolant (e.g. HWR with N2 in the CO2 coolant) (Povinec et al. Reference Povinec, Chudy, Sivo, Simon, Holy and Richtarikova2009).The HWR, therefore, could have more 14CO2 in gaseous effluent. Practically, Equations (4) and (5) have too low cross-sections to really occur (Davis Reference Davis1977; Chudy and Povinec Reference Chudy and Povinec1982).
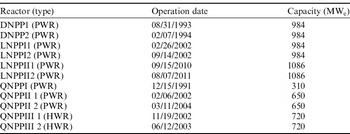
Two NPPs were established in Daya Bay during the last two decades: one is Daya Bay NPP (DNPP, 2 reactors), which is also the first commercial NPP in Mainland China; the other is the Ling’ao NPP (LNPP, 4 reactors). The two NPPs both use PWRs based on the Framatone ANP French three-cooling-loop design (http://china.org.cn/environment/2011-03/29/content_22248031.htm). Therefore, the possible productions of 14C in PWRs are Equations (1), (3) and (5). The airborne 14C released from PWR are mainly hydrocarbons (70–95%) and partly CO and CO2 (5–25%) (Uchrin et al. Reference Uchrin, Hertelendi, Volent, Slavik, Moravek, Koba and Vokal1998; Svetlik et al. Reference Svetlik, Tomaskova, Molnar, Svingor, Futo, Pinter, Rulik and Michalek2006). The 14C in the liquid releases from PWR are carbonates and various organic compounds, but their relative quantities being currently unknown (IAEA 2004). The 6 reactors in Daya Bay provide an annual electrical output of 5802 MWe to the surrounding areas, including Hong Kong. Table 1 lists the information about the reactors in DNPPs and LNPPs. Before 2011, only noble gases, iodine and particles (half-life ≥ 8d) in gas effluents, and tritium and other nuclides in liquid effluents were required to be monitored in the Regulation for Environmental Radiation Protection of NPPs in mainland China (GB6249 1986). Radiocarbon and tritium in gas effluents and 14C in liquid effluents have been added to the routine control after 2011 (GB6249 2011). Therefore, the 14C record in effluents from NPPs in Daya Bay is only available from 2011 onward.
Reactor types, operation dates, and capacities of DNPPs, LNPPs, and QNPPs (Chen et al. Reference Chen, Yu, Li, Price, Shi and Wei2010; Wang et al. Reference Wang, Xiang and Guo2012; Yang et al. Reference Yang, Chen and Li2012).

Previous studies of 14C released from NPPs mainly focused on the airborne 14C, coolants, and tree rings (McCartney et al. Reference McCartney, Baxter, McKay and Scott1986; Levin et al. Reference Levin, Kromer, Barabas and Munnich1988; Hertelendi et al. Reference Hertelendi, Uchrin and Ormai1989; Loosli and Oeschger Reference Loosli and Oeschger1989; Uchrin et al. Reference Uchrin, Csaba, Hertelendi, Ormai and Barnabas1992; Milton et al. Reference Milton, Kramer, Brown, Repta, King and Rao1995; Stenstrom et al. Reference Stenstrom, Skog, Thornberg, Erlandsson, Hellborg, Mattsson and Persson1998; Roussel-Debet et al. Reference Roussel-Debet, Gontier, Siclet and Fournier2006; Povinec et al. Reference Povinec, Chudy, Sivo, Simon, Holy and Richtarikova2009; Vaitkeviciene et al. Reference Vaitkeviciene, Mazeika, Skuratovic, Motiejunas, Vaidotas, Orysaka and Ovcinikov2013). Unlike tree rings at high latitudes, the tree rings in Daya Bay are not ideal due to the difficulties in growth periodicity, wedging rings, and crossdating problems (Worbes Reference Worbes2002; Groenendijk et al. Reference Groenendijk, Sass-Klaassen, Bongers and Zuidema2014). Although a great amount of NPPs are situated near the sea or rivers for the convenience of cooling systems, few studies examined the 14C in the fresh and/or seawater (Magnusson et al. Reference Magnusson, Stenstrom and Aronsson2008; Vincze et al. Reference Vincze, Ranga, Nagy, Zsille and Solymosi2009; Wang et al. Reference Wang, Hu, Xu and Guo2014). Before this study, coral 14C as a tracer to evaluate the radionuclide release of NPPs had not been reported.
In this study, we tested 14C values and elemental ratios in a coral from Daya Bay to see the impact from NPPs on 14C levels and SST since the NPPs’ operations and we would assess the 14C record in coral as an alternative archive of radionuclide release from NPPs.
MATERIALS AND METHODS
Study Site
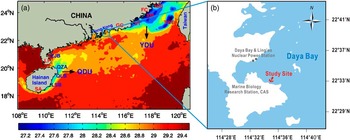
Daya Bay is located at 22°30ʹ–22°50ʹN, 114°30ʹ–114°50ʹE, to the north of the South China Sea (SCS) (Figure 1). It is a semi-enclosed bay with a steep slope and an area of ~600 km2. Daya Bay is a typical marginal sea environment under strong human impacts. Both the agriculture and industry are dramatically increasing due to the urbanization in South China (Morton and Blackmore Reference Morton and Blackmore2001). The lowest temperature (~14°C) appears in January or February, while the highest (~30°C) is in July or August (Chen et al. Reference Chen, Yu, Shi, Chen and Wang2011b). The average annual precipitation in Daya Bay is 1920 mm, which mainly occurs during April to August, accounting for ~76% of the total annual precipitation. The predominant wind in this area is east-southeast and the secondary wind is north. The natural environment in Daya Bay is a good habitat for diverse corals. With the construction of NPPs and regional urbanization, corals have become less and less in Daya Bay (Wang et al. Reference Wang, Wang and Huang2004).
(a) The climatologically summer SST in the northern South China Sea (Jing et al. Reference Jing, Qi, Hua and Zhang2009); (b) sampling site and NPP locations in Daya Bay: the anchor icon indicates the coral sampling site, and the solid gray circles mark the sites of DNPP and LNPP, respectively.

Sample Preparation and Measurement
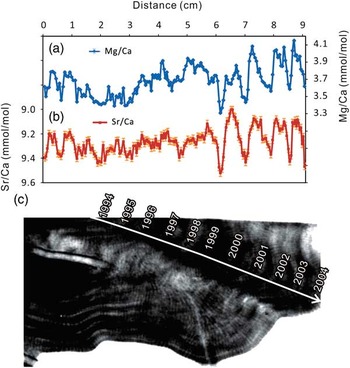
A living Porites coral was collected near Yangmeikeng in the summer of 2005, as shown in Figure 1. The sampling site is ~30 m away from the coast with a water depth of 5 m. It is ~7 km away from DNPP and LNPP. The organic material was removed and then the coral was cut into 1-cm-thick slabs. An x-ray print was used to locate the annual bands (Figure 2). The slab with clearest growth bands was soaked in 10% H2O2 solvent for 24 hr and 0.1 N HNO3 for 15 min to eliminate any organic remains and adherent contaminants (Mitsuguchi et al. Reference Mitsuguchi, Uchida, Matsumoto, Isdale and Kawana2001). The slab was then cleaned with Milli-Q water in an ultrasonic bath for 20 min, repeating for 3 times. The coral slab then was subsampled at an interval of 1 mm to get a monthly resolution along the major growth axis by a dental-type drill (Griffin and Druffel 1985).
(a) The Mg/Ca ratio variations with distance; (b) the Sr/Ca ratio variations with distance; (c) x-ray positive print of Porites coral from Daya Bay (the white line is the section line for subsampling).

About 1 mg from each sample was prepared for Sr/Ca and Mg/Ca analysis. The aliquot was dissolved in 1% HNO3 and diluted to 10,000 times. The elemental ratios were measured by a Varian Vista Pro Inductively Coupled Plasma Atomic Emission Spectrometer (ICP-AES) at the Guangzhou Institute of Geochemistry, Chinese Academy of Sciences (Wei et al. Reference Wei, Yu and Zhao2004). The measurement followed the method based on Schrag (Reference Schrag1999), with an internal standard of a modern Porites lutea coral at intervals for monitoring and result correction. The external precision of Sr/Ca and Mg/Ca ratio are 0.3% and 0.2%, respectively. Sr/Ca and Mg/Ca ratios were reported after the correction of instrumental drift with the internal standard (Wei et al. Reference Wei, Yu and Zhao2004, Reference Wei, Deng, Yu, Li, Sun and Zhao2007).
About four continuous monthly samples were mixed to get approximately 1 mg carbon for the 14C analysis. The mixed sample was pumped down and converted to CO2 by acidification with 85% ortho-phosphoric acid (Griffin and Druffel 1985). Then, the CO2 was purified on a vacuum line in the AMS-14C lab in Guangzhou Institute of Geochemistry, Chinese Academy of Sciences. We used the zinc reduction method to convert CO2 to graphite according to Xu et al. (Reference Xu, Trumbore, Zheng, Southon, McDuffee, Luttgen and Liu2007). Finally, the graphite was analyzed by accelerator mass spectrometry (AMS) at Peking University (Liu et al. Reference Liu, Ding, Fu, Pan, Wu, Guo and Zhou2007). The 14C results are reported as pMC and age corrected Δ14C (‰) (Stuiver and Polach Reference Stuiver and Polach1977). A modern coral standard of Porites which was run repeatedly indicated the total uncertainty is ±0.45 (pMC).
RESULTS
Sr/Ca and Mg/Ca Records
The Mg/Ca and Sr/Ca ratios with error bars are shown in Figure 2. The x-axis is the distance from the bottom, along the section line to the top of the coral. The Sr/Ca ratio has a negative relation to SST, while Mg/Ca has a positive relationship with SST. The cycles in Sr/Ca and Mg/Ca ratio indicate the annual SST cycles (Beck et al. Reference Beck, Edwards, Ito, Taylor, Recy, Rougerie, Joannot and Henin1992; Mitsuguchi et al. Reference Mitsuguchi, Matsumoto, Abe, Uchida and Isdale1996; Deng et al. Reference Deng, Liu, Wei, Li, Tu, Xie, Zhang and Sun2010). Most elemental ratios demonstrate the annual periodicity, which helps identify the chronology for this coral. The x-ray print also shows annual density bands, which can also be used to identify the growth years. Based on elemental ratios and the x-ray print, we found a continuous 11-yr record of Mg/Ca and Sr/Ca ratios in this coral, from 1994 to 2005. Furthermore, we also fine-tuned the Sr/Ca variability to the instrumental SST variation from Zhelang Observation Station, which is 80 km from the study site (Chen et al. Reference Chen, Yu and Chen2013). The Sr/Ca, Mg/Ca, and 14C data using a fine-tuned age model are shown in Figure 3. Due to the high growth rate of coral in summer and low growth rate in winter, the age assignment has an error of 2 months according to pervious work (Bagnato et al. Reference Bagnato, Linsley, Howe, Wellington and Salinger2004; Guilderson et al. Reference Guilderson, Schrag and Cane2004).
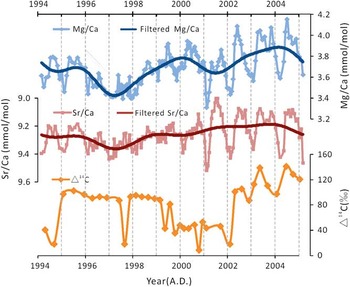
The Mg/Ca, Sr/Ca ratios and Δ14C value with time in the coral from Daya Bay. A low-pass filter (cutoff frequency is 0.5) is used to get the signal of elemental ratios without seasonal signals. The dark blue line (top) is the filtered Mg/Ca curve, while the dark red line (middle) is the filtered Sr/Ca curve. (Colors refer to online version.)

To remove the seasonal signals in the elemental ratios, low-pass filtering with a cutoff frequency of 0.5 Hz was performed (dark blue line and dark red line in Figure 3 in the online version). Those curves show the general trend of elemental ratio variations. Both the low-pass filtered Mg/Ca and Sr/Ca variations show a gradual increase from 1994 to 2005. In addition, the filtered Mg/Ca curve presents a cycle change with the period of 4–5 yr.
14C Records
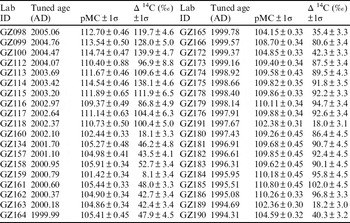
Radiocarbon variation shows three distinguishable stages (Figure 3). The first stage is from 1994 to 1999, in which the Δ14C values increased rapidly in 1994 and stayed at a high level (average at 78‰) until 1999. Then the Δ14C dropped from 1999 and remained low until 2002, which is the second stage with a mean Δ14C value of 39‰. In the second stage, there was a moderate seasonal variation with amplitude of ~40‰. The last stage is from 2002 to 2005. The Δ14C rose dramatically at the middle of 2002 and had stronger seasonal cycles. The average Δ14C value was 117‰ and the seasonal difference reached up to ~50‰. The seasonal Δ14C results were always low in winter but higher in summer (2000–2005). The correlation between the Δ14C and elemental ratios was found to be negligible. All the original Δ14C results are reported in Table 2.
Radiocarbon results of coral from Daya Bay.

DISCUSSION
SST Variations in Daya Bay
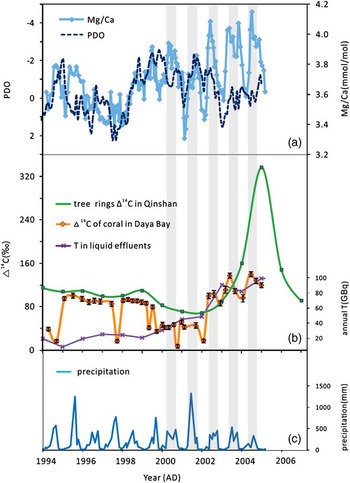
Both the filtered Mg/Ca and Sr/Ca curves had low values during 1996–1998 (Figure 3). The seasonal difference in elemental ratios was much smaller at this time. We believe these results are consistent with the El Niño event in 1997–1998, suggesting that the SST in Daya Bay could be influenced by extreme climate events. The Pacific Decadal Oscillation (PDO) index is established on the monthly January-February-March SST anomalies in the Pacific Ocean (north of 20°) (Mantua et al. Reference Mantua, Hare, Zhang, Wallace and Francis1997). During the positive phase of PDO, the east Pacific is warmer while the western part is cooler, and vice versa. Thus, we compared the Mg/Ca ratio in coral with the PDO index, to assess the correlation between SST in Daya Bay and the global climate oscillation (Figure 4). The Mg/Ca ratio in Daya Bay had a significant negative correlation with PDO before 2002, indicating that the SST in Daya Bay was consistent with the variability of PDO before 2002. However, this correlation changed after 2002. A higher Mg/Ca ratio in the coral indicated unusually higher SST in Daya Bay after 2002. The inconsistency between the Mg/Ca ratio and PDO is possibly a result of the warm-water discharge from NPPs in 2002.
(a) Comparison between Mg/Ca ratios in the coral from Daya Bay and PDO index from 1994 to 2004 (see http://research.jisao.washington.edu/pdo/PDO.latest); (b) the Δ14C and T records in NPPs in Daya Bay, and Δ14C record in QNPPs: the (orange) diamond with error bars is the Δ14C value, the (purple) cross is the T in the liquid release, and the (green) square is the Δ14C record in the tree ring from QNPPs (Wang et al. Reference Wang, Xiang and Guo2012); (c) seasonal precipitation record from Daya Bay weather station (22°31ʹN, 114°31ʹE) (Chen et al. Reference Chen, Yu, Li, Chen and Shi2011a). (Colors refer to online version.)

Δ14C Variation with Climate Variability
Deep seawater is isolated from the atmosphere and usually has lower 14C concentration due to the radioactive decay. Previous studies showed that low radiocarbon concentration in corals was usually caused by upwelling (Grumet et al. Reference Grumet, Guilderson and Dunbar2002; Druffel et al. Reference Druffel, Griffin, Hwang, Komada, Beaupre, Druffel-Rodriguez, Santos and Southon2004; Mitsuguchi et al. Reference Mitsuguchi, Kitagawa, Matsumoto, Shibata, Yoneda, Kobayashi, Uchida and Ahagon2004; Druffel et al. Reference Druffel, Griffin, Beaupre and Dunbar2007). Figure 1 shows the upwelling areas in the northern South China Sea, using a model based on SST and wind data (Jing et al. Reference Jing, Qi, Hua and Zhang2009). One of the main upwelling areas in the northern South China Sea is east of Hainan Island and the other is in the Taiwan Strait (blue areas in Figure 1). Daya Bay is in neither of these areas. So, the low values of Δ14C in 2000–2001 as well as those in 1994 should be the regional background level, rather than a lower level caused by upwelling in Daya Bay.
Oceanic circulations driven by climate change can also regulate the 14C concentration in seawater DIC (Toggweiler et al. Reference Toggweiler, Dixon and Broecker1991; Southon et al. Reference Southon, Kashgarian, Fontugne, Metivier and Yim2002; Druffel et al. Reference Druffel, Griffin, Hwang, Komada, Beaupre, Druffel-Rodriguez, Santos and Southon2004). Many coral records from the Pacific area show that PDO is the main control of 14C variation in seawater DIC (Grottoli et al. Reference Grottoli, Gille, Druffel and Dunbar2003; Druffel et al. Reference Druffel, Griffin, Glynn, Dunbar, Mucciarone and Toggweiler2014). As illustrated in Figure 4, the Δ14C results in this study show an insignificant correlation with the PDO index, revealing that oceanic circulation has limited influence on the change of Δ14C values in seawater in Daya Bay.
Radionuclide Release from NPPs in Daya Bay
Since the oceanic circulation is not the primary reason, the anthropogenic 14C release from nearby NPPs is probably the cause of the increase of Δ14C in our coral record. There are two significant increases in the coral Δ14C record from Daya Bay: one is in 1994 and the other is in 2002. According to the operation date of NPPs in Daya Bay (Table 1), these increases happened close to the operation date of DNPP2 in 1994, and the opening date of LNPPI1 and LNPPI2 in 2002, respectively. Wang et al. (Reference Wang, Xiang and Guo2012) reported an abrupt increase of Δ14C in the tree ring record due to the operation of Plant III in QNPP in 2003, suggesting the radionuclide releases likely happened when new reactors began operations (Figure 4).
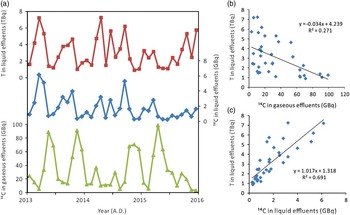
However, QNPP III is a HWR, which has more 4CO2 released in liquid and gaseous effluents. There are few reports of a high concentration of 14CO2 being released from PWR type plants. In order to observe if the high Δ14C events are caused by the release from PWR NPPs, we need to compare the Δ14C results with the radionuclide release records from the NPPs. Since the 14C in liquid and gaseous effluents was not required to be reported prior to 2013 in Daya Bay, we needed to find another proxy to represent the radiocarbon release variation from the NPPs in Daya Bay for the period from 1994 to 2005. Among the available records of radionuclide release of noble gas, iodine and particles in gas effluents and tritium in liquid effluents (https://www.hknuclear.com/dayaperf/releases/pages/radioactive.aspx?lang=sc), only the tritium in liquid showed a good agreement with the radiocarbon release trend from NPPs. Figure 5 shows the variation of tritium in liquid effluents and radiocarbon both in gaseous and liquid effluents from 2013 to 2015. The correlation coefficient of tritium in liquid effluents and radiocarbon in gaseous effluents is r=–0.52 (N=36, p=0.0012), while the one of tritium and 14C in liquid effluents is r=0.83 (N=36, p<0.001). That indicates tritium in liquid effluents has a moderate correlation with radiocarbon in gaseous effluents but a very strong positive correlation with the radiocarbon in liquid effluents. Hence, we can use the tritium in liquid effluent as an alternative proxy for radiocarbon in liquid effluents from 1994 to 2005.
(a) Monthly radiocarbon and tritium release records from NPPs in Daya Bay 2013–2015; (b) tritium in liquid effluents versus 14C in gaseous effluents; (c) tritium in liquid effluents versus 14C in liquid effluents (accessed from https://www.hknuclear.com/dayaperf/releases/pages/radioactive.aspx).

In Figure 4b, the tritium in liquid effluents increased slowly from 1994 to 2001. The value of tritium in liquid effluents was lower than 50 TBq before 2001. However, there is an abrupt rise from 50 TBq to 90 TBq after 2002. Therefore, the radionuclide release (e.g. T and 14C) from NPPs indeed increased when the new reactors started operation, similar to the observation at the QNPPs (Wang et al. Reference Wang, Xiang and Guo2012). Because Daya Bay is a semi-closed area and intercepted by land to the west of NPPs, the liquid effluents from NPPs will eventually flow to the south and east part of the bay, at the location of our study site and the coral could be easily influenced by the radiocarbon released from NPPs.
According to the LNPP construction history, the water channel was moved eastward after 1999 (Ji and Zhang Reference Ji and Zhang2004). This reduced the influence from liquid radionuclide release to the sampling site and lowered the Δ14C value. That is why the Δ14C values in 2000 and 2001 were much lower, close to the background level in 1994. Such a reduction of radionuclide release to the marine life was also revealed by 110Ag in a Sargassum sample from western Daya Bay (Ji and Zhang Reference Ji and Zhang2004). Based on the mean values of three stages, the Δ14C level in seawater DIC increased by ~80‰ in 1994, then decreased by ~40‰ in 1999 and then increased by ~80‰ again in 2002. The two increases have similar excess Δ14C of ~80‰, which is probably caused by effluent from the NPPs. According to Equation (6), the excess Δ14C of ~80‰ is equal to the specific activity of ~18 Bq/Kg C.
 $$A{\equals}{{{\rm pMC}} \over {100\,\%\,}} \cdot \left( {{{1{\plus}{{\delta ^{{13_{{\rm C}} }} } \over {1000}}} \over {0.975}}} \right)\,^ {\hskip-4pt\vskip-8pt2} \cdot \,{\rm e}^{\left( {{{1950{\minus}y} \over {8267}}} \right)}\, \cdot \,226{\rm Bq}/{\rm kg}\,{\rm C}$$
Additionally, the seasonal variation of Δ14C in coral shows a characteristic of high values in summer. The possible reasons could be upwelling, wind, precipitation and seasonal variation in the radiocarbon release from NPPs. According to previous studies, the upwelling has limited influence on Daya Bay (Figure 1) (Chen et al. 2011; Xu et al. 2003). In Figure 5, the 14C releases in gaseous and liquid effluents from NPPs do not appear to have a similar seasonal change to the Δ14C value in the coral. The wind is dominated by east-southeast wind in summer and a north wind in winter due to the Asian Monsoon. Owing to the land barrier to the west, the surface water with high Δ14C values should sink in western Daya Bay and enhance the air-sea exchange in summer, resulting in a higher Δ14C recorded in corals. On the other hand, the north wind in winter will draw the surface seawater away from Daya Bay, bring the compensating current with lower Δ14C value from deep layer into the study site. Additionally, the precipitation in summer is another possible cause, which can bring the 14C in air into the seawater. As shown in Figure 5, the 14C in airborne effluents should be ten times higher than that in liquid effluents. Although the relative ratio of 14CO2 in the airborne effluents is low (5–25%), the absolute concentration of 14CO2, which could be stripped into the seawater, should be higher than the value in seawater without this effect. Both wind and precipitation could lead to the high Δ14C in summer, and it is hard to conclude which is the main reason for the seasonal Δ14C variation pattern in Daya Bay.
CONCLUSION
The Mg/Ca and Sr/Ca records in coral from Daya Bay reveal that the SST is gradually increasing from 1994 to 2005, except the El Nino year in 1997–1998. The SST in Daya Bay had a good correlation with PDO until the LNPP began operation in 2002, which caused an increased SST in Daya Bay. The Δ14C value of DIC in nearby seawater was sensitive to the increased Δ14C release from NPPs when the reactors began operating in 1994 and 2002, respectively. The 14C release from NPPs has a strong and long influence on seawater due to the slow exchange of seawater in semi-closed Daya Bay with other marine carbon reservoirs. The relative increase of radiocarbon in the study site was about ~80‰ in Δ14C, equivalent to 18 Bq/kgC in specific activity. The reason for the high Δ14C value in summer is unclear. We propose that it is linked with the wind and/or precipitation. The examination of elemental ratios and Δ14C value in the coral from Daya Bay shows great potential in monitoring the environmental and radiation effects from NPPs, especially for the NPPs without a 14C release record.
ACKNOWLEDGMENTS
The authors would like to thank the anonymous reviewers for their valuable comments and suggestions to improve the quality of the paper. This project is supported by the National Natural Science Foundation of China (Grant No. 41403011).