1 Introduction
Pension reform has been widely debated particularly for K-12 defined benefit (DB) pension plans, but legislators often do not closely examine benefit-side factors that may be important from a strategic compensation perspective (see Costrell and Podgursky, Reference Costrell and Podgursky2007a, Reference Costrell and Podgurskyb; Hansen, Reference Hansen2008; Biggs, Reference Biggs2009). In addition, states attempting to attract better K-12 teachers often use expected employer contribution rates as measures of pension benefits, failing to recognize the full value of pension plan deferred compensation to career employees. On the benefit side, Lazear (Reference Lazear1990), in his theory of deferred compensation, argues that deferred pension compensation can be used strategically to encourage retention of talented employees by providing incentives for younger employees to work harder to be able to reap future benefits, as well as making separation costly. However, as noted by Costrell and Podursky (Reference Costrell and Podgursky2007a, Reference Costrell and Podgurskyb) and Fitch (Reference Fitch2009), complex pension benefit formulas that provide higher pension wealth accruals at mid-career ages can encourage public service workers to leave at relatively young ages at career peaks. Retiring at earlier ages can contribute to financial difficulties for plans, with longer years of benefits being paid out in retirement.
Since K-12 DB pension plans often contain complex, detailed benefit table provisions, analysis of the benefit side of pension plans is difficult, and teacher salary histories are very difficult to obtain. As noted by Costrell and Podursky (Reference Costrell and Podgursky2007a, Reference Costrell and Podgurskyb), few empirical studies have examined pension wealth for K-12 state public pension plans, and often when data are used, different occupational groups must be lumped together. This study extends the literature by providing more precise estimates of K-12 surplus deferred pension compensation than previous studies. These estimates are derived by utilizing a unique data set of retiree characteristics and salary histories for the Denver Public School Retirement System (DPSRS) for long-term employees with 25 years or more of service involving 846 retirees from 2001 to 2006.
Our sample provides a historical perspective using actual retiree characteristics and salary histories, allowing an examination of differences across job class. The sample supports calculation of five measures of surplus deferred compensation for a selected sample of four other state K-12 DB retirement plans. Other studies often estimate pension value without accounting for the risk-adjusted growth of employer and employee contributions over the working lives of employees. Our study is unique by estimating surplus deferred compensation as the present value of future benefits deducting an offsetting hypothetical account balance for each individual retiree at retirement that represents accumulated earnings on both employer and employee contributions. From a private sector annuity market perspective, surplus deferred compensation represents the amount a retiree would have to pay above his/her account balance at retirement to purchase an annuity to provide the same pension benefits. Our study is also unique by examining the effect of historical employer and employee contribution rates, complex benefit table formulas, and cost of living allowance (COLA) factors over the working lives of individual retirees. We also augment the surplus deferred compensation measures with graphs of pension wealth growth over years of service to analyze pension wealth for different separation ages.
We focus on long-term career employees, beneficiaries of an employer provided risk assumption in defined benefit plans. Long-term employees meet the longevity requirements of typical public employee pension plans for full (or near-full) retirement benefits, typically at 25–30 years of earned service for early retirement. For this sample, long-term employees are a large group, comprising more than 60% of recent retirees. Total compensation surveys often just use employer contribution rates to value deferred pension compensation for career employees that is inconsistent with the levels of surplus deferred compensation provided by retirement benefits that we find in this study.
The empirical results indicate sizable levels of surplus deferred compensation for each plan, with significant differences across plans, job classes, and age groups. When controlling for COLAs and benefit tables, we find that COLAs impact expected retirement benefits more than benefit tables across the five plans. Somewhat surprisingly, the study plans with lower historical employee contribution rates had larger expected retirement benefits. We also find for our sample that reduced benefits for early retirement provide larger pension wealth for younger retirement than full, unreduced benefits, and that younger cohorts starting at an earlier age receive significantly higher surplus deferred pension compensation than cohorts starting at later ages. The results for our sample are consistent with Lazear's (Reference Lazear1990) theory of deferred compensation that predicts that DB pension plans are similar to other types of deferred financial options with an optimum exercise date, to maximize the value of deferred benefits. An important contribution of this study is the recognition for plans in our sample of the full value of K-12 DB pension plans, including differences across plans.
The paper is organized as follows. Section 2 discusses related work. Section 3 summarizes salient features of the different retirement plans examined in the study and presents descriptive statistics for the retiree sample. Section 4 presents the methodology used to analyze surplus deferred compensation. Section 5 presents the hypotheses, while Section 6 discusses the empirical results. Section 7 provides a conclusion and identifies future research directions.
2 Related work
Lazear (Reference Lazear1990), in his theory of deferred compensation, argues that firms pay career workers deferred compensation to provide incentives to reduce both turnover and shirking types of behavior. Hence, pension plans can be used strategically to reward employees for desired behavior if they are included in an optimal compensation framework. DB pension plans, in essence, provide a type of security similar to deferred financial options, with the value of the security depending on the retirement exercise date. Lazear and Moore (Reference Lazear, Moore, Bodie, Shoven and Wise1988) show that the key variable that affects employee turnover is the option value of working an additional year versus current pension accrual in a particular year. From this perspective, Lazear (Reference Lazear1990) notes that pensions may be structured to motivate younger workers to work harder to maintain their access to future pension benefits, and can also be structured as a form of severance pay to encourage retirement, with pension wealth declining after a desired retirement age. He also notes that poorly designed pension formulas can result in unintended consequences, such as providing incentives for older employees to maximize their highest average salaries tied to future benefits by taking on overtime, increasing their occupational risks. DB plans tied only to service years may, in contrast, increase incentives for shirking types of behaviors by older workers.
From a different perspective, since pension wealth accumulates tax free, certain groups of employees may prefer more generous pension benefits to wages. Schiller and Weiss (Reference Schiller and Randall1980) develop a model that assumes that in competitive markets firms that provide pension benefits should pay lower wages than firms that do not, so the value of total compensation should be similar for both types of firms. Testing the hypothesis using pension formula data for 1957–1971 for 1% of workers covered by Social Security provided by the Social Security Administration's Longitudinal Employer–Employee data file, the results are partially consistent with the hypothesis. Younger workers bore a disproportionate share of the cost of reduced wages in exchange for improved retirement benefits for older workers. Benefit formulas for early and later retirement significantly affected the value of deferred pension compensation benefits.
Furgeson et al. (Reference Furgeson, Strauss and Vogt2006) performed the only econometric study that utilizes actual salary and deferred compensation data for K-12 teachers. Their study estimated a logistic model for the likelihood of retirement for a sample of Pennsylvania public school teachers during 1997–1998 and 1998–1999, when pension plans temporarily offered early retirement incentives. To measure retirement incentives, Furgeson et al. (Reference Furgeson, Strauss and Vogt2006) calculated the present value of future defined benefits. Deferred benefits had a sizable effect on the likelihood of a teacher retiring, with a larger effect for female teachers, and a larger effect relative to a rise in teacher salaries. The results agreed with previous studies that found a strong relationship between temporary pension bonuses and the likelihood of industrial workers taking early retirement (Hogarth, Reference Hogarth1988; Kotlikoff and Wise, Reference Kotlikoff, Wise and Wise1989).
Costrell and Podgursky (Reference Costrell and Podgursky2007a, Reference Costrell and Podgurskyb, Reference Costrell and Podgursky2009a) are the only studies that examine changes in pension wealth over a teacher's career under different state DB plans. Because of data restrictions, the authors could not perform a detailed econometric study using actual salary history data, necessitating reliance on hypothetical teacher characteristics and salary growth. Comparisons were made using plan parameters for state pension plans in Ohio, Missouri, Arkansas, California, and Massachusetts to graph pension wealth accruals over the service years of teachers. They calculated pension wealth as the present value of expected payments at some potential age of separation based on the conditional probability of survival to that age, with net pension wealth less the cumulative value of employee contributions with accrued interest at the age of separation. The authors examine gross and net pension wealth over time as a percentage of cumulative earnings. Consistent with plan designs pushing teachers to retire in their peak years, Costrell and Podgursky found low annual pension accruals for early service years, and acceleration in accruals for plans when teachers reached their mid- to late 50s, followed by a dramatic decline in wealth and negative wealth in later years. The authors note that pension formulas and rules often appear to be random and complex, creating at times less than socially optimal results.
Costrell and Podgursky (Reference Costrell and Podgursky2009c), in a related study, compare six existing DB teacher pension systems to an equivalent distribution neutral cash balance system for teachers separating from the system at different ages. They find that a teacher retiring at age 55 would have a net pension wealth of about $300,000 under a DB plan that would be $80,000 greater than the net pension wealth under a fiscally equivalent cash balance plan. A teacher separating at age 45 would leave with a net pension wealth of $50,000 under the DB plan, $100,000 less than the cash balance plan. Relative to a teacher working 30 years in a state system, a teacher splitting her work between two state systems is estimated to lose over 50% of her net pension wealth. Final average salary formulas to calculate benefits and service eligibility rules for normal and early retirement appear to affect the redistribution of wealth from younger to older teachers.
3 State pension plan parameters and retiree data set
This section discusses the plan parameters for each of the five state teacher public pension plans examined [Denver Public School Retirement System (DPSRS), Colorado Public Employees Retirement Association (PERA), Florida Retirement System (FRS), Missouri Public Schools Retirement System/Missouri Teachers (MPSRS), and Nevada Public Employees Retirement System (NVPERS)], followed by details about the DPSRS retiree data set used in the study.
3.1 Plan selection and summaries
We selected the DPSRS plan because we gained special access from administrators from DPSRS who provided a retiree data set, so DPSRS was the primary plan for the study. We selected four additional state plans based on data availability for historical employer and employee contribution rates, detailed benefit table information, and other detailed information for each plan. For the four state plans, we needed a contribution history over the entire salary history for each of the retirees in our DPSRS sample and detailed benefit rate tables. Some potential plans were eliminated because an employer and employee contribution history was not available. Beyond data availability, we wanted plans that had differences in benefit table provisions, cost of living increases, and contribution levels for both employees and employers. Since the DPSRS plan members do not participate in U.S. Social Security, we included other non-participatory plans. We also sought plans participating in Social Security but only the Florida Retirement System (FRS) was able to provide the necessary data. Our selection of plans is somewhat biased by focusing on non-participatory plans in Social Security. Hansen (Reference Hansen2008, pp. 5, 7) points out that there are 13 states that do not participate in Social Security, and a public policy study (Brainard, Reference Brainard2007, p. 7) estimates that approximately 50% of U.S. teachers are not covered by Social Security.
As a caveat, the plans that we selected may not be representative of other state DB plans, so the results of our study should be generalized with caution. In particular, FRS is one of the least generous plans participating in Social Security, while Colorado PERA is one of the more generous plans not participating in Social Security. Participation status in Social Security may impact incentives for teachers to retire. As an additional caveat, we focus only on K-12 employees and surplus deferred compensation for these employees, although some state plans also cover other state employees.
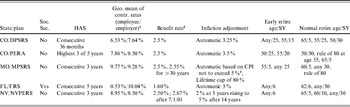
Table 1 summarizes the characteristics of the chosen plans. Benefits are determined by multiplying the highest average salary (HAS) for recent salaries (3–5 years for plans in this study), benefit rates, and service years. PERA has a somewhat relaxed calculation allowing the HAS from 3 of the 5 highest years. Longevity requirements determine the benefit rate at retirement. All of the plans provide full retirement benefits at 30 years of service and reduced early retirement benefits at 25 years of service, providing full retirement benefits at a retirement age substantially less than the normal retirement age for U.S. Social Security (currently 66), which four of the five plans are designed to replace in part.
Summary of plan characteristics

Notes: 1 Geometric mean of annual contribution rate computed over the period 1970 to 2006.
2 Benefit rate for non-reduced retirement benefits.
3 The deferred compensation calculations in the paper used an automatic COLA of 3.25%, the estimate in the 2008 MPSRS annual report.
Source: Plan Descriptions for DPSRS, PERA, MPSRS, FRS, and NPVPERS, and Hansen (Reference Hansen2008, Appendix Table A-1 and A-2), and detailed benefit tables and plan formulas for each plan over the period examined.
Column 4 of Table 1 shows the geometric mean for historical employer and employee contribution rates during 1970–2006. Employer contributions for plans showed wide fluctuations over time [DPSRs (STD 3.13%, range 1.56–12.28%); FRS (STD 4.39%, range 3.75–17.02%); PERA (STD 1.10%, range 6.08–10.28%); NVPERS (STD 1.26%; range 5.70–9.97%); and MPSRS (STD 0.93%, range 7.6–11.40%)]. Historical employee contribution rates show less volatility [DPSRS (STD 0.90%, range 6–8%); PERA (STD 0.28%, range 7–8%); FRS (STD 1.39%, range 0–4%); NVPERS (STD 1.33%, range 6–10.5%); and MPSRS (STD 0.98%, range 8–12%)].
Employer contribution rates typically change yearly, with annual rates calculated based on an actuarial valuation model that involves multiyear projections concerning a fund's investment return, employee salary growth, retirement rates, withdrawal rates, and other factors (see DiNapoli, Reference DiNapoli2009). The employer contributions for this study represent historical contribution rates cited in individual plan reports. However, as Hansen notes (Reference Hansen2008, p. 19), state and local governments at times do not fully make their actuarial required contribution (ARC), which can threaten the future financial viability of plans.Footnote 1 For our study, employer contribution rates only reflect the historical contribution to retirement benefits, not contributions that support retiree health care and other retiree benefits.
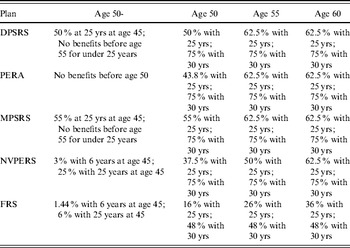
Plan benefit tables are quite complex, with a large number of different rules and special stipulations that are subject to changes over time. Table 2 shows an illustration of retirement benefit table stipulations for different separation ages, which show large differences across plans. For example, a retiree retiring before age 50 (shown in the first column) would receive no benefits under PERA before age 50, but would receive respectively 50% and 55% of HAS at 25 service years (at age 45) under DPSRS and MPSRS. Under NVPERS and FRS, however, retirees receive small service credits of respectively 3% and 1.44% at age 45 with 6 service years, and, of respectively 25% and 6% of HAS with 25 service years. Similar complexities occur for other separation ages. By utilizing detailed information for each plan over each retiree's salary history, this study captures these complexities, among others.
Example comparison of retirement benefit tables stipulations for different separation ages

3.2 Descriptive statistics for the retiree data set
This study uses a unique data set containing retiree characteristics and salary histories for K-12 retirees in the DPSRS who retired during 2001–2006. DPSRS provided the data set as a result of an open records request. Names and identifying information about retirees were replaced with a unique retiree identifier. The data set contained retiree characteristics (DPSRS HAS, hire date, retirement date, earned service years, purchased service credit, account balance, and job description) and salary histories from 1970–2006.
The original data set was filtered to focus on career employees eligible to retire in all five plans. Since plans generally do not allow full benefits for retirees younger than age 50 or with less than 25 years of service, we exclude retirees not meeting these minimums.Footnote 2 From the original data set of 1,571 retirees, 568 were eliminated due to less than 25 years of earned service, 13 were eliminated due to a retirement age less than 50, and five were eliminated on both criteria. An additional 139 retirees were eliminated due to missing salary history. Thus, the final data set used in the study contained 846 retirees.
Only earned service was used to calculate retirement benefits because the cost of purchased service was not provided in the data set. In addition, the five plans had varying treatment of purchased service. In the final sample, 82 retirees had purchased an average of 2.3 years of service. Thus, about 10% of the sample had larger retirement benefits than reflected by their earned service.
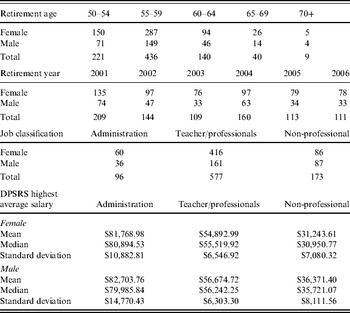
Table 3 shows statistics for retirement age, retirement year, job classification, sex, and highest average salary for the reduced sample of DPSRS retirees. To facilitate analysis, we divided retirees into three employment groups according to supervisory responsibilities and educational requirements. In consultation with the DPS personnel department, job descriptions were classified as administrators (supervisory responsibilities and university degree requirements), teachers/professionals (university degree requirements without substantial supervisory responsibilities), and non-professionals (some postsecondary education or training requirements). The sample characteristics show a preponderance of female retirees in the administrative and teacher/professional classes, a clear separation of highest average salary by job classification, and a preponderance of retirees with early retirement as the average retirement age of the sample was only 57.1 years. Only 49 retirees retired at age 65 or higher.
Selected statistics for the DPSRS sample of 846 retirees

Salary growth was slightly higher for the administrative group than for the other two groups. In our sample, the compound annual salary growth rate was 6.24% for the administrative group, 4.88% for the teacher/professional group, and 5.13% for the non-professional group. The compound average growth rate for the entire sample was 5.10%, consistent with typical growth rate assumptions in compensation studies.
Although the detailed salary histories of DPSRS were not available for the other plans, we think they are similar enough to use to compare the plans. In addition, the salary histories provide more realistic salary growth patterns than simplified assumptions of average growth rates used in other studies. Recent surveys provide some evidence of the similarity of teacher salaries among the plans in our study. According to the National Education Association website, average Colorado teacher salaries are similar to average teacher salaries in Florida and Nevada, about in the middle among U.S. states. For example in the 2007–2008 survey, average teacher salaries were $47,248 (Colorado), $46,930 (Florida), and $47,910 (Nevada). Average teacher salaries were about 10% lower in Missouri ($43,206) than the other states, and the average salary reported for Denver, $47,829, was similar to the Colorado average. As a sensitivity test, we calculated surplus deferred compensation measures for the MPSRS plan using 10% lower salary levels. With this adjustment, the mean retirement benefits fell 10% and the mean account balance fell 10%, resulting in similar surplus compensation measures to those calculated for MPSRS originally without the lower salary adjustment.
Several surveys also provide evidence of recent growth rates. Growth rates between 2004 and 2007 in a research salary survey by DiCarlo et al. (Reference DiCarlo, Johnson and Cohran2008) indicated between 7.2% for Nevada, 9.6% for Florida, 4.2% for Colorado, 3.4% for Missouri, and −2.4% for Denver as compared to 7.22% for the average U.S. teacher. In a study by Nelson and Gould (Reference Nelson and Gould2002) on teacher salaries in large cities from 1990 to 2001, Denver teachers had a 2.84% maximum salary growth rate compared to a 3.6% average for other major cities and a 3.26% national average over this period. Hence, recent DPSRS salary growth may understate salary growth rates for other plans.
4 Research methodology
The research methodology details are presented in this section, including inputs for calculating deferred compensation and the different deferred compensation measures.
4.1 Input variables
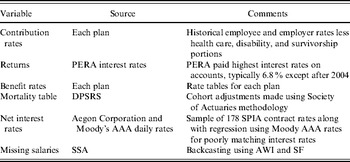
We use data provided by Colorado PERA, net interest rates from single-premium immediate annuity (SPIA) contracts, mortality tables, and the completed salary histories to calculate the different deferred compensation measures for retirees. Table 4 summarizes the characteristics of the input variables.
Summary of input variable characteristics

Historical employer and employee contribution rates, from annual reports and private correspondence with plan administrators, are used for each plan. Using actuarial data in annual reports, we adjusted the employer rates by removing the parts of the contribution for health care, survivorship, and disability benefits. No adjustments were necessary for some plans while others were adjusted by 1–2.5%.
The historical employee and employer contribution rates for each plan and historical PERA plan guaranteed interest rates were used to calculate the earnings for each retiree's hypothetical account balance. PERA is unique as one of the few K-12 DB plans that guarantees interest rates provided on accumulated contributions, whereby upon leaving service, PERA members with a minimum of five years of service can withdraw account balances based on guaranteed interest rates (historically averaging about 6.74%). At retirement, PERA allows individuals to choose a lump sum account withdrawal based on guaranteed interest rates earned on both employee and matching employer contributions as an alternative to annuitized benefits (see Hansen, Reference Hansen2008, p. 31). PERA used higher interest rates than the other plans in our study and any other public pension plan in our background search. The annualized geometric mean of the PERA rates (6.74%) falls about midway between annualized 3-month T-bill rates (5.93%)Footnote 3 and annualized nominal bond rates (7.57%)Footnote 4 in the period 1970–2006. Interest was credited to the combined employer/employee contribution, not just the employee's contribution as is the practice in these plans. Hence, the account balance is an estimate of conservative investment of contributions as a lump sum alternative to monthly benefits.Footnote 5
The period mortality table provided by DPSRS is used as it reflects mortality of the K-12 retiree population. We generated a dynamic, cohort mortality table for each retiree in our sample using the Mortality Projection Scale AA (RP-2000 Table 7–3) following the methodology described by the Society of Actuaries Group Annuity Valuation Table Task Force (1995).
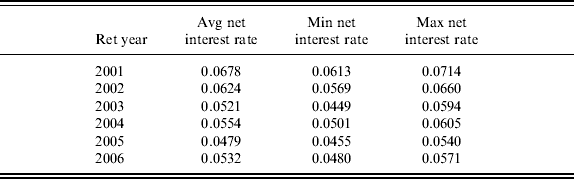
To calculate the expected present discounted value of retirement benefits, net interest rates on single SPIAs were used. A sample of net interest rates was provided by Mr. Richard Greer, FSA and MAAA, of Aegon Corporation. These rates were net of profit, commission, safety margin, and other factors. The net interest rates vary by retirement date, retirement age, and sex. Each observation in the DPSRS sample was matched to the closest contract date in the net interest rate sample. Most observations (626) had a reasonable match within 30 days and 10 years of age, yielding an average date difference of 7.3 days and an average retirement age difference of 4.5 years. For the remaining 222 observations, we developed a regression using the historical Moody's industrial AAA daily rate as the predictor variable and the known contract rate as the predicted variable, yielding an adjusted R 2 of 0.922 and a P-value of 0.000. The matching AAA rate and regression coefficient was used to compute the net interest rates for the remaining 222 observations in the DPSRS sample. Table 5 provides net interest rates means, minimums, and maximums for retirees by retirement year.
Summary of net interest rates for retirement years 2001–2006

A backcasting method was utilized to complete salary histories (see Mannino and Cooperman, Reference Mannino and Cooperman2009). This methodology uses the U.S. Social Security Administration's average wage index (AWI) and scaled Factors (SFs).Footnote 6 The AWI is based on compensation as reported by employers for federal income taxes on Form W-2 on wages, tips, and other compensation as published from 1951 on (www.ssa.gov). The SFs were developed using the SSA's Continuous Work History Sample (Clingman and Nichols, Reference Clingman and Nichols2004). Earnings are backcast for a retiree in year y at age a (E a,y) utilizing the earnings for the next higher year (E a+1,y+1) together with the AWI and SF, respectively for years y and y+1 and ages a and a+1 shown in (1), consistent with Spriggs and Ratner (Reference Spriggs and Ratner2005). To remove the effects of part-time employment, we scaled for the last year of known salary history to its full-time equivalent.

The average earned service for the DPSRS sample was 30.6 years. The salary history contained an average of 13.2 years of salary history. The backcasting method provided an average of 17.8 years of additional salary history. Since we did not backcast partial year salaries, service years were rounded to the nearest whole year of service.
4.2 Surplus deferred compensation measures
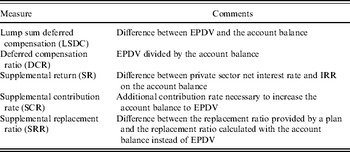
We use the five measures of surplus deferred compensation developed by Mannino and Cooperman (Reference Mannino and Cooperman2009), with each measure based on the expected present discounted value (EPDV) of the retirement benefit stream, as calculated below in (2), as provided by Mitchell et al. (Reference Mitchell, Poterba, Warshawsky and Brown1999). The maximum age in the DPSRS mortality table is 120. Table 6 provides a convenient summary of the measures, followed by a more detailed description of each measure.

where ar is the age at retirement to the nearest whole year, B is the initial annual benefit, r is the benefit inflation factor (varies by plan), Pj is the probability that an individual survives for at least j years past retirement age ar (a retiree's cohort mortality table was used to calculate Pj as indicated in Mitchell et al. Reference Mitchell, Poterba, Warshawsky and Brown1999, and i is the net interest rate determined using the Aegon sample of net interest rates.
Summary of surplus deferred compensation measures

LSDC is the surplus lump sum deferred compensation of a retiree equal to the expected present value of future pension benefits at retirement (EPDV) less the historical account balance of the retiree at retirement. This measure provides the additional amount above a retiree's account balance based on invested contributions that a retiree would need to be able to purchase an equivalent lifetime retirement annuity benefit in the private sector.
DCR is the deferred compensation ratio of a retiree equal to the EPDV divided by the account balance, which provides a relative measure of how the present value of expected benefits compares to the amount in a retiree's account balance. A measure of 1.50 for instance would imply that a retiree needs 50% more at retirement in his/her account balance to be able to purchase an annuity in the private sector at retirement to generate similar future benefits.
SR is the supplemental return that a retiree would need on his/her account balance to have the account balance equal the EPDV during the retirement period. We calculated this measure using the Microsoft Excel IRR function. The account balance is used as the inflow and the expected annual benefits as the outflows, and expected annual benefits are calculated using the Pj s derived from a cohort mortality table. The supplemental return is equal to the IRR less the net interest rate.
SCR is the supplemental contribution rate over an employee's service years needed to earn the LSDC. We use the two allocation approaches as proposed in Mannino and Cooperman (Reference Mannino and Cooperman2009) : (1) a uniform rate across a retiree's entire service history (SCRu) representing the additional contribution rate that would have to be provided each year over a retiree's working life and (2) a weighted supplemental contribution rate (SCRw) that increases linearly with an employee's service years (up until 20 service years). For instance, for an employee in service year 1, the supplemental contribution rate is 1/20 times the supplemental contribution rate in service year 20 (where 20 service years is considered to be long-term employment). SCRw provides increasing contribution rates as service years rise to reflect back-loaded benefit accrual and increasing probability that an employee will retire with full benefits. The Microsoft Excel solver was used to search for the contribution rate that would make the supplemental account balance equal to the LSDC.
SRR is the supplemental replacement ratio that a retiree would have received if benefits were based on the account balance instead of a benefit replacement ratio based on age and service years. This alternative replacement ratio was calculated using the Microsoft Excel solver searching for the initial benefit (B) in equation (2) with the EPDV set to the account balance. The alternative replacement ratio is equal to the initial benefit divided by the HAS of the retiree. The supplemental replacement ratio is the actual replacement ratio (i.e. 75% for 30 years of service in DPSRS) less the alternative replacement ratio based on the account balance.
5 Hypotheses
This section presents the hypotheses listed in Table 7.
Hypotheses for surplus deferred compensation and pension wealth

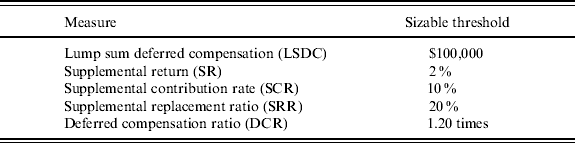
The primary hypothesis involves the existence of sizable surplus compensation for career employees. Under Lazear's (Reference Lazear1990) theory of deferred compensation, firms make greater use of deferred pension compensation to encourage career employees to remain with the firm and to reduce tendencies for shirking behavior for employees hired at younger ages. Costrell and Podursky (Reference Costrell and Podgursky2007a, Reference Costrell and Podgurskyb, Reference Costrell and Podgursky2009a, Reference Costrell and Podgurskyb) also demonstrated large amounts of deferred compensation for K-12 employees under state DB plans. To test for substantial levels of surplus deferred compensation, we use the thresholds shown in Table 8 selected as a meaningful amount of additional compensation.
Threshold compensation values for hypothesis H1

Hypothesis 2 expects differences in average surplus deferred compensation (LSDC) and its components (EPDV and account balances) across plans. EPDV is affected by historical factors, including HAS, benefit rates, inflation adjustments for benefits (COLA), minimum retirement ages, and other complex formulas incorporated in plan benefit tables. Plans with more generous COLA adjustments and service credits would be expected to have higher EPDV and LSDC. Since service credits for full benefits are similar, but PERA and DPSRS have more generous COLAs, rankings on EPDV would be expected to be greater for these two plans. FRS, with the lowest service credit per year, and a HAS based on 5 versus 3 years would be expected to have the lowest values. Lower account balances affected by lower total contribution rates also contribute to a higher LSDC, so PERA and DPSRS as more generous plans with lower total contribution rates would be expected to have higher surplus deferred compensation.
Beyond plan rankings, we examine the role of benefit tables versus cost of living adjustments on EPDV differences across plans. We estimate EPDV under conditions of (1) holding benefit tables constant and allowing COLA differences across plans, and (2) holding COLA differences constant and allowing benefit tables to differ across plans.
Hypothesis 3 examines differences in surplus deferred compensation measures by job classes. Mannino and Cooperman (Reference Mannino and Cooperman2009), examining university employees, found higher surplus deferred compensation for administrators than professional and non-professional university employees, given their larger salaries and salary growth. Lazear (Reference Lazear1990) also suggests that greater amounts of deferred compensation may be needed when effort is less transparent and observable, suggesting larger surplus deferred compensation for the administrative job class.
Hypothesis 4 proposes that surplus deferred compensation will vary by cohort age group, with a younger starting age cohort receiving larger surplus deferred compensation. As noted by Lazear, firms may offer larger amounts of deferred compensation to attract younger worker cohorts (hired at an earlier age) as an incentive for them to work harder and remain with the firm. For cohort age group, we divided the sample into three groups by age at hire date (25−, 26–30, and 30+) to examine this premise for surplus deferred compensation.
Hypothesis 5 involves pension wealth for retirement at different separation ages for reduced and unreduced benefits. Pension wealth (PW), defined by Costrell and Podgursky (Reference Costrell and Podgursky2007a, Reference Costrell and Podgurskyb; Reference Costrell and Podgursky2009a, Reference Costrell and Podgurskyb, Reference Costrell and Podgurskyc) is an individual's pension wealth at a potential age of separation A s, which is calculated according to their formula shown in equation (3). PW reflects both the size of annual pension payments and the number of years it will be received at some potential separation age. We compare PW by plan and then analyze PW for different ages of separation in more detail by age group for selected plans.

where A s is the age at separation, B(A|A s) is the benefit at age A given separation at age A s (when A is less than the age for periodic benefits, B(A|A s)=0; when A is equal to minimum age for full periodic benefits, B(A|A s) is taken from the benefit table; when A is greater than the minimum benefit age, the inflation factor is used to determine B(A|A s)), f(A|A s) is the conditional probability of survival to age A given separation at age A s, r is the net interest rate to calculate pension wealth, and MaxA is the maximum age in the mortality table.
6 Empirical results and analysis
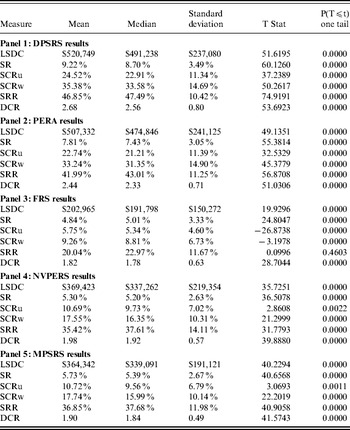
Table 9 shows the results for surplus deferred compensation measures for each plan based on detailed plan parameters using the DPSR retiree sample. The results show surplus deferred compensation above the Table 8 substantial thresholds, with the exception of FRS's SCR and SRR measures that were not as sizable as other plans. Interpreting the results for DPSRS, a retiree would have to pay an additional $520,749 for a private annuity at retirement to generate similar expected retirement benefits, make a 9.22% supplemental return over the private annuity rate, receive 25% additional compensation for each working year (or 35% additional compensation for later years), or have on average 2.68 times more retirement earnings in an account balance.
Test results for surplus deferred compensation measures by state plan

For Hypothesis 2, we tested for significant differences in surplus deferred compensation measures among plans. t-tests and Hedges’ (Reference Hedges1981)G-tests (not shown for the sake of brevity) showed all plans to have significantly higher means over FRS, at a 0.01 level, and large size effects. DPSRS and PERA had significantly higher means on each measure than respectively NVPERS and MPSRS at the 0.01 level, with a median size effect using Hedges’ G-tests. DPSRS and PERA had means on LSDC that were not significantly different. However, DPSRS dominated PERA on all the other measures at the 0.01 level, with small size effects on SR and DCR and a large size effect on SRR. The means on LSDC for NVPERS and MPSRS were not significantly different. For other measures, NVPERS had a significantly lower mean on SR and SCR, but a significantly larger mean on SRR and DCR, with a large size effect for SRR. Hence for surplus deferred compensation measures, DPSRS ranks first, followed by PERA, with a mixed ranking for NPSERS versus MPSRS, but all plans dominate FRS.
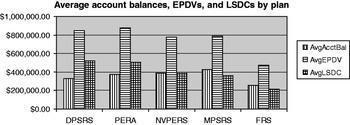
To examine the premise of Hypothesis 2 that LSDC and EPDV will vary by plan characteristics, Figure 1 compares plans by AvgLSDC, AvgEPDV, and AvgAcctBal. PERA shows the largest EPDV, followed by DPSRS, then MPSRS and NVPERS (with similar AvgEPDV), and then FRS. Pairwise t-tests (not shown for the sake of brevity) confirmed this ranking with a significantly higher AvgEPDV for PERA than all plans, for DPSRS than all other plans, and for NVPERS and MPSRS with no significant differences in means but with a significantly higher mean than FRS.
Comparison of LSDC components for each plan

Figure 1 also suggests surprisingly that the higher EPDV plans, PERA and DPSRS, each have a lower AvgAcctBal than NVPERS and MPSRS, confirmed by t-tests at the 0.01 level. In terms of rankings on AvgAcctBal, MPSRS had a significantly higher mean than the other plans, followed by NVPERS, then PERA, and finally DPSRS and FRS with insignificantly different means. Examining rankings on employee contribution rates, PERA and DPSRS (with the highest mean EPDVs) had significantly lower employee contribution rates (7.86% and 6.53%, respectively) than MPSRS and NVPERS (8.95% and 9.77%, respectively) at the 0.01 level. Comparing employer historical contribution rates, FRS (10.04%) and MPSRS (9.28%) had a significantly higher mean than the other plans (NVPERS 8.50%, PERA 8.50%, and DPSRS 7.64%). PERA and DPSRS also had significantly lower mean total contribution rates ( 16.36% and 14.17%, respectively) than NVPERS and MPSRS (17.45% and 19.05%, respectively).
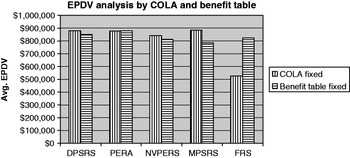
In an additional analysis, we calculated the average expected present value of pension benefits (EPDV) holding (1) COLA fixed at 3.5% (as used by PERA), allowing benefit tables to differ across plans, and (2) benefit tables fixed (using DPSRS benefit tables), allowing COLAs to differ. Figure 2 graphically depicts the two scenarios by plan, with an examination for differences in means on EPDV for each scenario shown in Table 10.
Analysis of EPDV by COLA and benefit table for each plan

EPDV under different scenarios
P-values show significant levels for paired t-tests for differences in means. Hedges’ G-tests show effect size, where ⩾0.2 is a small effect, ⩾0.5 is a median effect, and ⩾0.8 is a large effect.

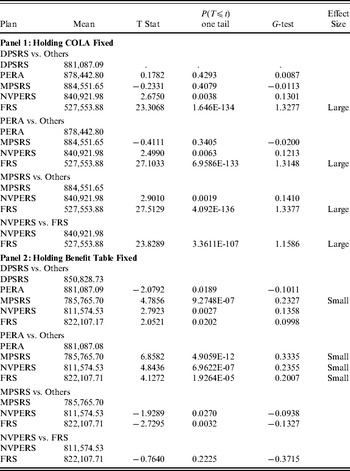
As shown in the first column of Figure 2, under the COLA fixed scenario, plan rankings on mean EPDV change, with similar means for DPSRS, PERA, and MPSRS, a slightly lower EPDV for NVPERS, and a much lower mean for FRS. Panel 1 of Table 10 shows the means and t-statistics for differences across plans for this scenario. DPSRS, PERA, and MPSRS dominate NVPERS and FRS, with large size effects for each plan over FRS, with means otherwise insignificantly different.
Under the benefit table fixed scenario as shown in the second bars of Figure 2, there is more variation in AvgEPDV across plans, with PERA having the highest AvgEPDV, followed in ranking order by DPRS, FRS, NVPERS and MPSRS. t-tests in panel 2 of Table 10 confirm that PERA dominates all plans. DPSRS dominates all the remaining plans, followed by FRS dominating NVPERS and MPSRS, and NVPERS dominating MPSRS. Hedges’ G-statistics indicate small size effects for PERA over MPSRS, NVPERS, and FRS, and a small size effects for DPSRS versus MPSRS. Recently, PERA and other state DB plans have introduced proposals to reduce COLA adjustments to help reduce financing problems for future benefits, consistent with these results.
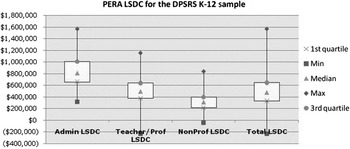
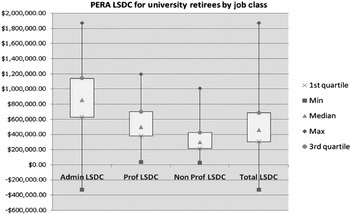
To examine Hypothesis 3, Figure 3 shows box charts for LSDC across job classes for PERA. The other plans had similar patterns for job classes. The highest median LSDC occurs for administrators, followed by teachers and other professionals, with the lowest mean for the non-professionals. For comparison, Figure 4 shows the results on LSDC for a sample of university non-faculty retirees in the previous study by Mannino and Cooperman (Reference Mannino and Cooperman2009), showing a similar pattern.
Box charts for PERA LSDC by employee group

Box charts for PERA LSDC by employee group for a sample of 278 university retirees (except faculty) from 2000 to 2006

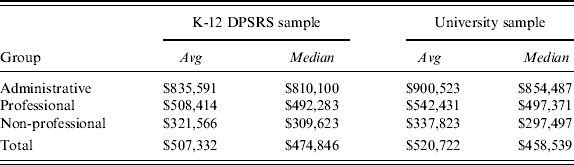
Table 11 shows the summary means and medians for each job class in the two samples. t-tests and Hedges’ G-tests (not shown for the sake of brevity) showed, for each sample, a significantly higher mean for administrative job classes than for other job classes, with large size effects, and a significantly higher mean for professional job classes over the non-professionals. The results are consistent with Lazear's suggestion that job classes with less transparency that are more difficult to monitor will require higher amounts of deferred compensation.
Selected PERA LSDC statistics for the DPSRS K-12 and university samples

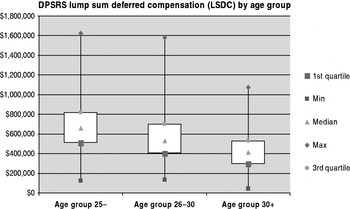
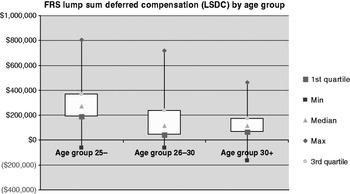
To examine Hypothesis 4 that predicts higher AvgLSDC for younger starting ages, we analyzed AvgLSDC by age cohort groups based on starting age of employment. Figure 5 divides the DPSRS sample by age at hire date (25− with 402 retirees, 26–30 with 279 retirees, and 30+ with 165 retirees). A higher AvgLSDC appears for younger starting age cohorts that started at age 25, but still considerable deferred compensation for older starting age groups. The boxes in Figure 5 decline in a consistent manner. t-tests (not shown for the sake of brevity) across age cohorts indicated significantly higher AvgLSDC for the age 25− hire cohort over each of the later age cohorts. Hedge's G-tests show a median effect size for comparisons of the 25− and 26–30 cohorts, and a large size effect for the 25− and 30+ cohorts. Similar patterns occur for the other plans, with the exception of FRS (with a lower benefit rate), as shown in Figure 6, with similar boxes for the two latter age groups (26–30, 30+) but a tighter box for the 30+ age group. The results are consistent with Mannino and Cooperman's (Reference Mannino and Cooperman2009) finding of an inverse relationship between LSDC and retirement age for university retirees. The results also support Lazear's (Reference Lazear1990) premise that workers starting at a younger age will receive greater deferred pension compensation.
Box charts for DPSRS LSDC by age group

Box charts for FRS LSDC by age group

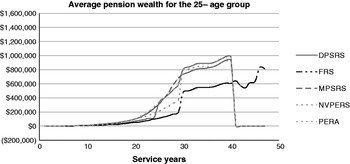
The final Hypothesis 5 proposes that pension wealth will be higher with separation at an early age. To examine this hypothesis, we calculated pension wealth for each of the 846 retirees for different service years for each plan, assuming a starting employment age of 25. Figure 7 shows the average pension wealth for different separation years. At 25 service years, DPSRS, PERA, and MPSRS provide similar pension wealth and growth in pension wealth at 20 service years on. NVPERS has a large growth rate near 30 service years to close the gap with MSPRS. FRS has a slow growth rate until year 30. After 30 years, pension wealth growth flattens for each plan. Note that after about 35 years, the graphs are less reliable as the number of retirees with more than 35 service years was small in the DPSRS sample. Consistent with Costrell and Podursky (Reference Costrell and Podgursky2007a, Reference Costrell and Podgurskyb, Reference Costrell and Podgursky2009a, Reference Costrell and Podgurskyc), pension wealth is higher with separation at 30 service years, at an early age of 55. The graph results support Lazear's (Reference Lazear1990) premise that similar to financial options, deferred compensation provides an optimal separation age for maximizing the value of the option, in this case at about age 55 for employees that started working at an early age.
Average pension wealth for the 25− age group

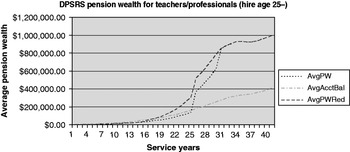
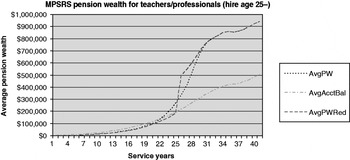
Figures 8 and 9 provide more detail about pension wealth growth, showing pension wealth under two scenarios of retiring at the minimum age for full benefits and retiring at the minimum age for reduced benefits. Average pension wealth (AvgPW) is calculated based on the benefits available when an employee reaches the minimum retirement age for full (unreduced) benefits. For example, an employee starting work at age 25 would be eligible for full retirement benefits (75% of highest average salary) at age 55 in DPSRS. Average reduced pension wealth (AvgPWRed) is calculated based on the benefits available when an employee reaches the minimum age for reduced benefits. For instance, a DPSRS employee who started at age 25 would be eligible for reduced benefits (25% of highest average salary) at age 50. The remaining line (AvgAcctBal) in Figures 8 and 9 is the average account balance to provide a context for the pension wealth graphs.
Average DPSRS pension wealth for the teacher/professional group

Average MPSRS pension wealth for the teacher/professional group

In Figure 8, examining pension wealth for DPSRS, DPSRS has a large gap with reduced pension wealth (AvgPWRed) larger than full pension wealth (AvgPW) from 20 service years until 30 service years. DPSRS provides generous reduced benefits as early as age 45 with 25 years of service. In contrast, MPSRS (Figure 9) provides a relatively small difference between AvgPW and AvgPWRed. In both figures, AvgPW is about the same as the account balance until about 25 service years. The figures show a similar pattern to Figure 9 of Costrell and Podgursky (Reference Costrell and Podgursky2009c) examining the net pension wealth for Missouri teachers based on age of separation, with the figures indicating higher mean pension wealth with separation at a younger age even without full benefits.
7 Concluding remarks
This paper emphasizes the benefit side of defined benefit plans, estimating the value of surplus deferred compensation for career employees in five prominent defined benefit plans for K-12 educators: Denver Public Schools Retirement System (DPSRS), Colorado Public Employee Retirement Association (PERA), Missouri Public Schools Retirement System (MPSRS), Nevada Public Employee Retirement System (NVPERS), and Florida Retirement System (FRS). Surplus deferred compensation is derived from the difference between the expected present discounted value of promised retirement benefits and the accumulated contractual employer and employee contributions and interest over a retiree's working history. We utilized a sample of 846 retiree characteristics and salary histories provided by DPSRS to examine surplus deferred compensation across the different plans based on historical employer and employee contribution rates and complex benefit table formulas.
Our basic finding was sizable, significant levels of surplus deferred compensation across all five plans, with differences across plans. Among the four plans with the largest amounts of surplus deferred compensation, higher surplus deferred compensation occurred for plans with lower account balances with lower historical average employee contribution rates. Plans with the largest pension values had the smallest employee contribution rates. When controlling for COLA and benefit tables, COLA differences particularly affected plan rankings on pension values. Together, these results should be generalized with caution because the subset of plans in this study may not be representative of other plans.
Our secondary finding involved the analysis of surplus deferred compensation across job classes and age cohort groups compared with findings in a previous study of university retirees (Mannino and Cooperman, Reference Mannino and Cooperman2009). Consistent with the findings of the previous study, we found substantial differences across different job classes, with a very large surplus deferred compensation for administrators. Also consistent with the previous study's finding of an inverse relationship between starting age and deferred compensation, we found significant differences across age cohort groups, with retirees hired before age 26 receiving large amounts of deferred compensation than the 26–30 group and the 30+ group.
Our third finding involved a comparison of pension wealth among the three plans. Consistent with the study by Costrell and Podursky (Reference Costrell and Podgursky2007a, Reference Costrell and Podgurskyb), we found that pension wealth accelerated at 25 years of service for each plan. Pension wealth for reduced benefits provided larger wealth accrual at younger ages than full, unreduced benefits in some cases. In the most extreme case, DPSRS provides reduced benefits beginning as early as age 45 for 25 years of service. These reduced benefit levels increase pension wealth for approximately 10 years before full retirement benefits begin. The empirical results are consistent with Lazear's (Reference Lazear1990) theory of deferred pension compensation, whereby pensions like other types deferred compensation contain an option value that is maximized at a certain optimum separation date.
For future research, we have several areas of interest. We plan to study the impact of salary growth in later employment years on pension values and surplus deferred compensation. One way to control pension costs is to limit raises for employees within 5–10 years of early retirement. We plan to develop a predictive model that will provide more realistic estimates of the value for surplus deferred compensation than employer contribution rates for DB plans often used by total compensation committees to measure the value of pension compensation. We would also like to collect additional data to extend the scope of this research to other areas of public employment such as state agency workers and law enforcement.