Introduction
Grasshoppers (Orthoptera: Acrididoidea) are among the numerically dominant herbivores in grassland ecosystems around the world and play an important role in nutrient cycling and plant production. They are some of the most important native primary consumers and serve as prey for higher trophic levels (Belovsky and Slade, Reference Belovsky and Slade2000; Hawlena and Schmitz, Reference Hawlena and Schmitz2010; Song et al., Reference Song, Mariño-Pérez, Woller and Cigliano2018). Several grasshopper species are considered major pests, especially when they develop local or large-scale outbreaks causing significant damage (COPR 1982; Lecoq and Zhang, Reference Lecoq and Zhang2019). Grasshopper populations respond to a combination of interacting extrinsic (e.g., weather conditions) and intrinsic (e.g., biotic interactions) factors that vary spatially and temporally (Belovsky and Joern, Reference Belovsky, Joern, Cappuccino and Price1995; Branson et al., Reference Branson, Joern and Sword2006; Jonas and Joern, Reference Jonas and Joern2007). Changes in any of these factors might affect aspects of their life cycle (development time, growth, nutrition, fertility, among others) as well as the distribution and population dynamics of species (Bernays, Reference Bernays1998; Joern and Behmer, Reference Joern and Behmer1998; Jonas and Joern, Reference Jonas and Joern2007; Ebeling et al., Reference Ebeling, Hinesb, Hertzogd, Lange, Meyerd, Simons and Wisser2018).
Diverse studies have suggested that water availability is a key factor that influences the grasshopper community through direct and indirect pathways (Kemp and Cigliano, Reference Kemp and Cigliano1994; Chen, Reference Chen1999; Stige et al., Reference Stige, Chan, Zhang, Frank and Stenseth2007; Zhang et al., Reference Zhang, Cazelles, TianHD, Bräuning and Stenseth2009). Water availability is generally associated with changes in environmental conditions and could alter directly the phenology and distribution range of the grasshopper species (Guo et al., Reference Guo, Hao, Sun and Kang2009). In addition, water stress has been shown to affect grasshopper reproduction and abundance by influencing life-history traits (Rourke, Reference Rourke2000; Gardiner, Reference Gardiner2010), and enhancing their growth through the increase in plant nutrients (Lenhart et al., Reference Lenhart, Eubanks and Behmer2015). Likewise, a rainfall increase strongly fosters species richness and primary productivity of plant communities (Adler and Levine, Reference Adler and Levine2007; Yang et al., Reference Yang, Li, Wu, Zhang, Li and Wan2011; Zhu et al., Reference Zhu, Qu, Zhang, Li, Wen, Wang and Ren2017), which might positively influence the grasshopper community. On the other hand, the temperature has a great influence on the development of the life cycle, the beginning of the diapause and the development of nymphal stages (Zohdy et al., Reference Zohdy, Abdel Rahman and Ame2015).
In Argentina, the grasslands of the Pampas region represent approximately 15% of the country's surface and are considered one of the most modified biomes due to intense agricultural use. Given the productive capacity of this region, grasslands have been heavily replaced by agroecosystems since the 19th century, which has substantially modified their structure and functioning (Viglizzo et al., Reference Viglizzo, Lértora, Pordomingo, Bernardos, Roberto and Del Valle2001, Reference Viglizzo, Frank, Carreño, Jobbágy, Pereyra, Clatt, Pincén and Ricard2011; Baldi and Paruelo, Reference Baldi and Paruelo2008; Bilenca et al., Reference Bilenca, Codesido, Fischer, Pérez Carush, Zufiaurre and Abba2012). The region is characterized by an alternation of periods of drought and flood, which affect water availability, the productivity of agricultural systems and other human activities (Aliaga et al., Reference Aliaga, Ferrelli and Piccolo2017).
As in other grasslands of the world, grasshoppers are one of the most predominant groups of insects in the Pampas (Cigliano et al., Reference Cigliano, De Wysiecki and Lange2000; Torrusio et al., Reference Torrusio, Cigliano and De Wysiecki2002; De Wysiecki et al., Reference De Wysiecki, Torrusio and Cigliano2004; Bardi, Reference Bardi2013; Mariottini et al., Reference Mariottini, De Wysiecki and Lange2013). Due to their commonness, abundance and economic importance, the melanoplines Dichroplus elongatus, Dichroplus maculipennis and Dichroplus pratensis and the gomphocerine Borellia bruneri are the most conspicuous species (fig. 1) (Cigliano et al., Reference Cigliano, De Wysiecki and Lange2000, Reference Cigliano, Torrusio and De Wysiecki2002; Torrusio et al., Reference Torrusio, Cigliano and De Wysiecki2002; De Wysiecki et al., Reference De Wysiecki, Torrusio and Cigliano2004, Reference De Wysiecki, Arturi, Torrusio and Cigliano2011; Mariottini et al., Reference Mariottini, De Wysiecki and Lange2011, Reference Mariottini, De Wysiecki and Lange2012, Reference Mariottini, De Wysiecki and Lange2013). Considering the ecological and economic importance of grasshoppers in the Pampas, the aim of this study was to explore the relationship between temporal changes in the density of the most abundant species in the southern Pampas and climate variables related to temperature and rainfall over an 11-year study period.
Adult individuals of Borellia bruneri, Dichroplus elongatus, Dichroplus maculipennis and Dichroplus pratensis.

Materials and methods
Study area
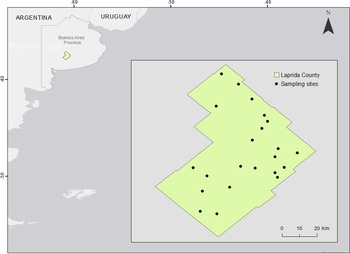
This study was conducted in Laprida County (345.498 ha), Buenos Aires province, southern Pampas region (36° 02′S, 59° 06′W). Mean temperatures are 22 °C in summer and 6 °C in winter, and the mean annual rainfall ranges from 800 to 900 mm. Grasslands are the dominant vegetation type (Batista et al., Reference Batista, León and Perelman1988; Chaneton, Reference Chaneton, Oesterheld, Aguiar, Ghersa and Paruelo2005). Soil characteristics (low infiltration, excess alkalinity, slight slope, coarse mantle at shallow depths) have limited continuous agricultural use in most of this region, being livestock farming the main activity since late in the 19th century (Perelman et al., Reference Perelman, León and Oesterheld2001; Batista et al., Reference Batista, Taboada, Lavado, Perelman, León, Oesterheld, Aguiar, Ghersa and Paruelo2005). Approximately 45% of the county's surface is used for cattle raising (Torrusio and Otero, Reference Torrusio and Otero2009; Recabarren, Reference Recavarren2016).
Sampling
Sampling sites (n = 22), distributed in different areas of the county (fig. 2), were monitored in December and in January of each year from 2005 to 2016. They were selected according to the dominant vegetation that characterizes the native grasslands of this region (Batista et al., Reference Batista, León and Perelman1988; Mariottini et al., Reference Mariottini, De Wysiecki and Lange2013). Grasshoppers were collected in early-mid-summer (December and January) with 200 sweeps of entomological nets (diameter: 40 cm, depth: 75 cm, arc of sweep: 180°) along transects at each site according to Evans (Reference Evans1988), which provides representative samples of grasshopper communities (Larson et al., Reference Larson, O'Neill and Kemp1999). Species composition and richness, and relative abundance of each species were determined at each sampling site and each season. Community density was estimated by counting the number of grasshoppers flushed from a series of 30 rings (0.1 m2) each placed at 5 m intervals along three transects (Onsager and Henry, Reference Onsager and Henry1977). The density of each species was calculated by multiplying the proportion of each species by the overall grasshopper density. Grasshoppers collected using sweep nets were placed in plastic bags, maintained on ice and transported to the laboratory for species identification.
Map of Laprida county with sampling sites.

Climate variables
Considering that all four most common species have obligatory embryonic diapause and hatchings can be observed from late October (Mariottini et al., Reference Mariottini, De Wysiecki and Lange2011), the climate variables considered were: annual cumulative rainfall (from previous January to sampling date), cumulative rainfall from September to sampling date, cumulative rainfall from October to sampling date, number of rainy days (RD) from September to sampling date, seasonal rainfall (spring, winter, fall, summer) and thermal amplitude, measured as the difference between the maximum and minimum temperatures in September, October, November and December. Climatic data were obtained from automatic weather stations installed in the fields by ranch owners (Precipitations and temperature) and the National Meteorological Service (https://www.smn.gob.ar/) (Precipitations and temperature).
Statistical analyses
To model the richness and density of each species, generalized linear models were carried out. A generalized linear model with Poisson response and identity link function was used to model species richness counts. Data were transformed by a linear translation to correct indeterminacy densities of the species models. The Gamma family of distributions was used as a link function to model density for each particular species. Models considered the season as a factor and all proposed climate variables as covariates. A descriptive analysis was carried out to study multicollinearity and the variables that resulted were those included in the linear models. Akaike's values were used as model selection criteria. Rcmdr library of GNU R (version 3.6.0) was used.
Climate variables were selected considering the life cycle of the four species. We consider that both rainfall and temperature are key variables in the life cycle of these insects. Climate variables were compared using Mann–Whitney or Kolmogorov–Smirnov tests. Species richness by site/sampling season was compared using a one-way analysis of variance (ANOVA). LSD Fisher test was used for means comparison.
Results
Climate variables
We observed that in most seasons, rainfall accumulated from previous January to the sampling date was greater than 800 mm and it was less than this value in 2005–2006, 2008–2009 and 2009–2010 (table 1; Supplementary fig. 1). The rainfall accumulated in 2008–2009 and in 2009–2010 were significantly lower than those registered in the other seasons (P < 0.05). The wettest season was 2012–2013, when rainfall was significantly higher (1260 ± 16.68 mm; P < 0.05) than in the other seasons (Supplementary table 1). A similar pattern was observed for RAS and October to the sampling date, the lowest rainfall was recorded in 2008–2009 and in 2009–2010 (table 1; Supplementary fig. 2). Generally, the highest seasonal rainfall was recorded in summer and spring. Considering the entire study period, the mean rainfall was 281 ± 23.9 mm and 240.4 ± 16.27 mm in summer and spring, respectively, whereas in fall and winter it was 58.4 ± 22.37 mm and 126.1 ± 16.27 mm, respectively. From 2005–2006 to 2007–2008, the summer was wetter than the rest of the seasons (P < 0.05), while spring was rainier than fall and winter (P < 0.05). From 2008–2009 to 2010–2011, the rainfall was higher in summer and spring than in winter and fall but did not differ from each other (P > 0.05). The highest annual rainfall was recorded in 2012–2013, when rainfall increased in all seasons but showed no significant differences between them. The same pattern occurred in 2014–2015, whereas in 2013–2014, the rainfall in summer, fall and spring was higher than in winter (Supplementary fig. 3). The number of RD from September to the sampling date varied significantly by season (P < 0.05) (Supplementary table 2). The highest value was recorded in 2012–2013 and the lowest in 2008–2009 and 2009–2010 (table 1; Supplementary fig. 4).
Values (mean ± standard error) of the climatic variables used in the study: Annual cumulative rainfall (from previous January to sampling date), cumulative rainfall from September to sampling date, cumulative rainfall from October to sampling date, seasonal rainfall (spring, winter, fall, summer), measured in millimeters. And a number of RD from September to the sampling date

.
The thermal amplitude range (minimum and maximum) in September ranged from 10.5 °C in 2014–2015 to 15.34 ± 0.11 in 2011–2012. In October, it varied between 11.06 °C in 2014–2015 and 16.42 ± 0.84 °C in 2011–2012. In November, it ranged from 13.13 °C in 2014–2015 to 17.9 ± 0.74 °C in 2008–2009, whereas in December, it was 13.72 ± 0.31 °C in 2012–2013 and 18.2 °C in 2010–2011 (Supplementary fig. 5).
Grasshopper abundance and density
A total of 25 grasshopper species belonging to the families Acrididae (24 species) and Romaleidae (one species) were collected during the study period (table 2). The number of species collected per sampling season varied significantly (ANOVA, F = 8.35; P < 0.0001), between a minimum of 3.79 ± 0.33 (2009–2010) and a maximum of 7.37 ± 0.42 (2015–2016). As shown in fig. 3, the lowest values were recorded between 2008–2009 and 2010–2011 (LSD Fisher, P < 0.005), whereas the highest in 2007–2008, 2012–2013 and 2015–2016 (LSD Fisher, P < 0.05). Initially, all the weather variables and the season factor were included in the model analysis. Since an initial model including all-weather variables and the season factor did not show any significant effects, the season factor was removed and a resulting model was achieved. A good diagnosis of residuals was observed and the number of RD whereas significant (P = 0.020) this last variable can be considered at 90% confidence (table 3).
Mean species richness in natural grasslands of Laprida, Buenos Aires province. Different letters indicate significant differences (LSD Fisher P < 0.05).

Grasshopper species collected per season in natural grasslands of Laprida, Buenos Aires province (2005–2006 to 2015–2016)

Generalized linear model (GLM) results evaluating the relationship between species richness and climatic variables.

RD, Number of rainy days from September to sampling date; RAS, Rainfall accumulated from September to the sampling date; TAN, thermal amplitude of November; TAO, Thermal amplitude of October; TAS, Thermal amplitude of September; RAO, Rainfall accumulated from October to the sampling date. *p < 0.05, **p < 0.01.
Dichroplus maculipennis and B. bruneri were the most abundant species, reaching the highest densities from 2008–2009 to 2010–2011 (table 4, fig. 4), the maximum values registered in these seasons for D. maculipennis were 27, 50 and 29.9 ind m−2, respectively (fig. 4a). Unlike D. maculipennis, the density of B. bruneri was higher in 2008–2009 and 2009–2010, with maximum values of 22 and 23.65 ind m−2 (fig. 4b), and decreased considerably in 2010–2011. The highest density of D. elongatus was observed in 2015–2016, with a mean density of 3.62 ± 1.16 ind m−2 and a maximum of 10.29 ind m−2 (table 4). As shown in fig. 4c, the lowest densities were recorded in 2009–2010 and 2010–2011. In the case of D. pratensis, the mean density was less than 1 ind m−2 during the first seven sampling seasons (fig. 4d), but greater than 1 ind m−2 from 2012–2013. The highest mean density was recorded in 2015–2016, when the density reached a maximum of 3.74 ind m−2.
Dichroplus maculipennis, Borellia bruneri, Dichroplus elongatus and Dichroplus pratensis density (ind m−2) in Laprida, Buenos Aires province (2005–2006 to 2015–2016).

Mean density (Individuals/m2) of Borellia bruneri, Dicroplus elongatus, Dichroplus maculipennis and Dichroplus pratensis in grasslands of Laprida county, Buenos Aires province (2005–2006 to 2015–2016)

When considering the community of grasshoppers present in each site of the study area, the sum of densities of the four more abundant species (D. maculipennis, D. pratensis, D. elongatus, B. bruneri) was on average 50% greater than the density of the grasshopper community as a whole, except for 2005–2006 (45.6%). The density of B. bruneri and D. maculipennis represented, in the years of highest densities, between 79.1 and 85.8% of the total density of the community.
Gamma response and an inverse ligature were useful to model the density of each of the four species, considering the weather variables RAS to the sampling date, number of RD from September to the sampling date, fall and winter rainfall, as well as thermal amplitudes for September, October and November. The season was also used as a classification factor. Results of the model for B. bruneri indicated that a number of RD (P = 0.015), cumulative rainfall from September (at 93%, P = 0.064), and season of sampling (P = 0.0001) were significant covariates (table 5). For D. elongatus, a season of sampling showed a significant effect (P = 0.019), and given this factor, all covariates of temperature and rainfall were not significant. Consequently, the effect of the season was removed from the model and the behavior of the weather variables was observed. We identified that the number of RD and the thermal amplitude of October (TAO) contributed significantly to variations in the density of D. elongatus (table 6).
Generalized linear model (GLM) results evaluating the relationship between Borellia bruneri density and climatic variables

RD, Number of rainy days from September to sampling date; RAS, Rainfall accumulated from September to the sampling date; TAO, Thermal amplitude of October; TAS, Thermal amplitude of September; TAN, thermal amplitude of November. *p < 0.05, **p < 0.01.
Generalized linear model (GLM) results evaluating the relationship between Dichroplus elongatus density and climatic variables used

RD, Number of rainy days from September to sampling date; RAS, Rainfall accumulated from September to the sampling date; TAN, thermal amplitude of November; TAO, Thermal amplitude of October; TAS, Thermal amplitude of September; RAO, Rainfall accumulated from October to the sampling date. *p < 0.05, **p < 0.01.
As in the case of D. elongatus, the generalized linear model with gamma response and inverse ligature function for D. maculipennis detected only the effect of the season. However, in addition to the number of RD, the model considering only the quantitative variables also detected the winter rainfall, the TAO and the rainfall from September and October to the sampling date as explanatory variables of the density of D. maculipennis (table 7).
Generalized linear model (GLM) results evaluating the relationship between Dichroplus maculipennis density and climatic variables

RD, Number of rainy days from September to sampling date; RAS, Rainfall accumulated from September to the sampling date; TAN, thermal amplitude of November; TAO, Thermal amplitude of October; TAS, Thermal amplitude of September; RAO, Rainfall accumulated from October to the sampling date. *p < 0.05, **p < 0.01, ***p < 0.001.
The referred model was also applied to D. pratensis, which showed no effect of the season and had no significant weather covariates to model its density. In this case, we considered it was not relevant for our hypothesis to apply the model only with the regressor variables.
Regarding weather variables that contributed significantly to species density in the applied models, we observed that the highest densities of D. maculipennis and B. bruneri were related to the lowest RAS to the sampling date (fig. 5). Also, higher densities of D. maculipennis and B. bruneri and lower of D. elongatus were observed in those seasons with fewer RD (fig. 6), both situations corresponding to sampling seasons 2008–2009 to 2009–2010. Grasshopper species showed different density trends according to the thermal amplitude in October. Density of D. elongatus was higher when the thermal amplitude was lower, whereas the density of D. maculipennis was higher when there was a wider thermal amplitude (fig. 7).
Relation between cumulative rainfall since September to sampling date with densities of Borellia bruneri and Dichroplus maculipennis in Laprida, Buenos Aires province (2005–2006 to 2015–2016).

Relationship between the mean number of rainy days and densities of Borellia bruneri, Dihroplus elongatus and Dichroplus maculipennis in Laprida, Buenos Aires province (2005–2006 to 2015–2016).

Relationship between the TAO with Dichroplus elongatus and Dichroplus maculipennis densities in Laprida, Buenos Aires province (2005–2006 to 2015–2016).

Discussion
The spatial and temporal patterns of rainfall in the Pampas region of Argentina maintained an alternation of periods of high and low rainfall during much of the 20th century and so far into the 21st century (Scarpati and Capriolo, Reference Scarpati and Capriolo2013). The alternation of dry and wet periods is the climatic phenomenon with the greatest hydrological and agricultural impact in the Pampas (Bohn et al., Reference Bohn, Cintia Piccolo and Perillo2011; Ferrelli, Reference Ferrelli2017). Severe drought events have been recently observed in certain areas of this region (Forte Lay et al., Reference Forte Lay, Scarpati, Spescha, Capriolo, Jones and Scarpati2007; Minetti et al., Reference Minetti, Vargas, Poblete and Bobba2010).
During our study, we observed an alternation of periods of high rainfall and drought. The lapse between 2008 and 2010 was the driest in 47 years and the temperature was well above historical records (National Meteorological Service, 2009). The mean annual rainfall for all seasons except for the period between 2008 and 2010 was 921.6 mm, similar to that recorded by Recavarren (Reference Recavarren2016) for Laprida county (912 mm), whereas for 2008–2010 it was approximately 44% less (520 mm). In addition, we observed that the number of RD decreased by approximately 40% in the driest seasons. Generally, the highest seasonal rainfall was recorded in summer and spring, as previously reported by Recavarren (Reference Recavarren2016), who found that in this area 33 and 31% of the total rains are accumulated in summer and spring, respectively.
In grassland ecosystems, water availability is the major limiting factor to primary production (Sala et al., Reference Sala, Parton, Joyce and Lauenroth1988). Therefore, changes in rainfall patterns (in terms of both total inputs and frequency) that increase the risk of drought are likely to have a major impact (Barnett and Facey, Reference Barnett and Facey2016). For example, during the drought of 2008–2010, there was a loss of up to 70% of different forage resources (Recavarren, Reference Recavarren2016). Rainfall variations also have an impact on the dynamics and structure of the different local invertebrate communities. In addition to abiotic factors such as temperature and water availability (e.g., Bale et al., Reference Bale, Masters, Hodkinson, Awmack, Bezemer and Brown2002), the composition and diversity of the plant communities play a bottom-up role in structuring arthropod communities (Perner et al., Reference Perner, Wytrykush, Kahmen, Buchmann, Egerer, Creutzburg, Odat, Audorff and Weisser2005; Hertzog et al., Reference Hertzog, Meyer, Weisser and Ebeling2016).
Previous studies about the impact of changes in rainfall patterns on the plant community suggested that they could influence insect species richness (Zavaleta et al., Reference Zavaleta, Shaw, Chiariello, Thomas, Cleland, Field and Mooney2003; Adler and Levine, Reference Adler and Levine2007) and shape the composition of their communities (Sandel et al., Reference Sandel, Goldstein, Kraft, Okie, Shuldman, Ackerly, Cleland and Suding2010; Yang et al., Reference Yang, Li, Wu, Zhang, Li and Wan2011). In most grassland ecosystems, a high insect species richness is positively associated with a high plant richness and a great heterogeneity in the vegetation structure (Joern, Reference Joern2005). Mariottini et al. (Reference Mariottini, De Wysiecki and Lange2013) recorded 22 grasshopper species associated with different plant communities (halophilous, native and disturbed grasslands and implanted pastures) in Laprida county during five study seasons from 2005 to 2010. Considering a study period of six additional years and natural grasslands distributed in other areas of the county, the cumulative grasshopper richness increased to 25 species distributed in six subfamilies of Acrididae and one of Romaleidae. Similar species richness has been reported in other areas of the Pampas (Sánchez and De Wysiecki, Reference Sánchez and De Wysiecki1993; Cigliano et al., Reference Cigliano, De Wysiecki and Lange2000; De Wysiecki et al., Reference De Wysiecki, Sánchez and Ricci2000, Reference De Wysiecki, Torrusio and Cigliano2004).
Our results showed that RAS to the sampling date and the number of RD were the variables that explained most of the variation in the number of species recorded and that the driest seasons had the lowest species richness. Kemp and Cigliano (Reference Kemp and Cigliano1992) studied species richness of grasshoppers from 1986 to 1992 in two regions of Montana (USA), and analyzed changes before and after an extreme drought that occurred in 1988 with different long-term drought trends. They observed a significant decrease in the species richness of rangeland grasshoppers after the drought in the eastern and south-central region of Montana, where drought intensity had been increasing for 20 years. However, in the north-central region, which also experienced the drought of 1988 but showed no long-term drought trend, the authors did not observe a post-drought reduction in the overall species richness. They suggested that as the regional drought intensity increases, there might be an increased likelihood that a single year of extreme drought would also result in a significant long-term reduction in species richness.
Considering the entire study period, the most abundant species were D. maculipennis and B. bruneri. The climate variables that largely explained the density variation of B. bruneri were the number of RD and RAS to the sampling date. In the case of D. maculipennis, besides the two variables mentioned above, winter rainfall, rainfall accumulated from October to the sampling date, and the TAO also influenced its density. Our results indicated that seasons with less rainfall and fewer RD favored the abundance of these two species.
Dichroplus maculipennis is considered historically and currently one of the most damaging species of grasshoppers in Argentina, especially in areas of the Pampas and Patagonia (Daguerre, Reference Daguerre1940; Liebermann and Schiuma, Reference Liebermann and Schiuma1946; Ronderos, Reference Ronderos1959, Reference Ronderos1986; Lange and Cigliano, Reference Lange, Cigliano, Lecoq and Zhang2019a). The outbreak registered between 2008 and 2010 also covered 10 other counties of the center and southern Buenos Aires province, affecting approximately 2.500.000 hectares, with densities that reached the 75 ind m−2 in some sites. Borellia bruneri, a member of the Gomphocerinae subfamily, is frequently the most abundant species in the Pampas region and western Patagonia, and it is considered one of the most important grasshopper pests in the Pampas of Uruguay (Lorier et al., Reference Lorier, Miguel, Zerbino, Altier, Rebuffo and Cabrera2010; De Miguel et al., Reference De Miguel, Lorier and Zerbino2014). Unlike D. maculipennis and B. bruneri, the highest abundance of D. elongatus was recorded in seasons with high rainfall and a high number of RD.
According to Guo et al. (Reference Guo, Li and Gan2006), the responses of grasshoppers to climate change are not only determined by the individual effects of temperature and rainfall, but also by their interaction. In this sense, our results indicated that the TAO also contributed to the changes in the density of D. maculipennis and D. elongatus. However, the trend was not so clear, thus we consider that in order to understand this situation, additional studies using other temperature variables are required.
De Wysiecki et al. (Reference De Wysiecki, Arturi, Torrusio and Cigliano2011) evaluated the influence of weather and plant communities on grasshopper density over a 14-year period (1996–2009) in Benito Juárez county, which neighbors Laprida. The four species recorded in the present study are also usually abundant and dominant in the grasshopper communities of Benito Juárez (Torrusio et al., Reference Torrusio, Cigliano and De Wysiecki2002; De Wysiecki et al., Reference De Wysiecki, Torrusio and Cigliano2004). The authors analyzed the seasonal (fall, winter, spring, summer) changes in temperature and rainfall and observed that weather conditions changed over the years, with a period of high rainfall (2001–2003), in which abundance of D. elongatus was positively affected by summer rainfall. An outbreak of D. elongatus occurred in 2001 and 2002 in the area with mean densities of 27.4 ind m−2 (Cigliano et al., Reference Cigliano, Torrusio and De Wysiecki2002). De Wysiecki et al. (Reference De Wysiecki, Arturi, Torrusio and Cigliano2011) also found that seasonal temperature and rainfall had no significant effect on the total grasshopper density. Therefore, it is necessary to analyze the dynamics of each particular species separately. For example, D. maculipennis tends to be abundant during seasons of low rainfall and in certain plant communities, whereas D. elongatus abounds during seasons of high rainfall and in various plant communities, while the total grasshopper density in the area tends to remain approximately constant.
Although D. pratensis is considered another representative grasshopper in the grasslands of the Pampas (Sánchez and De Wysiecki, Reference Sánchez and De Wysiecki1993; De Wysiecki et al., Reference De Wysiecki, Sánchez and Ricci2000, Reference De Wysiecki, Torrusio and Cigliano2004; Cigliano et al., Reference Cigliano, De Wysiecki and Lange2000; Torrusio et al., Reference Torrusio, Cigliano and De Wysiecki2002), its density in our study was significantly lower than of the other three species, was not influenced by seasons, and no significant climate covariates were rescued to model its density.
Dichroplus elongatus, D. maculipennis and D. pratensis are mixed-feeders that consume grasses and dicots (Gandwere and Ronderos, Reference Gandwere and Ronderos1975; De Wysiecki and Sánchez, Reference De Wysiecki and Sánchez1992; Mariottini et al., Reference Mariottini, De Wysiecki and Lange2011, Reference Mariottini, Lange, Cepeda and De Wysiecki2019), whereas B. brunneri is an oligophagous and grass-feeder species (Carbonell et al., Reference Carbonell, Cigliano and Lange2017; Mariottini et al., Reference Mariottini, Mancini, Trofino, de Wysiecki and Lange2021). De Wysiecki et al. (Reference De Wysiecki, Arturi, Torrusio and Cigliano2011) observed that D. elongatus and D. pratensis were associated with highly disturbed pastures, whereas B. bruneri and D. maculipennis are common in areas of halophilous and native grasslands with sparse vegetation and patches of bare soil. The two latter species are mostly found in rather dry areas with a little cover of short grasses and are less abundant in areas with dense and tall vegetation (Carbonell, Reference Carbonell1995).
Several studies have highlighted that water stress induces changes in plant diversity (intraspecific variation in drought tolerance), quantity (changes in the structure and biomass) and quality (shifts in nutrient concentration and allocation, reduced water content, increased leaf- toughness, and altered defensive chemistry), which can all affect herbivore foraging and performance (Brodbeck and Strong, Reference Brodbeck, Strong, Barbosa and Schultz1987; Mattson and Haack, Reference Mattson and Haack1987; Huberty and Denno, Reference Huberty and Denno2004; Behmer and Joern, Reference Behmer, Joern, Barbosa, Letourneau and Agrawal2012). Lenhart et al. (Reference Lenhart, Eubanks and Behmer2015) manipulated water inputs in open grassland plots of Balcones Canyon lands National Wildlife Refuge in Texas (USA) during a severe drought and assessed the response of plants and insect herbivores. They found that the abundance of mixed-feeders declined at a slower rate as the drought progressed in the watered plots, which was associated with higher grass biomass. Joern (Reference Joern1985) observed that although mixed-feeders utilize both grasses and forbs, most of these species feed mainly on forbs. Mixed feeders tightly regulate macronutrient intake through the mixing of diets (Behmer and Joern, Reference Behmer and Joern2008), thus a greater forb richness would allow generalist grasshoppers more flexibility in the mixing options.
Based on our results and those of De Wysiecki et al. (Reference De Wysiecki, Arturi, Torrusio and Cigliano2011), we could infer that the abundance of the mixed-feeder D. elongatus would respond favorably to the increase in forage quality and quantity associated with spring and summer rainfall. This melanopline is a ubiquitous species that may readily become a serious pest (Lange and Cigliano, Reference Lange, Cigliano, Lecoq and Zhang2019b). It seems to show the ability to adapt to different environments, and it is abundant in grasslands subjected to grazing by cattle with high coverage of forbs. Torrusio et al. (Reference Torrusio, Cigliano and De Wysiecki2002) and Mariottini et al. (Reference Mariottini, De Wysiecki and Lange2013) observed that D. elongatus is associated with grasslands where the introduced perennial forbs represent 40–50% of the total grassland cover.
Additionally, water stress has been shown to affect the reproduction and abundance of grasshoppers by influencing life-history traits (Rourke, Reference Rourke2000; Gardiner, Reference Gardiner2010), and to enhance their growth by increasing plant nutrients (Lenhart et al., Reference Lenhart, Eubanks and Behmer2015). In our study, the abundance of D. maculipennis and B. bruneri was favored in the drier seasons, which may be related to the feeding of drought-stressed plants that have increased concentrations of soluble proteins and amino acids. Generally, available dietary N can potentially regulate population processes like growth and dispersal in insect herbivores (Mattson, Reference Mattson1980; White, Reference White1993). Franzke and Reinhold (Reference Franzke and Reinhold2011) demonstrated that individuals of Chorthippus biguttulus (Acrididae) that fed on drought-stressed plants showed beneficial effects on life-history traits, including a higher reproductive success than individuals that fed on control plants. The authors inferred that herbivore performance is influenced by the increased concentrations of soluble proteins and amino acids in plants under drought stress, which in turn increased the population performance and consequently, the population density of C. biguttulus, while conditions of extreme moisture events might cause negative population trends.
On the other hand, Cigliano et al. (Reference Cigliano, De Wysiecki and Lange1995) indicated that the preferred sites for D. maculipennis oviposition are low fields with compact soils and scarce vegetation cover. We considered that the warm temperature due to the sparse vegetation and bare ground might have affected some demographic aspects of this species, and consequently, its density. In the outbreak seasons (2008–2010), we observed a faster nymphal development cycle. At the beginning of December, we observed a large part of the population of D. maculipennis and B. bruneri already in the adult stage, when in general most individuals reach this stage by the end of this month (Mariottini et al., Reference Mariottini, De Wysiecki and Lange2011).
Although the results of this study improved the knowledge on population dynamics of grasshopper species in the southern Pampas of Argentina, further work is required on the influence of other environmental variables in the life cycle of these insects, highlighting the relevance of focusing on functional groups of plants and insect herbivores. A better understanding of the dynamic relationships between extrinsic and intrinsic factors will facilitate forecasting and suggest nodes in the life cycle of economically important species that are susceptible to management.
Supplementary material
The supplementary material for this article can be found at https://doi.org/10.1017/S000748532100119X
Acknowledgements
We thank Mr. Alfredo Berardi for the collaboration with this project, the landowners and the ‘Comisión de Lucha contra las Plagas de Laprida’ who provided the climatic data set.
Financial support
This study was supported by Consejo Nacional de Investigaciones Científicas y Tecnológicas (CONICET) (PIP 00464/2016).
Conflict of interest
All authors contributing to the manuscript submitted that they have no conflicts of interest.